2009
Quantitative Susceptibility Mapping to evaluate the Iron deposition and Venous Blood Oxygenation in the brain for the differentiation of Mild Cognitive Impairment and Alzheimer’s disease: A pilot study1Department of Imaging Sciences and Interventional Radiology, Sree Chitra Tirunal Institute for Medical Sciences and Technology, Trivandrum, India, 2Department of Neurology, Sree Chitra Tirunal Institute for Medical Sciences and Technology, Trivandrum, India, 3GE Healthcare, Banglore, India
Synopsis
Oxygen extraction fraction (OEF) in the brain can be obtained by Quantitative Susceptibility Mapping (QSM). QSM can also estimate iron which is implicated in the pathogenesis of Alzheimer’s disease and its pre-symptomatic antecedents. The differences of OEF and iron values among the controls, Mild Cognitive Impairment and AD were investigated by ROI based comparisons using a one-way analysis of variance. These values in the posterior brain regions were found to have a trend towards increment in patient groups compared with controls, in this pilot study. Future studies are required to validate the usefulness of this technique as potential biomarker.
Introduction
The association of oxygen extraction fracion (OEF) (1) and brain iron deposition in Alzheimer's disease (AD) and Mild Cognitive Impairment (2) has not been investigated previously. The aim of the present study was to examine the oxygen extraction fraction and the susceptibility changes caused by iron accumulation in cognitive normal elderly control (EC), those with MCI, and those with AD. Moreover, we aimed to investigate the correlation between OEF and brain iron deposition in patients.
Methods
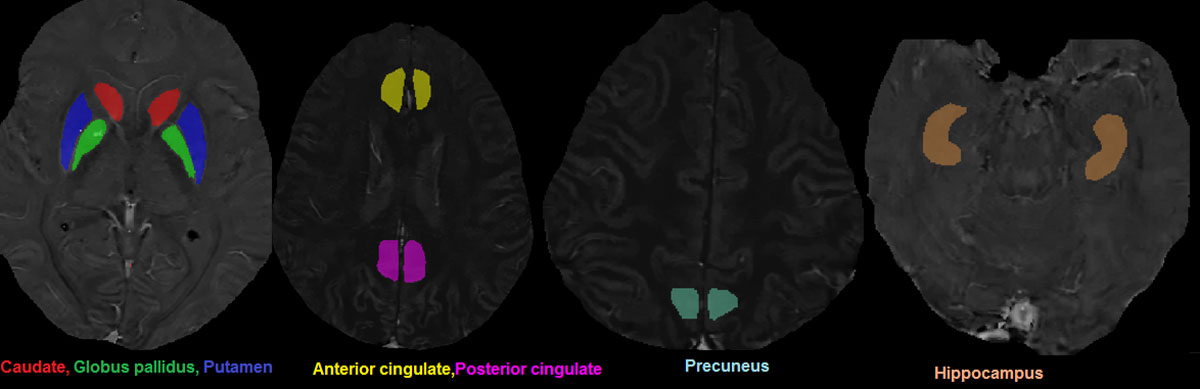
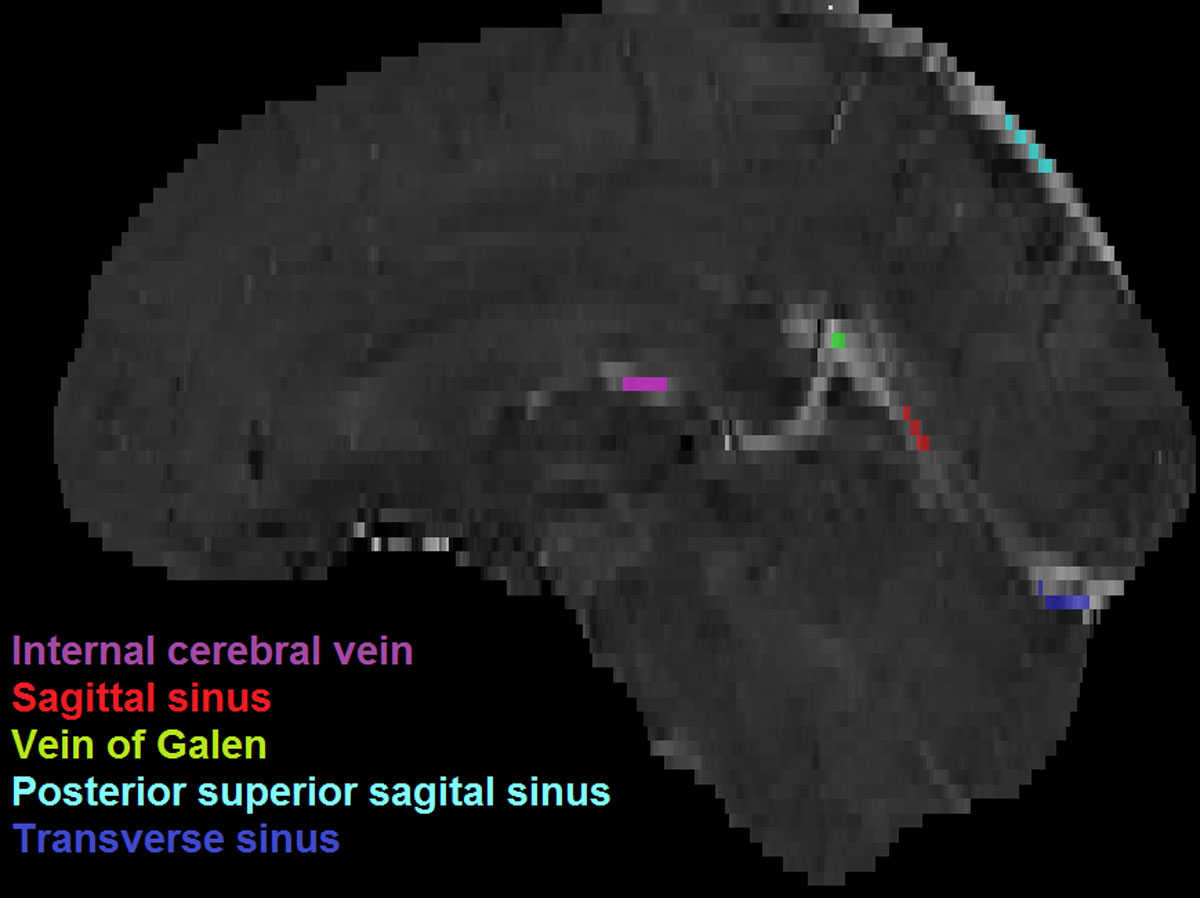
This prospective study was approved by Institutional Ethics Committee of Sree Chitra Tirunal Institute for Medical Sciences and Technology (SCTIMST) and informed consent was obtained from all participants. Patients diagnosed to be having MCI (10), and AD (10) at the decade old well-established Dementia Clinic at SCTIMST were included in the study. Ten cognitively normal elderly control volunteers were recruited from the local population through advertisements. All participants underwent detailed clinical, neurological and neuropsychological evaluation and had no contraindications to MRI scanning. MRI scans were acquired in each subject using a 3T whole-body scanner (GE, 750W Discovery) with a 32 channel phased array head coil. MRI gradient echo images for QSM reconstruction and calculation of OEF were acquired with the same spoiled 3D multi-echo gradient-echo sequence with five equally spaced echoes (TR/TE1/FA = 62.1 ms/20 ms/15, matrix = 512 x 512, slice thickness = 2 mm, slices = 70, acquisition time = 6:29 minutes). A T1-weighted BRAVO sequence (TR/TE/FA = 7.9 ms/3 ms/12°, acquisition time = 4:26 minutes) with 1 mm isotropic spatial resolution was used for evaluating grey matter volume changes. QSM images were reconstructed retrospectively from the SWAN data by implementing the Morphology Enabled Dipole Inversion (MEDI) method. Initially, the brightness and contrast of the images were adjusted and zoomed by factor of two to avoid partial volume effects. The region interest measures of iron changes in QSM data were extracted bilaterally from caudate, putamen, globus pallidus, thalamus, hippocampus, precuneus, and posterior cingulate (Figure 1). The susceptibility measurements of four candidate veins namely posterior superior sagittal sinus, posterior cortical vein, internal cerebral veins and straight sinus were performed using QSM map (Figure 2). Also, a mean and standard deviation of susceptibility from a reference region, was also measured from the Cerebrospinal fluid of the third ventricle. Oxygen extraction fraction (OEF) was obtained using the relation where Δχdo is the magnetic susceptibility difference between fully deoxygenated (we used 4.π.0.18 ppm) and fully oxygenated blood and Hct (we used 0.45) is the blood haematocrit. Then the oxygen extraction (OEF) can be obtained by the relation OEF= 1- Yv under usual conditions at which Ya ≈100%. Statistical analysis of entire data was performed using SPSS software with significance set at P<0.05.Results and Discussion
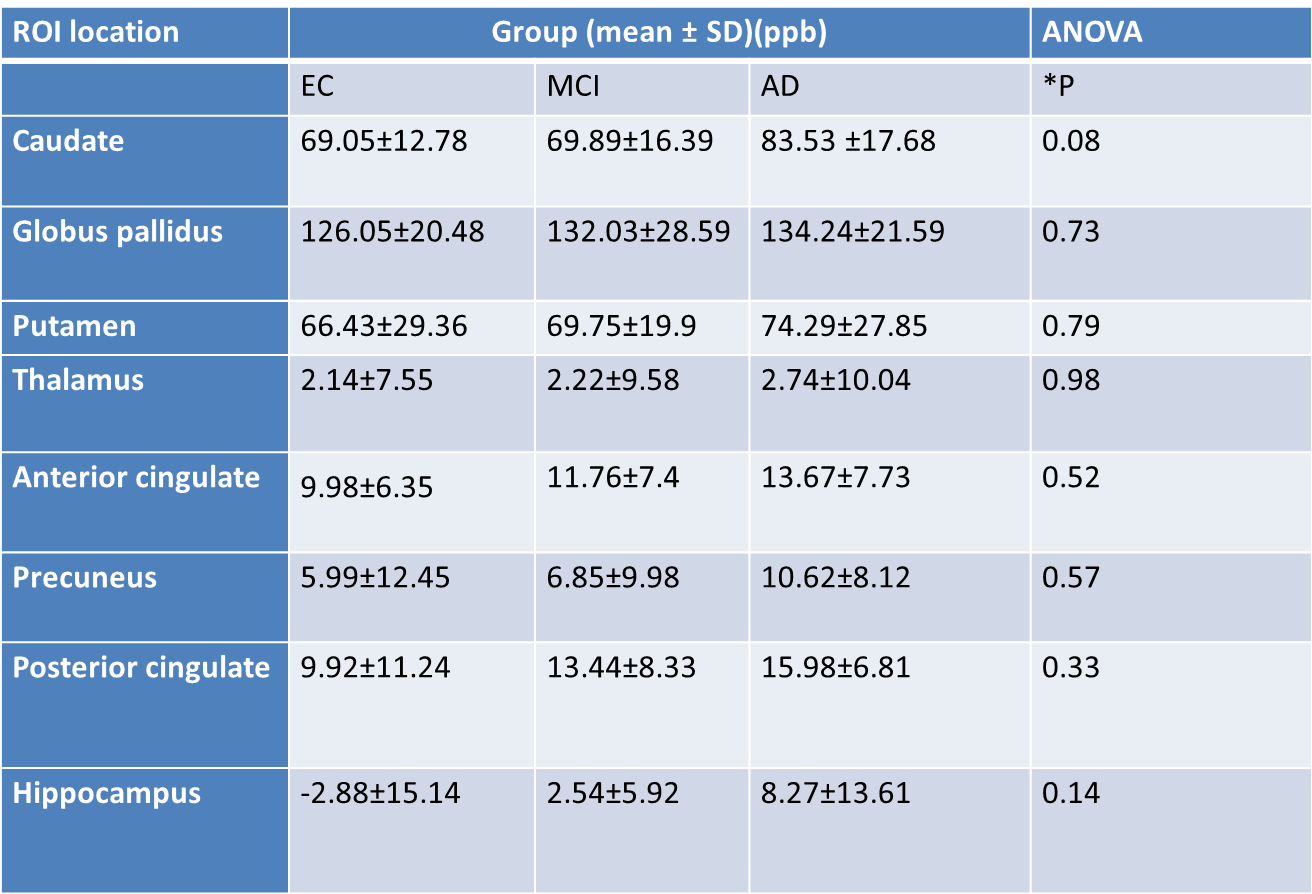
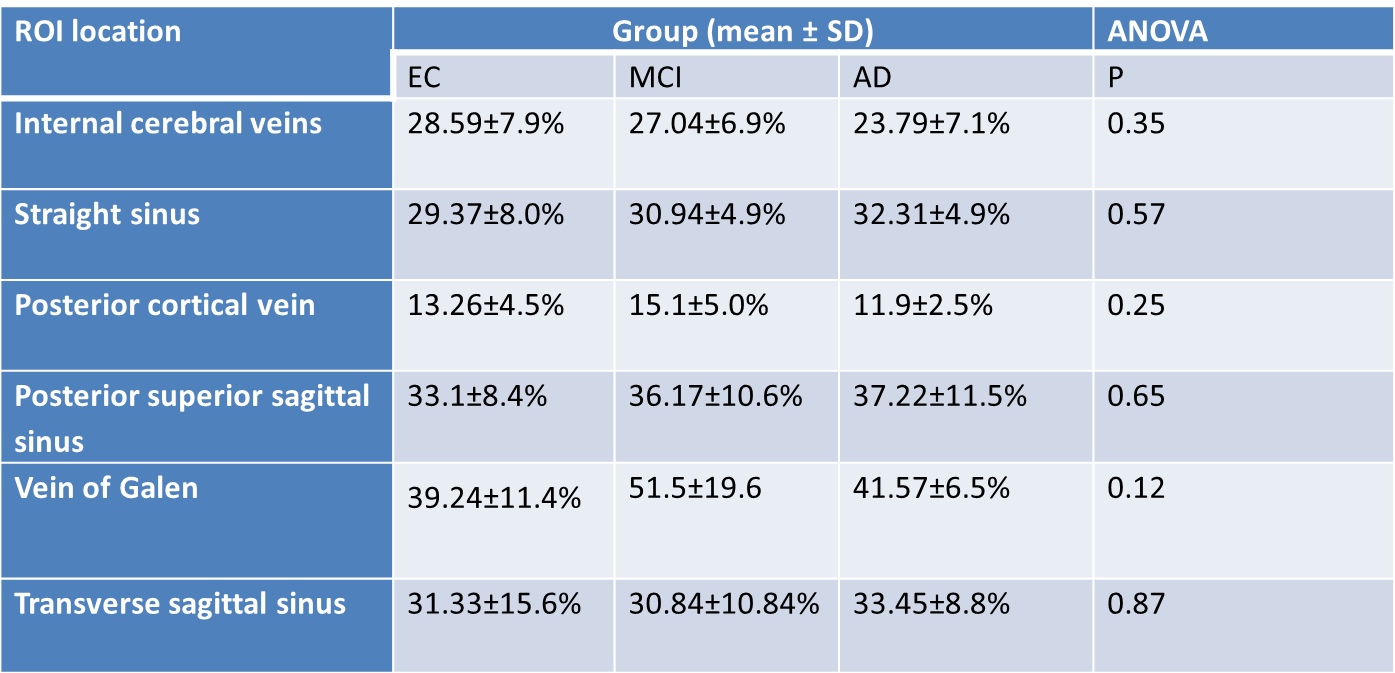
Both MCI and AD had elevated susceptibility values within the anterior cingulate, precuneus, posterior cingulate and hippocampus (Table 2). The OEF was decreased in the internal cerebral vein, posterior cortical vein and vein of Galen in AD compared to controls. While the OEF in the posterior sagittal sinus, straight sinus and transverse sagittal sinus was increased in both patient groups in comparison to controls (Table 1). However, the OEF values failed to reveal any correlation with susceptibility values. The increased OEF findings are consistent with the capillary dysfunction hypothesis of AD; increased capillary dysfunction leads to increased oxygen extraction in order to compensate the metabolic requirements of the brain tissues. Although none of these parameters were statistically significant, they showed a trend towards differentiation of MCI and AD from controls in this pilot study. Future studies are required to validate the usefulness of this technique as potential biomarker.Conclusion
This pilot study shows that QSM is a feasible and useful technique for measuring OEF and iron deposition in dementia with a potential of being a biomarker
Acknowledgements
This study was supported by funds from Science and Engineering Research Board (SERB) to S.R in the form of National postdoctoral fellowship (N-PDF).References
1. Thomas BP, Sheng M, Tseng BY, et al. Reduced global brain metabolism but maintained vascular function in amnestic mild cognitive impairment. J Cereb Blood Flow Metab. 2017;37:1508–1516.
2. Cabronero JA, Williams GB, Blanco AC, et al. In Vivo Quantitative Susceptibility Mapping (QSM) in Alzheimer's Disease. PLoS One. 2013; 8(11): e81093.
3. Mao D, Li Y, Liu P, et al. Three-Dimensional Mapping of Brain Venous Oxygenation Using R*2 Oximetry. Magnetic Resonance in Medicine. 2017; DOII: 10.1002/mrm.26763.
Figures