2008
Investigation of cerebral perfusion differences between the 2xTg Alzheimer’s disease mouse model and age-matched controls using FAIR ASL MRI1Laboratory of Clinical Investigation, Magnetic Resonance Imaging and Spectroscopy Section, National Institute on Aging, The National Institutes of Health, Baltimore, MD, United States, 2Laboratory of Cardiovascular Science, National Institute on Aging, The National Institutes of Health, Baltimore, MD, United States, 3Laboratory of Neuroscience, National Institute on Aging, The National Institutes of Health, Baltimore, MD, United States
Synopsis
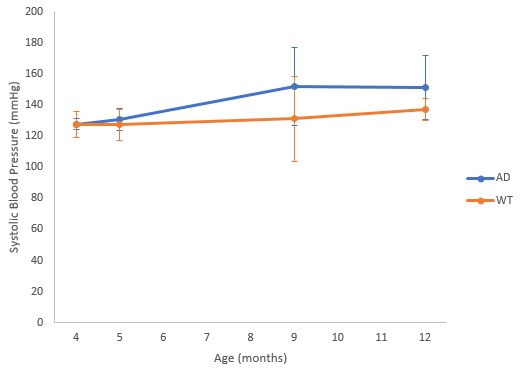
Cerebral blood flow (CBF) is an emerging biomarker of Alzheimer’s disease (AD). To correlate CBF to other known measures of AD, such as cortical thinning and volume loss, we assessed perfusion differences between a 2xTg-AD mouse model and age-matched wild-type mice using a FAIR RARE MRI sequence. Our results demonstrate greater systolic blood pressure (SBP) in AD mice as they age as well as hypoperfusion within the cerebral cortex at 12 months of age.
Introduction
Alzheimer’s disease (AD) is most often characterized by neuronal loss, ventricular enlargement, and accumulation of amyloid plaques and neurofibrillary tangles.1,2 However, recent studies point to the potential use of cerebral blood flow (CBF) as a physiologic biomarker of AD.3,4 To better understand CBF’s potential as an AD biomarker, there is a strong need to establish a translational model of AD. While hypoperfusion of the cerebral cortex has been reported in other transgenic AD mouse models,5 the 2xTg-AD mice are of particular interest because they exhibit higher systolic blood pressure (SBP).6 We sought to elucidate perfusion differences between the 2xTg-AD model and wild-type (WT) mice using flow-sensitive alternating inversion recovery (FAIR) rapid acquisition with relaxation enhancement (RARE).Methods
2xTg-AD mice (APPswe, PSENIdE9) were bred in-house, with genotype confirmed after weaning. Four male 2xTg-AD mice and four male age-matched WT control mice were studied at 6 months and 12 months of age. Experiments were conducted on a 7T Bruker Biospec MRI system using an 86-mm quadrature volume transmit coil and 2 x 2 mouse head array receive coil (Bruker Biospin, Ettlingen, Germany). Mice were anesthetized with 2 L/min oxygen and 2% isoflurane and maintained at 0.6-0.8 L/min oxygen and 1.5-1.7% isoflurane and 37 °C, with monitoring of vital signs (SA Instruments, Stony Brook, NY). Typical respiration rate was 60-90 breaths/min. Data were acquired with a FAIR RARE sequence with TR = 1 s, TE = 79 ms, 22 TIs, in-plane spatial resolution = 0.156 x 0.188 mm2, FOV = 20 x 24 mm2, and RARE factor of 32 with echo spacing = 5.6 ms on a single 0.5 mm-thick axial slice placed at the largest hippocampal extent. Apparent T1 values for selective and non-selective inversion were calculated using the ISA tool of ParaVision 6.0.1. CBF was estimated from7
$$CBF = \lambda\cdot\frac{T_1nonselective}{T_1blood}\cdot(\frac{1}{T_1selective}-\frac{1}{T_1nonselective})$$
where λ is the blood-brain partition coefficient (90 mL/100 g) and T1blood was taken as 2.3 s.8,9 T2-weighted images for anatomical segmentation and T2 mapping were generated with a multi-slice multi-echo sequence with 30 slices, TR = 6 s, 20 echo images, and TE from 9 to 180 ms. 3D images were analyzed (Figure 1) using VivoQuant (inviCRO, Boston, MA), and T2 calculated from mean ROI intensities. Cortical thickness was measured in VivoQuant. SBP was obtained at 4, 5, 9, and 12 months using a tail cuff.
Results
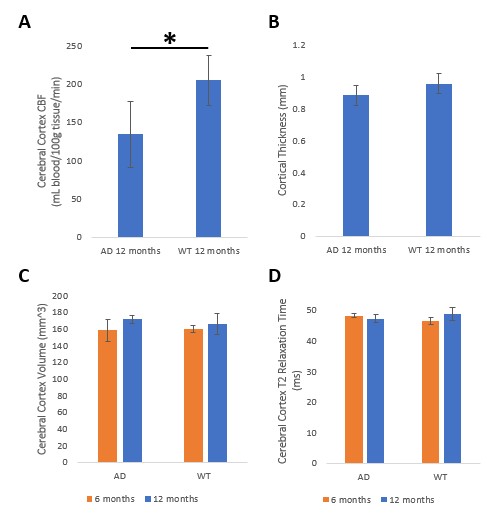
A trend toward higher SBP with age was observed in AD compared to WT mice (Figure 2). Since hypoperfusion of the cerebral cortex has been reported in AD,10 an ROI for localized CBF quantification was defined within the cerebral cortex (Figure 3). Cerebral cortex CBF was greater in WT than in AD mice at 12 months of age (Figure 4A; p ≤ 0.05), although there was no statistically significant difference in cortical thickness between groups at 12 months (Figure 4B). The cerebral cortex volume was similar for both AD and WT mice at 6 and 12 months (Figure 4C). Likewise, T2 of the cerebral cortex was similar for both AD and WT mice at 6 and 12 months (Figure 4D).Discussion
Hypertension is known to be a risk factor of AD and may cause remodeling of brain vasculature, leading to hypoperfusion.11 Our 2xTg-AD mice display greater SBP by age 12 months as well as hypoperfusion of the cerebral cortex. No statistically significant differences were found between the 2xTg-AD and WT mice in average cortical thickness, cerebral cortex volume, or T2 relaxation time of the cerebral cortex. The results for this mouse strain are somewhat at variance with previous findings of cortical thinning in AD patients.12,13 However, the typical onset of AD in transgenic mice, as defined by cognitive decline and the presence of substantial amyloid plaques and neurofibrillary tangles, may be as long as 12-15 months,14 while our data are from animals aged 12 months, so that cortical thinning may become evident at later stages of development. Interestingly, there appears to be no age effect in cerebral cortex volume and T2 relaxation time for both genotypes, although previous reports have found loss of cerebral cortex volume in aged WT mice.15 Another study showed no change in T2 relaxation time with age in WT mice and a reduction in T2 relaxation times in 2xTg-AD mice.16 We are currently greatly increasing our sample size in order to establish more definitive relationships.Conclusions
Our study showed trends toward higher SBP and hypoperfusion in the cerebral cortex in 2xTg-AD mice. Our current studies incorporate CBF measurements at later time-points and in additional specific brain regions.Acknowledgements
The authors would like to thank Akshay Naraine for assisting with data acquisition. This work was supported by the Intramural Research Program of the National Institute on Aging of the National Institutes of Health.References
1. Ott BR, Cohen RA, Gongvatana A, et al. Brain ventricular volume and cerebrospinal fluid biomarkers of Alzheimer's disease. J Alzheimers Dis. 2010;20(2):647-657.
2. Whitehouse PJ, Price DL, Struble RG, Clark AW, Coyle JT, Delon MR. Alzheimer's disease and senile dementia: loss of neurons in the basal forebrain. Science. 1982;215(4537):1237-1239.
3. Hays CC, Zlatar ZZ, Wierenga CE. The Utility of Cerebral Blood Flow as a Biomarker of Preclinical Alzheimer's Disease. Cell Mol Neurobiol. 2016;36(2):167-179.
4. Wierenga CE, Hays CC, Zlatar ZZ. Cerebral Blood Flow Measured by Arterial Spin Labeling MRI as a Preclinical Marker of Alzheimer's Disease. Journal of Alzheimers Disease. 2014;42:S411-S419.
5. Hebert F, Grand'Maison M, Ho MK, Lerch JP, Hamel E, Bedell BJ. Cortical atrophy and hypoperfusion in a transgenic mouse model of Alzheimer's disease. Neurobiology of Aging. 2013;34(6):1644-1652.
6. Gentile MT, Poulet R, Di Pardo A, et al. beta-Amyloid deposition in brain is enhanced in mouse models of arterial hypertension. Neurobiology of Aging. 2009;30(2):222-228.
7. Belle V, Kahler E, Waller C, et al. In vivo quantitative mapping of cardiac perfusion in rats using a noninvasive MR spin-labeling method. J Magn Reson Imaging. 1998;8(6):1240-1245.
8. Herscovitch P, Raichle ME. What Is the Correct Value for the Brain Blood Partition-Coefficient for Water. J Cerebr Blood F Met. 1985;5(1):65-69.
9. Barbier EL, St Lawrence KS, Grillon E, Koretsky AP, Decorps M. A model of blood-brain barrier permeability to water: accounting for blood inflow and longitudinal relaxation effects. Magn Reson Med. 2002;47(6):1100-1109.
10. Thomas T, Miners S, Love S. Post-mortem assessment of hypoperfusion of cerebral cortex in Alzheimer's disease and vascular dementia. Brain. 2015;138(Pt 4):1059-1069.
11. Skoog I, Gustafson D. Update on hypertension and Alzheimer's disease. Neurol Res. 2006;28(6):605-611.
12. Dickerson BC, Bakkour A, Salat DH, et al. The cortical signature of Alzheimer's disease: regionally specific cortical thinning relates to symptom severity in very mild to mild AD dementia and is detectable in asymptomatic amyloid-positive individuals. Cereb Cortex. 2009;19(3):497-510.
13. Du AT, Schuff N, Kramer JH, et al. Different regional patterns of cortical thinning in Alzheimer's disease and frontotemporal dementia. Brain. 2007;130(Pt 4):1159-1166.
14. Dewachter I, van Dorpe J, Spittaels K, et al. Modeling Alzheimer's disease in transgenic mice: effect of age and of presenilin1 on amyloid biochemistry and pathology in APP/London mice. Exp Gerontol. 2000;35(6-7):831-841.
15. Maheswaran S, Barjat H, Rueckert D, et al. Longitudinal regional brain volume changes quantified in normal aging and Alzheimer's APP x PS1 mice using MRI. Brain Res. 2009;1270:19-32.
16. Falangola MF, Dyakin VV, Lee SP, et al. Quantitative MRI reveals aging-associated T2 changes in mouse models of Alzheimer's disease. NMR Biomed. 2007;20(3):343-351.
Figures