2004
Prediction of Cognitive Impairment and Amyloid Deposition through Metabolic and Vascular Deficits in ADNI Cohorts1Sanders Brown Center on Aging, Lexington, KY, United States, 2Paul Laurence Dunbar High School, Lexington, KY, United States
Synopsis
Recent research has been focused on developing diagnostics based on amyloid-β and tau. However, metabolic and vascular changes pre-date both by several decades. The aim of this study was to exploit the coupling between glucose uptake in aerobic glycolysis and cerebral blood flow to produce a biomarker for metabolic dysfunction and amyloid-β deposition. Here we found that a decrease in glucose uptake in the presence of stable blood flow is spatially correlated with an increase in amyloid-β deposition and that uncoupling between metabolic and vascular function could drive amyloid-β deposition.
Introduction
Recent research has been focused on developing early diagnostic methods based on the hallmarks of Alzheimer’s disease (AD): amyloid β-peptide (Aβ) plaques and neurofibrillary tau tangles1. However, neurovascular and metabolic deficits have been shown to pre-date pathological symptoms by several decades2,3. The aim of this study was exploit the coupling between glucose uptake in aerobic glycolysis and cerebral blood flow to produce a flow glycolytic index (FGI) that can serve as a surrogate biomarker for metabolic dysfunction and anticipate amyloid-β deposition, and then to construct a classifier based on the biomarker. Specifically, we repurposed imaging data from the Alzheimer’s Disease Neuroimaging Initiative (ADNI). ADNI is a multi-site, longitudinal study that assesses clinical, imaging, and genetic biomarkers to characterize AD progression. Since metabolic dysfunction predate amyloid deposition by several decades, it was hypothesized that the negative correlation between the biomarker and amyloid deposition would be strongest in cognitively normal patients, intermediate in mild cognitive impairment, and weakest in AD.
Methods
Multimodal neuroimaging data (MRI and PET) from 193 patients ranging from normal cognition (n = 63) to mild cognitive impairment (n = 101) to Alzheimer’s disease (n = 29) were obtained from ADNI. Image Processing and Analysis: All images were in the Neuroimaging Informatics Technology Initiative format. 18F fluorodeoxyglucose (FDG) PET images were spatially normalized in Statistical Parametric Mapping (SPM) and mean intensity was extracted from 5 regions indicative of AD pathology4. Cortical reconstruction, volumetric segmentation and motion correction was performed with FreeSurfer 5.1 using the 2010 Desikan-Killany atlas5,6. Mean intensity was extracted from 130 regions. Florebetapir (Aβ indicator) PET images were segmented with FreeSurfer, and the standardized uptake value was calculated. Machine Learning: The nearest neighbor algorithm and a multilayer perceptron neural network with two hidden layers implemented in IBM SPSS were used to construct a classifier. A hyperbolic tangent served as the activation function, and optimized with scaled conjugate descent. 70% of data was partitioned for training, while missing data was excluded pairwise. Statistical Analysis: Analyses were performed with GraphPad Prism and IBM SPSS. Pearson’s r was used to calculate correlation between variables, and p-values are the result of two-tail tests (p < 0.05 were considered significant). An iterative Grub’s test was used to identify and remove outliers. FGI was calculated by linear regression of FDG on CBF and exhibiting residuals.Results
FDG and CBF were highly coupled in mild cognitive impairment for males and females, and remained correlated in females with AD, but not for males. Furthermore, FGI was negatively correlated with florbetapir concentration across the left inferior parietal, right inferior parietal, posterior cingulate, left inferior temporal, and right inferior temporal regions of the brain in gender-matched patients (p < 0.01). This suggests that physiologically, a decrease in glucose uptake in the presence of stable cerebral blood flow is spatially correlated with an increase in amyloid-β deposition. Differences in metabolic and vascular function across cognitive were further distinguished by the neural network, which achieved 71.0% accuracy in identifying mild cognitive impairment patients with a receiver operating characteristic of 0.722. Normalized importance of each feature was then calculated and plotted with the highest five features originating in FDG, FGI, and CBF values.
Discussion
Within Alzheimer’s patients, it is impossible separate the causal link between metabolic dysfunction and neurotoxic build-up in patients that already exhibit impairment7. However, AD progression could be identified by the strong correlation between FGI and Aβ in mild cognitive impairment. Another interesting finding is the high degree of gender influence on Alzheimer’s progression. While several studies have demonstrated the sex differences in cognitive impairment8, this study is the first to elucidate the extent of those differences with respect to multimodal neuroimaging. Finally, the specific differences in FGI and Aβ occur in the five brain regions implicated in the conversion from MCI to AD9. The results from this study indicate that the right inferior temporal region is a likely candidate for MCI differentiation.
Conclusion
These results suggest that uncoupling between metabolic and vascular function could drive amyloid-β deposition. Regions that exhibit abnormal FGI could serve as regions of pathological inquiry, and FGI can be used to non-invasively assess the efficacy of pharmaceutical interventions in clinical trials.Acknowledgements
No acknowledgement found.References
1. Dickson, D. W. Neuropathological diagnosis of Alzheimer's disease: a perspective from longitudinal clinicopathological studies. Neurobiol Aging 18, S21-26 (1997).
2. Thambisetty, M., Beason-Held, L., An, Y., Kraut, M. A. & Resnick, S. M. APOE epsilon4 genotype and longitudinal changes in cerebral blood flow in normal aging. Arch Neurol 67, 93-98, doi:10.1001/archneurol.2009.913 (2010).
3. Fleisher, A. S. et al. Apolipoprotein E epsilon4 and age effects on florbetapir positron emission tomography in healthy aging and Alzheimer disease. Neurobiol Aging 34, 1-12, doi:10.1016/j.neurobiolaging.2012.04.017 (2013).
4. Landau, S. M. et al. Associations between cognitive, functional, and FDG-PET measures of decline in AD and MCI. Neurobiol Aging 32, 1207-1218, doi:10.1016/j.neurobiolaging.2009.07.002 (2011).
5. Dale, A. M., Fischl, B. & Sereno, M. I. Cortical surface-based analysis. I. Segmentation and surface reconstruction. Neuroimage 9, 179-194, doi:10.1006/nimg.1998.0395 (1999).
6. Desikan, R. S. et al. An automated labeling system for subdividing the human cerebral cortex on MRI scans into gyral based regions of interest. Neuroimage 31, 968-980, doi:10.1016/j.neuroimage.2006.01.021 (2006).
7. Vlassenko, A. G. et al. Spatial correlation between brain aerobic glycolysis and amyloid-beta (Abeta ) deposition. Proc Natl Acad Sci U S A 107, 17763-17767, doi:10.1073/pnas.1010461107 (2010).
8. Li, R. & Singh, M. Sex differences in cognitive impairment and Alzheimer's disease. Front Neuroendocrinol 35, 385-403, doi:10.1016/j.yfrne.2014.01.002 (2014).
9. Morbelli, S. et al. 18F-FDG PET diagnostic and prognostic patterns do not overlap in Alzheimer's disease (AD) patients at the mild cognitive impairment (MCI) stage. Eur J Nucl Med Mol Imaging, doi:10.1007/s00259-017-3790-5 (2017).
Figures
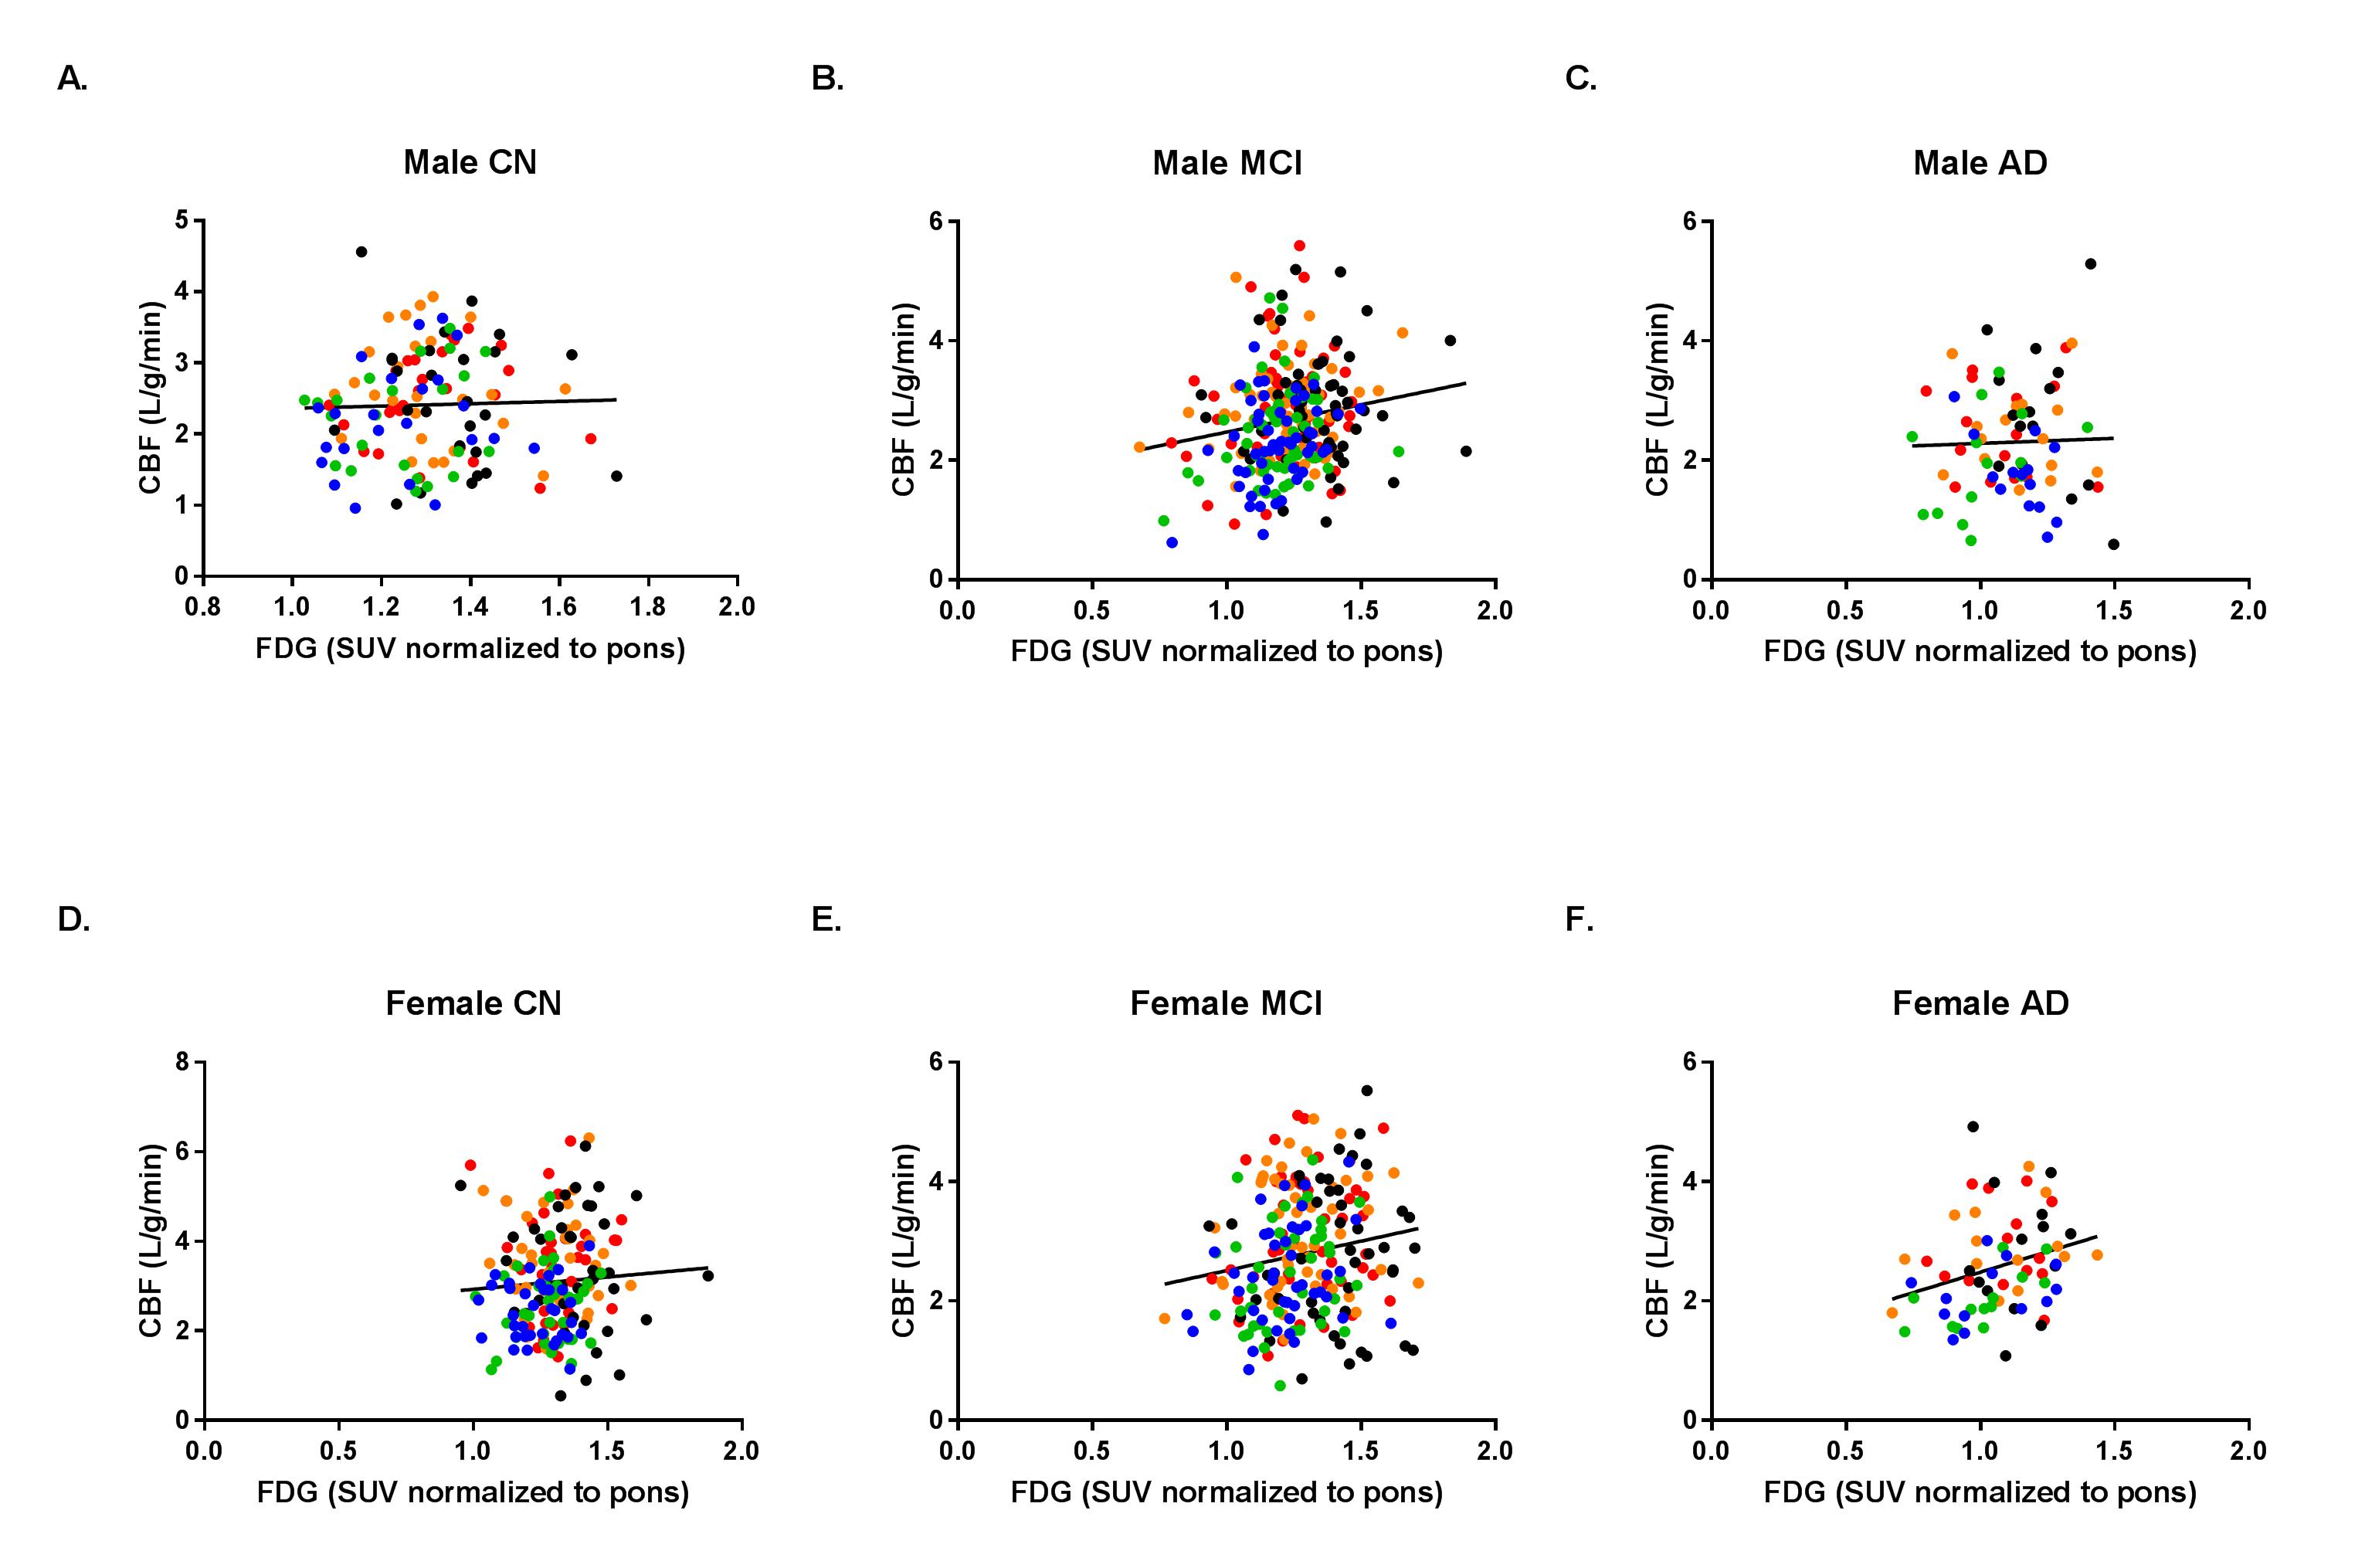
Figure 1. FDG and CBF are highly correlated in mild cognitive impairment.
Color-coded linear regression plots of CBF against FDG for male CN (A.), MCI (B.), and AD (C.) and female CN (D.), MCI (E.), and AD (F.) patients (N = 193). Red circles indicate left inferior parietal, orange circles are right inferior parietal, black cirlces are posterior cingulate, green circles are left inferior temporal, and blue circles correspond to right inferior temporal. P-values are significant in male MCI, female MCI, and female AD. FDG: Fludeoxyglucose (18F); CBF: Cerebral blood flow; CN: Cognitively normal; MCI: Mild cognitive impairment; AD: Alzheimer’s disease.
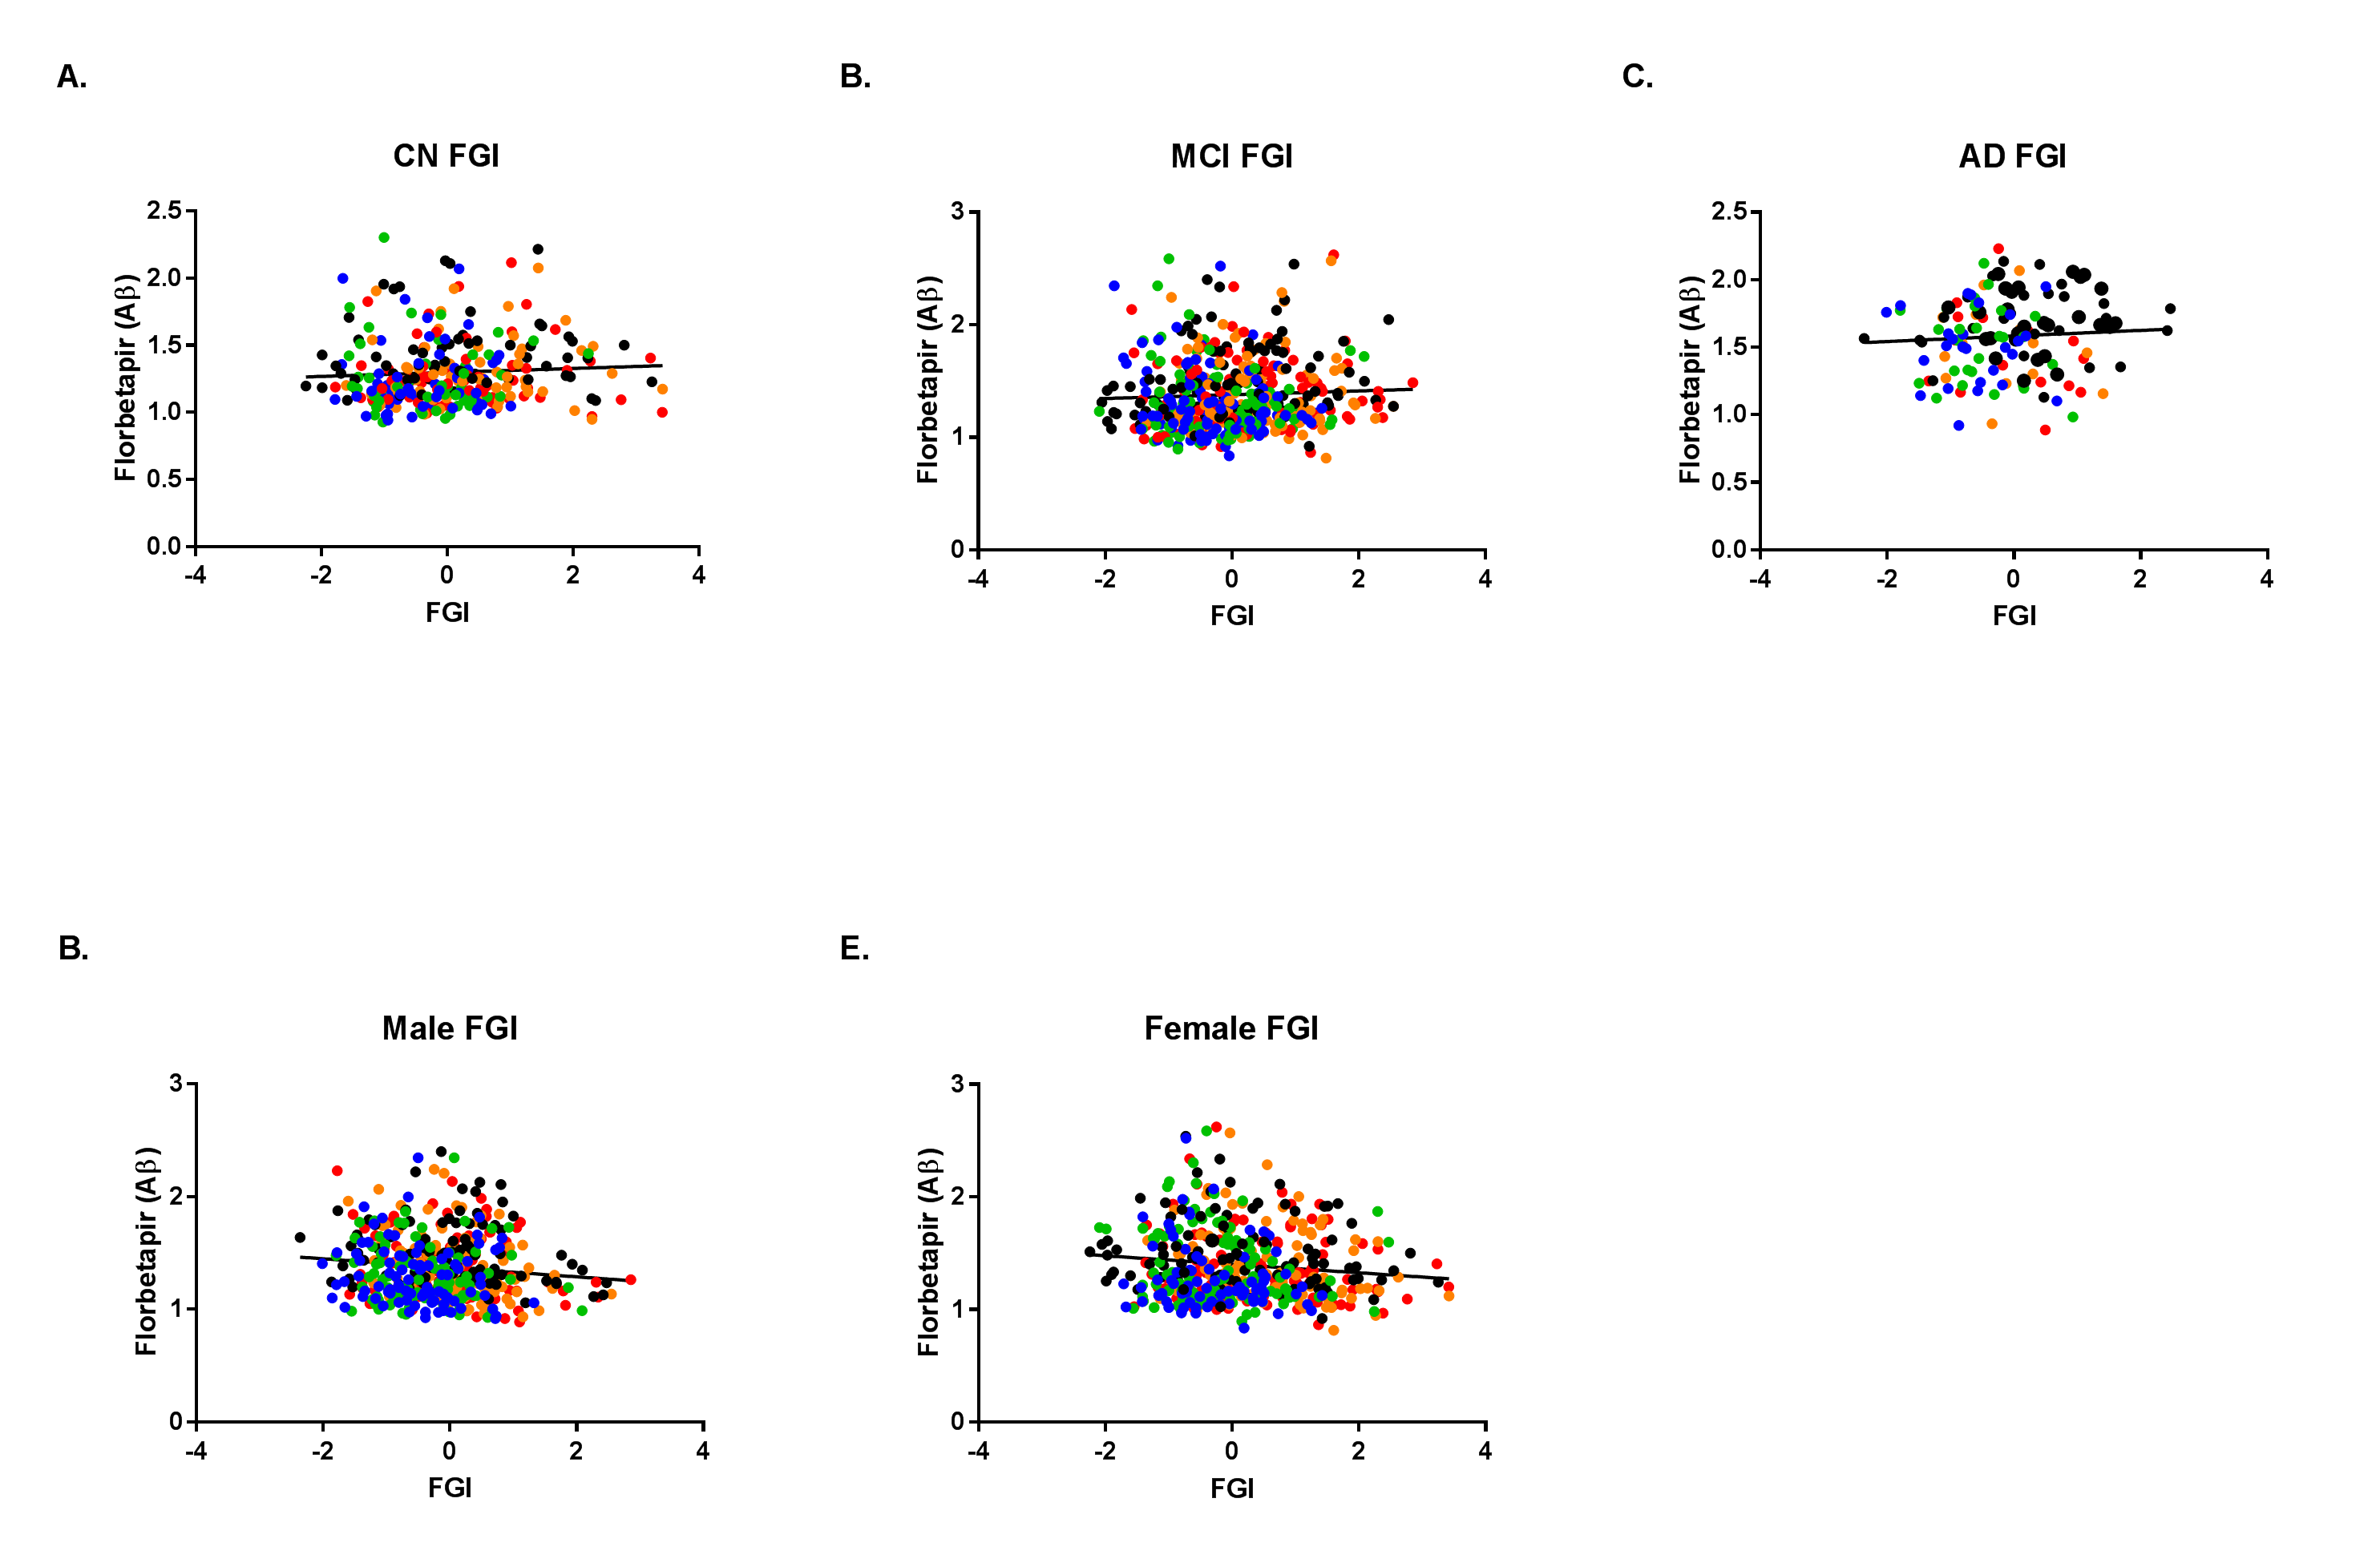
Figure 2. FGI is significantly correlated with florbetapir in gender-matched groups.
Once separated by cognitive status (CN, MCI, AD), FGI and florbetapir are positively correlated across all three groups (A.-C.). However, gender-matched groups exhibit significantly negative correlations (D. and E.). CN: Cognitively normal; MCI: Mild cognitive impairment; AD: Alzheimer’s disease; FGI: Flow glycolytic index; Aβ: Amyloid-beta.

Figure 3. Cognitive status can be classified with multimodal imaging data.
Nearest neighbor algorithm and multilayer perceptron neural networks (MLP) were able to distinguish between cognitive status (CN, MCI, AD) based on PET and MRI. The predictor space (A.) shows the relationship between gender, left angular glucose uptake, and right angular glucose uptake. A four-layer neural network was able to achieve 71.0% accuracy in identifying MCI, 37.5% for CN, and 45.5% for AD, with receiver operating characteristics of 0.722, 0.772, and 0.897, respectively (B.). Normalized importance of each feature was then calculated and plotted (C.), with the highest features originating in FDG, FGI, and CBF.