2003
Unbalanced large-scale brain networks during static and dynamic states in Alzheimer’s Disease1Center for Biomedical Imaging Research, Tsinghua University, Beijing, China, 2Institute of Affective and Social Neuroscience, Shenzhen University, Shenzhen, China, 3Neuroimaging Center,University Medical Center Groningen, University of Groningen, Groningen, Netherlands, 4Department of Radiology, Washington Univesity, Seattle, WA, United States
Synopsis
In this study, we applied Independent Component Analysis (ICA) and dynamic network approaches to explore the neural network mechanisms between Alzheimer’s disease (AD) patients and normal aging healthy controls (HC) from distinct brain states. We conducted rs-fMRI scanning on 12 ADs and 12 HCs. From ICA, we got three networks including DAN, VAN and DMN. From dynamic network analysis, we achieved three dynamic states. Two sample t-test results showed that, in AD, DAN had weaker connectivity, DMN had no difference both in static and dynamic states, VAN only had increased connectivity between IFG and other regions in static state.
Introduction
Alzheimer’s Disease (AD) is a progressive neurodegeneration disorder characterized by dysfunction of core large-scale brain networks including dorsal attention network (DAN), ventral attention network (VAN) and default mode network (DMN) underlying cognitive function declining1. Among them, DAN is involved in top-down attention selection2; VAN is specialized for the detection of behavioral relevant salient stimuli2; DMN is related with self-related processing3. AD is characterized by disrupted executive functions. However, few studies have examined these functions related brain networks in AD, especially both during static and dynamic brain states. Here we tried to combine static and dynamic network analysis to characterize the differences of brain networks between AD and HC.Methods
Participants: 12 AD patients (5 female, 69.23±10.79 years old) and 12 health controls (5 female, 71.58±7.23 years old) were recruited.
MRI Acquisition: All subjects were performed with echo planner imaging (EPI) and T1-weighted 3D gradient-recalled sequence on a Philips 3-T Achieva scanner.
Data Preprocessing: Imaging preprocessing was performed using DPARSF (http://www.restfmri.net), with discarding the first 10 volumes for signal stabilization, slice-timing, realignment, normalizing to a standard template (MNI) with a resolution of 3 × 3 × 3 mm3, smoothing with an isotropic Gaussian kernel (FWHM=6mm), linear detrend and filtering (0.01-0.08Hz).
Independent Component analysis (ICA): Spatial ICA was conducted for all 24 participants using the Informix algorithm in GIFT (http://icatb.sourceforge.net/). The data of each subject was decomposed into 20 spatial separated independent components (ICs). After ICA separation, we did t-test for three components including DAN, VAN and DMN between AD and HC.
Dynamic network analysis: Large-scale networks were identified based on an atlas of 264 brain nodes. These nodes widely distributed across the brain and encompassed DAN, VAN, DMN and several other networks.Dynamic functional connectivity (FC) was computed using sliding window (window size = 22 TR, step = 1 TR). Then K-Means was used to partition these FC windows into 3 separate clusters to maximize the correlation within a cluster to the cluster centroid4. For each state, the intra-network FCs of DAN, VAN and DMN were calculated by averaging FCs in each network. Finally, two sample t-test was used to compared the intra-network FCs of three networks during each state between AD and HC.
Results
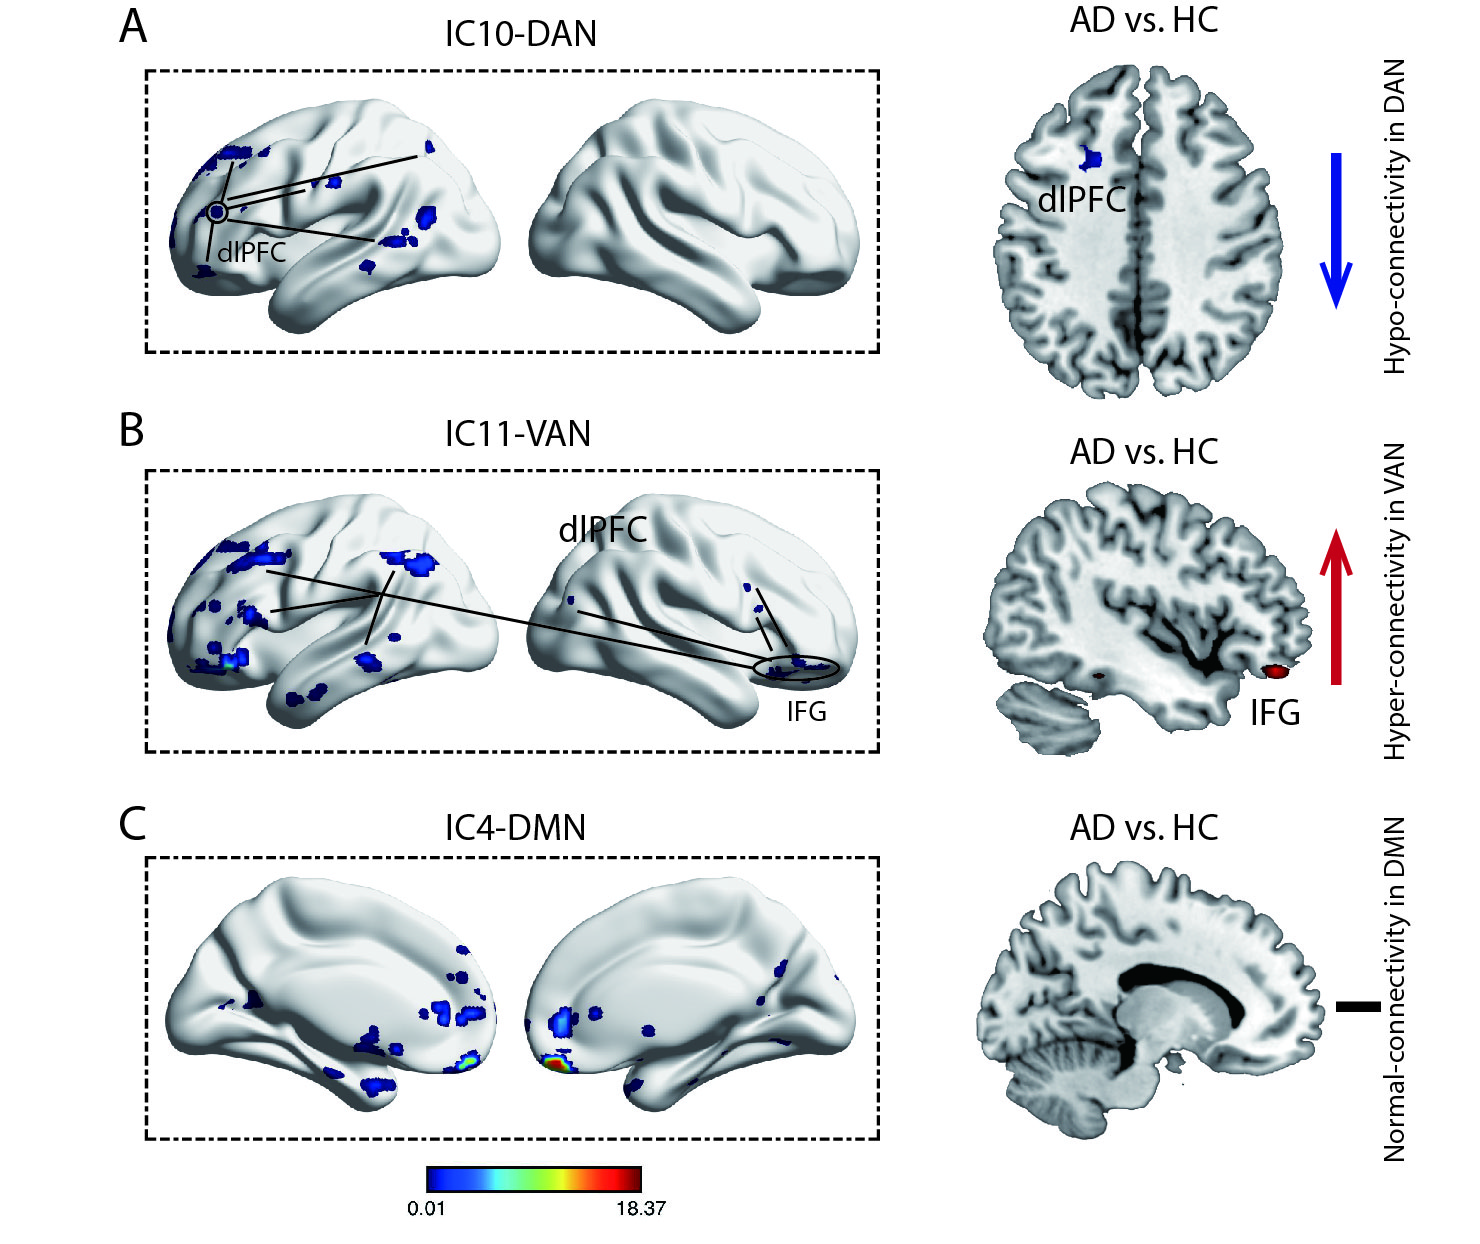
Independent Component Analysis (ICA) in static resting state
One sample t-test revealed the respective spatial pattern of DAN, VAN and DMN (p < 0.05 with FWE correction) (Figure 1, left side). Two sample t-test displayed significant differences of DAN and VAN components between AD and HC (p < 0.05 with FWE correction). That is, compared with HC, AD showed that the dorsal lateral prefrontal cortex (dlPFC) decreased the connectivity in DAN and the inferior frontal gyrus (IFG) increased the connectivity in VAN. However, there was no significant difference in DMN (Figure 1, right side).
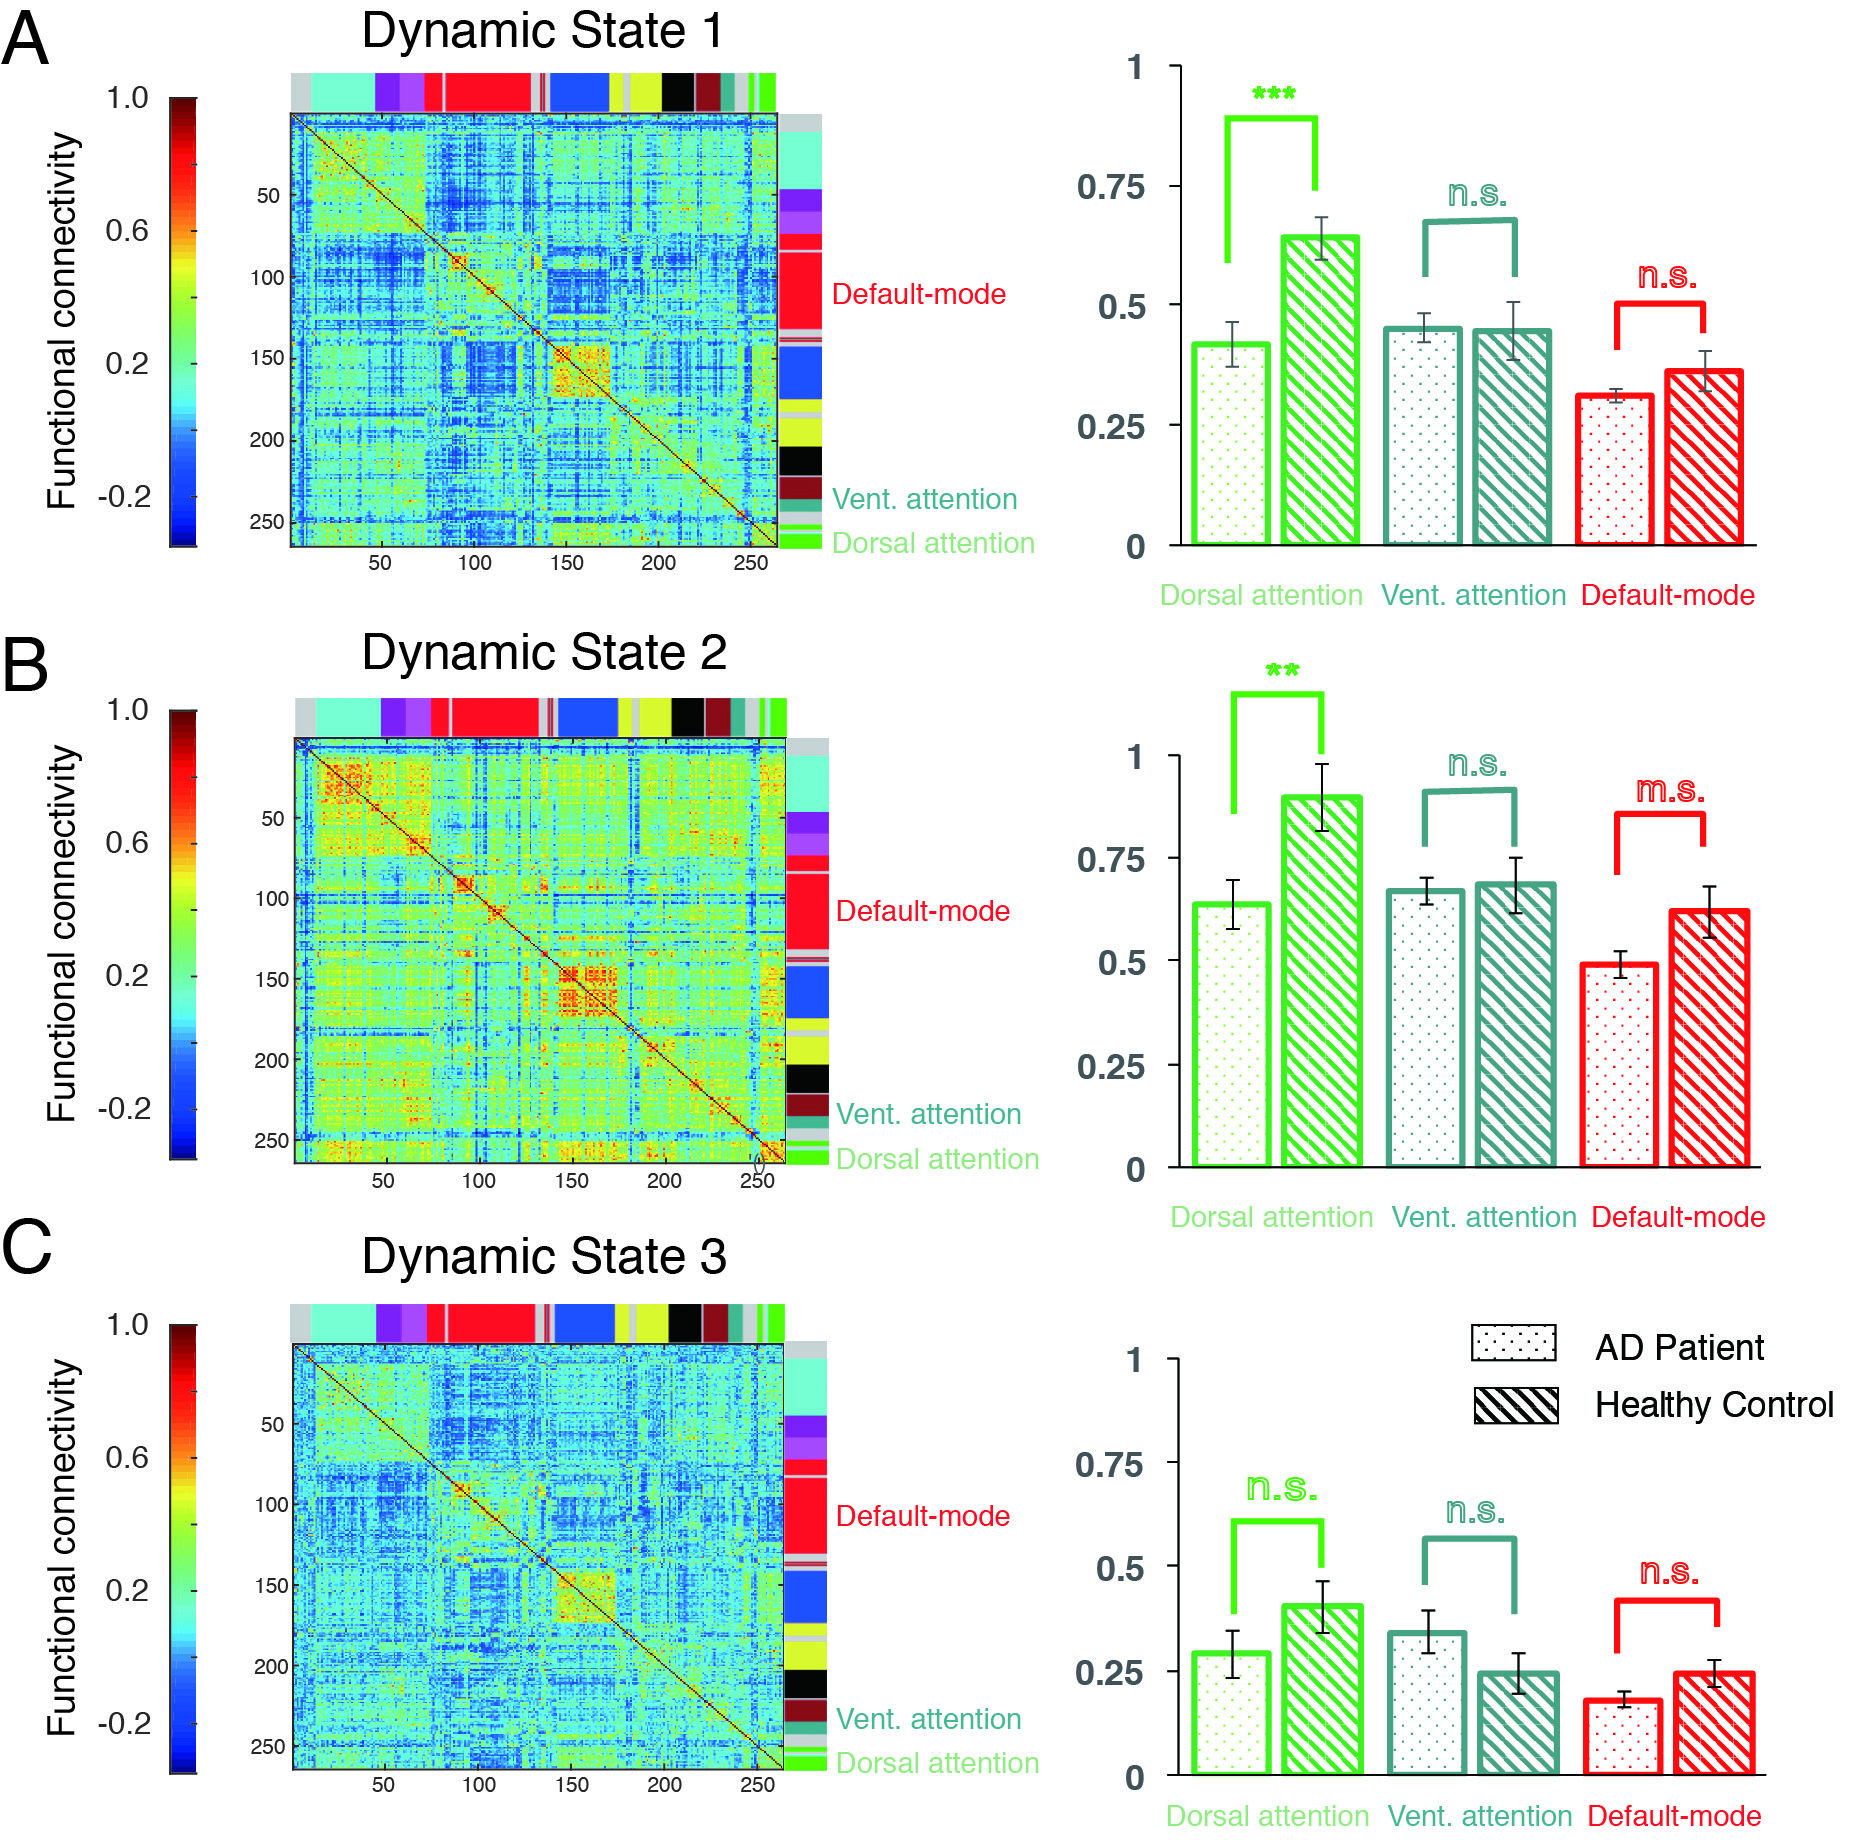
Brain Networks in dynamic resting states
The dynamic brain network analysis displayed several similar and distinct patterns from static state. Similarly, AD had significant weaker connectivity in DAN than HC both in dynamic state 1 and 2 (all p < 0.01, Figure 2A, B). However, the difference of connectivity in DAN disappeared in dynamic state 3 (p = 0.20, Figure 2C). Moreover, VAN and DMN had no significant differences between two groups in all three states.
Discussion
This study compared AD and HC to investigate the difference of core large-scale brain networks including DAN, VAN and DMN in static and dynamic resting state. The static network analysis showed that AD had a decreased dlPFC connectivity in DAN. Similarly, the dynamic network analysis showed the decreased connectivity within DAN in two different dynamic states. DAN is the central brain circuit for executive functions in human, within which connectivity allows transmit of goal-directed signals for selection of stimuli and responses. Our findings suggested that disrupted communication within DAN in AD robustly appeared in both continuously static state and transiently dynamic states, which may underline the declined high-level cognition in AD. However, AD only showed increased IFG connectivity in VAN but no changes during all dynamic states. The VAN was related with the detection of salient stimuli. Hyper-connectivity of IFG in VAN may be linked to abnormal bottom-up attention in AD in a continuously static manner. Finally, we did not found altered connectivity in DMN during both static and dynamic states, which may suggest normal self-related processing in AD. Taken together, our study provides new evidences for understanding dysfunction of large-scale networks in AD from static and dynamic brain states, and supplies network bio-markers for diagnose and treatment for AD.Acknowledgements
We thank the support from center for biomedical imaging research in Tsinghua University. The authors declare no competing financial interests in relation to the work presented.
References
[1] Blennow, K., de Leon, M. J., & Zetterberg, H. (2006). Alzheimer’s disease. Lancet (London, England), 368(9533), 387–403.
[2] Corbetta, M., & Shulman, G. L. (2002). CONTROL OF GOAL-DIRECTED AND STIMULUS-DRIVEN ATTENTION IN THE BRAIN. Nature Reviews Neuroscience, 3(3), 215–229.
[3] Raichle, M. E., MacLeod, A. M., Snyder, A. Z., Powers, W. J., Gusnard, D. A., & Shulman, G. L. (2001). A default mode of brain function. Proceedings of the National Academy of Sciences, 98(2), 676–682.
[4] Allen, E. A., Damaraju, E., Plis, S. M., Erhardt, E. B., Eichele, T., & Calhoun, V. D. (2014). Tracking Whole-Brain Connectivity Dynamics in the Resting State. Cerebral Cortex, 24(3), 663–676.
Figures