2002
A combined dual-tracer PET/diffusion tractometry analysis of the posterior cingulum in a mild cognitive impairment ketogenic intervention1Université de Sherbrooke, Sherbrooke, QC, Canada, 2Imeka Solutions Inc., Sherbrooke, QC, Canada
Synopsis
In mild cognitive impairment (MCI), posterior cingulate cortex glucose hypometabolism may results from posterior cingulum (PCg) alterations. We suggest that raising ketone availability to the brain may overcome the brain energy deficit. We developed a dual-tracer PET/dMRI tractometry method to assess whether a ketogenic supplement has impact on fuel uptake in the PCg of MCI participants. Mean fuel uptake in the PCg was unchanged post-supplementation, but tract-profiling enabled the identification of sections with lower glucose uptake. Energy supply in white matter fascicles is crucial to sustain adequate axonal function and may be linked to the pathogenesis of MCI.
Introduction
Lower fractional anisotropy in the white matter (WM) cingulum fasciculus is consistently reported in diffusion (dMRI) studies of mild cognitive impairment (MCI)1,2. Furthermore, the posterior cingulate cortex (PCC) is the first region to present glucose hypometabolism in MCI3,4. It was proposed that PCC glucose hypometabolism results from hippocampal atrophy through posterior cingulum (PCg) dysfunction and atrophy2,5-7. On the other hand, we previously showed that brain ketone uptake, the main alternative brain fuel to glucose, is normal in MCI5. Thus, we suggest that a supplement raising ketone availability to the brain may overcome the brain energy deficit by supplying an alternative fuel to brain cells8,9. The assessment of WM fuel uptake may enable the evaluation of WM metabolic integrity. We therefore developed a new combined dual-tracer PET/dMRI tractometry method to assess whether a ketogenic supplement impacts fuel uptake and dMRI properties of the PCg in MCI participants.Methods
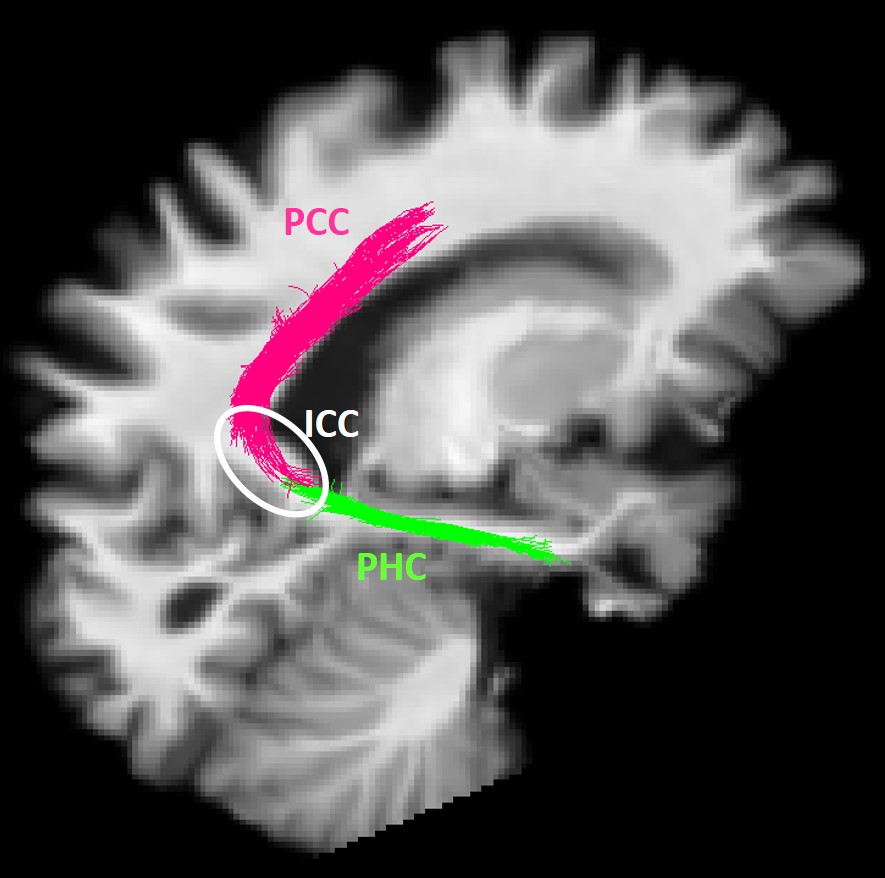
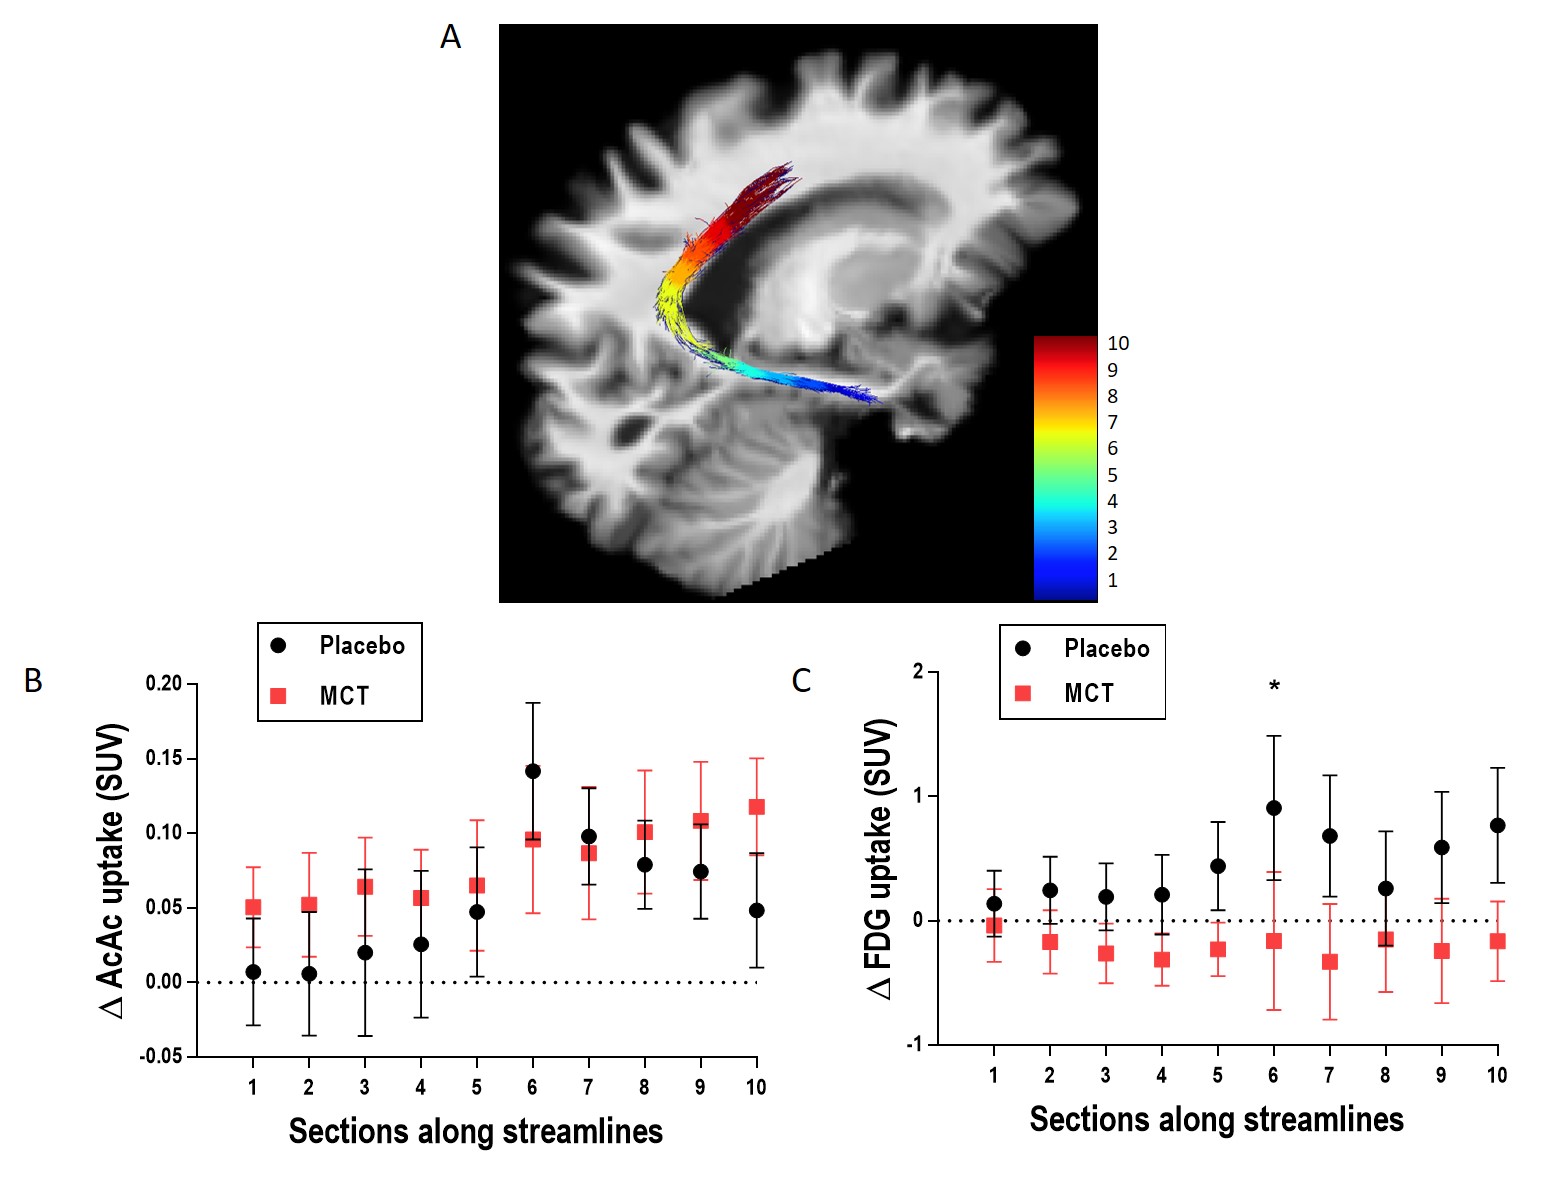
MCI participants were randomized to the placebo (N=11) or medium chain triglyceride (MCT; N=12) groups. Participants underwent multi-modal brain imaging before and after a 6-month daily supplement of 30 g/day MCT. The protocol consisted of a 3T MRI session on a Philips Ingenia system: a 1 mm T1 image, followed by a 1.8 mm isotropic high angular resolution diffusion imaging (HARDI; 60 directions, b=1500 s/mm2), and a blip-up/blip-down b=0 s/mm2 acquisition to correct for distortions. Diffusion tensor measures10, free-water index11, total apparent fiber density12 and number of fiber orientations13 were computed. Anatomically-constrained probabilistic particle filter tractography that is robust to crossing fibers and partial volume effect was used to reconstruct the PCg14. Streamlines connecting the parahippocampal cortex (PHC) to the isthmus cingulate cortex (ICC) and the ICC to the PCC15 were automatically extracted using the Desikan/Killiany FreeSurfer atlas and WM query language (Fig. 1)16. The MRI protocol was followed by a dual PET tracer session: AcAc (11C-acetoacetate) first, followed by FDG (18F-Fluorodeoxyglucose)4. SUV (standardized uptake values) summed-images from dynamic acquisitions were used. PET images were co-registered to dMRI data. Average PET tracer uptake and tract-profiling along 10 sections of the PCg (Fig. 3A)17 were measured. Data are expressed as delta (post- minus pre-supplementation).Results
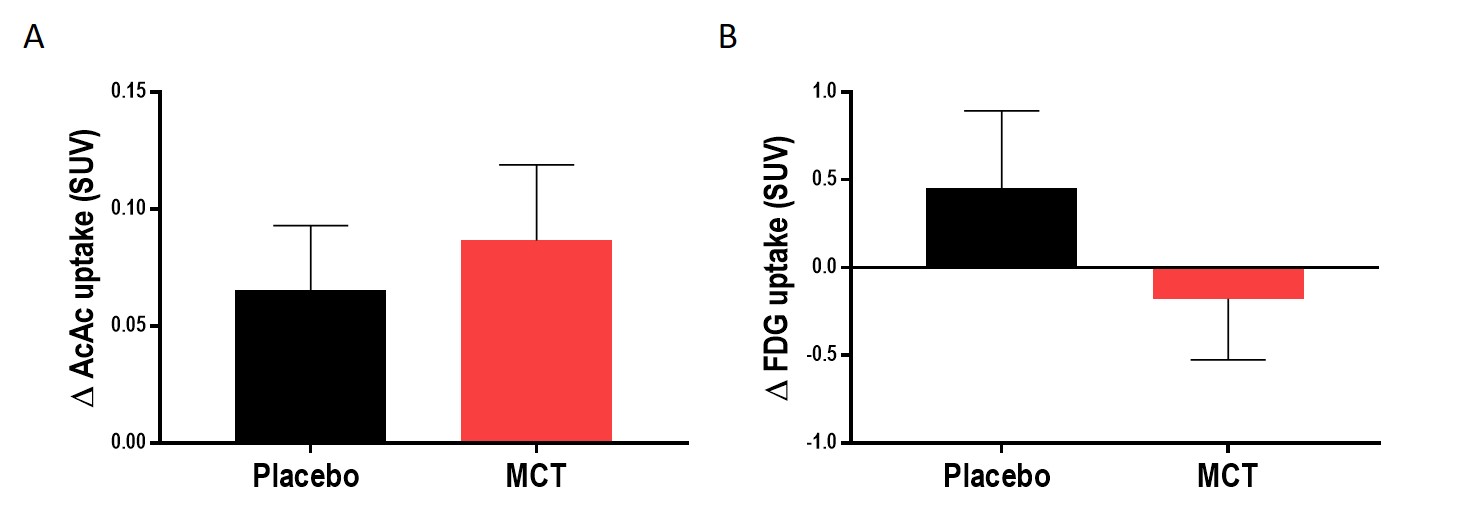
Pre-supplementation, the placebo and MCT groups did not differ in age (75 ± 6 years) or Mini-Mental State Examination score (28/30 ± 2). Mean Δdiffusion tensor measures, mean Δfree-water index, fascicle Δvolume and streamline Δmean length in the PCg were not statistically different between the groups. Mean ΔAcAc and ΔFDG uptake in the PCg did not differ statistically between groups. Using tract-profiling, ΔAcAc uptake was slightly higher in several sections along the streamlines in the MCT group, but with the current number of participants, no statistical difference was found (Fig. 3B). ΔFDG uptake (Fig. 3C) was globally lower for the MCT group in the 10 sections of the PCg with a statistical difference in section 6 (p= 0.04; medial part of the ICC) and a trend in sections 7 and 10 (p= 0.06 and 0.08 respectively).Discussion
The cingulum fasciculus consists of multiple sub-connections18. We therefore extracted the ones which are crucial for episodic memory and have implications in MCI (PHC-ICC)19 and applied a multi-modal PET/dMRI tractometry pipeline to quantify their integrity. As expected, no structural changes, revealed by dMRI measures, were noted in the placebo group after the 6-month period, which confirmed the test-retest reliability of our method. Tract-profiling showed differences in FDG uptake between the two groups, which were not found when only the average FDG uptake in the PCg was compared. FDG uptake near the streamline’s terminations (close to grey matter), seemed more affected by the MCT supplementation compared to the inner sections of the streamlines. Lower FDG uptake in these cortical areas was also reported after a ketogenic intervention in healthy adults9. To our knowledge, this is the first report of FDG uptake in any WM fascicles in humans. The assessment of WM FDG uptake using PET enables the evaluation of WM energy metabolism in vivo20. WM energy supply (axonal and oligodendrocytes), which serves mainly for resting potentials, myelin synthesis and intracellular trafficking of molecules21, is crucial to sustain adequate axonal function22 and may be linked to the pathogenesis of MCI.Conclusion
A 6-month ketogenic MCT supplementation changes FDG uptake in the PCg in MCI and tract-profiling is useful to identify these changes. These results will be extended to more participants and combined with grey matter analysis to further evaluate the role of WM connections in cognitive impairment. Our dual-tracer PET/dMRI tractometry approach to evaluate energy use in WM fascicles could be helpful to better understand changes occurring in neurological disorders.Acknowledgements
The authors wish to thank Sébastien Tremblay, Christine Brodeur-Dubreuil, Éric Lavallée, and the clinical MRI and PET group (CIMS) for their technical assistance. This work was supported by CIHR (MOP-102648), CFI (201796), FRQS and the Université de Sherbrooke (University Research Chair to SCC).References
1. Stebbins, G. T. & Murphy, C. M. Diffusion tensor imaging in Alzheimer's disease and mild cognitive impairment. Behav Neurol 21, 39-49, doi:10.3233/BEN-2009-0234 (2009).
2. Bozoki, A. C., Korolev, I. O., Davis, N. C., Hoisington, L. A. & Berger, K. L. Disruption of limbic white matter pathways in mild cognitive impairment and Alzheimer's disease: a DTI/FDG-PET study. Hum Brain Mapp 33, 1792-1802, doi:10.1002/hbm.21320 (2012).
3. Chetelat, G. et al. Dissociating atrophy and hypometabolism impact on episodic memory in mild cognitive impairment. Brain 126, 1955-1967, doi:10.1093/brain/awg196 (2003).
4. Croteau, E. et al. A cross-sectional comparison of brain glucose and ketone metabolism in cognitively healthy older adults, mild cognitive impairment and early Alzheimer's disease. Exp Gerontol, doi:10.1016/j.exger.2017.07.004 (2017).
5. Villain, N. et al. Relationships between hippocampal atrophy, white matter disruption, and gray matter hypometabolism in Alzheimer's disease. J Neurosci 28, 6174-6181, doi:10.1523/JNEUROSCI.1392-08.2008 (2008).
6. Fischer, F. U., Wolf, D. & Andreas Fellgiebel for the Alzheimer's Disease Neuroimaging, I. Diaschisis-Like Association of Hippocampal Atrophy and Posterior Cingulate Cortex Hypometabolism in Cognitively Normal Elderly Depends on Impaired Integrity of Parahippocampal Cingulum Fibers. J Alzheimers Dis, doi:10.3233/JAD-170147 (2017).
7. Villain, N. et al. Sequential relationships between grey matter and white matter atrophy and brain metabolic abnormalities in early Alzheimer's disease. Brain 133, 3301-3314, doi:10.1093/brain/awq203 (2010).
8. Cunnane, S. C. et al. Can Ketones Help Rescue Brain Fuel Supply in Later Life? Implications for Cognitive Health during Aging and the Treatment of Alzheimer's Disease. Front Mol Neurosci 9, 53, doi:10.3389/fnmol.2016.00053 (2016).
9. Courchesne-Loyer, A. et al. Inverse relationship between brain glucose and ketone metabolism in adults during short-term moderate dietary ketosis: A dual tracer quantitative positron emission tomography study. J Cereb Blood Flow Metab 37, 2485-2493, doi:10.1177/0271678X16669366 (2017).
10. Basser, P. J. & Pierpaoli, C. Microstructural and physiological features of tissues elucidated by quantitative-diffusion-tensor MRI. J Magn Reson B 111, 209-219 (1996).
11. Pasternak, O., Sochen, N., Gur, Y., Intrator, N. & Assaf, Y. Free water elimination and mapping from diffusion MRI. Magn Reson Med 62, 717-730, doi:10.1002/mrm.22055 (2009).
12. Raffelt, D. et al. Apparent Fibre Density: a novel measure for the analysis of diffusion-weighted magnetic resonance images. Neuroimage 59, 3976-3994, doi:10.1016/j.neuroimage.2011.10.045 (2012).
13. Dell'Acqua, F., Simmons, A., Williams, S. C. & Catani, M. Can spherical deconvolution provide more information than fiber orientations? Hindrance modulated orientational anisotropy, a true-tract specific index to characterize white matter diffusion. Hum Brain Mapp 34, 2464-2483, doi:10.1002/hbm.22080 (2013).
14. Girard, G., Whittingstall, K., Deriche, R. & Descoteaux, M. Towards quantitative connectivity analysis: reducing tractography biases. Neuroimage 98, 266-278, doi:10.1016/j.neuroimage.2014.04.074 (2014).
15. Catani, M., Dell'acqua, F. & Thiebaut de Schotten, M. A revised limbic system model for memory, emotion and behaviour. Neurosci Biobehav Rev 37, 1724-1737, doi:10.1016/j.neubiorev.2013.07.001 (2013).
16. Wassermann, D. et al. The white matter query language: a novel approach for describing human white matter anatomy. Brain Struct Funct 221, 4705-4721, doi:10.1007/s00429-015-1179-4 (2016).
17. Cousineau, M. et al. A test-retest study on Parkinson's PPMI dataset yields statistically significant white matter fascicles. Neuroimage Clin 16, 222-233, doi:10.1016/j.nicl.2017.07.020 (2017).
18. Whitford, T. J. et al. Localized abnormalities in the cingulum bundle in patients with schizophrenia: a Diffusion Tensor tractography study. Neuroimage Clin 5, 93-99, doi:10.1016/j.nicl.2014.06.003 (2014).
19. Ranganath, C. & Ritchey, M. Two cortical systems for memory-guided behaviour. Nat Rev Neurosci 13, 713-726, doi:10.1038/nrn3338 (2012).
20. Kalheim, L. F. et al. Amyloid Dysmetabolism Relates to Reduced Glucose Uptake in White Matter Hyperintensities. Front Neurol 7, 209, doi:10.3389/fneur.2016.00209 (2016).
21. Harris, J. J. & Attwell, D. The energetics of CNS white matter. J Neurosci 32, 356-371, doi:10.1523/JNEUROSCI.3430-11.2012 (2012).
22. Wender, R. et al. Astrocytic glycogen influences
axon function and survival during glucose deprivation in central white matter. J Neurosci 20, 6804-6810 (2000).
Figures