2001
Changes in hippocampal and whole brain stiffness in 14-month old female mice with Alzheimer’s disease1Department of Radiology, Brigham and Women`s Hospital, Harvard Medical School, Boston, MA, United States, 2Institute of Neuroradiology, University Medical Center Goettingen, Goettingen, Germany, 3Department of Biomedical Engineering, Boston University, Boston, MA, United States, 4Ann Romney Center for Neurologic Diseases, Brigham and Women’s Hospital, Harvard Medical School, Boston, MA, United States, 5Department of Radiological Imaging, Imaging Sciences & Biomedical Engineering Division, King's College London, London, United Kingdom
Synopsis
Alzheimer’s disease (AD) has been associated with human brain softening, but the underlying biomechanical mechanism is not fully elucidated. We used magnetic resonance elastography to investigate the effect of amyloid-beta accumulation on hippocampal and whole brain (WB) stiffness in transgenic AD and wild-type (WT) mice at 11 and 14 months of age. The only differences observed between AD and WT mice were that the longitudinal change in the loss modulus between 11 and 14 months for female AD mice was significantly different than that of either the WT or male AD mice.
Introduction
Histopathological findings in Alzheimer’s disease (AD) include extracellular amyloid-beta (Ab) neuritic plaques, intracellular neurofibrillary tangles, amyloid microangiopathy, dystrophic cortical neurites, microglial activation, and neuronal loss [1]. Previous studies have shown that AD is associated with softening of the human brain [2, 3]. However, the underlying biomechanical mechanism has not been fully elucidated. This study aimed to investigate the effect of Ab plaque accumulation on mouse hippocampal and whole brain stiffness measured using magnetic resonance elastography (MRE).Methods
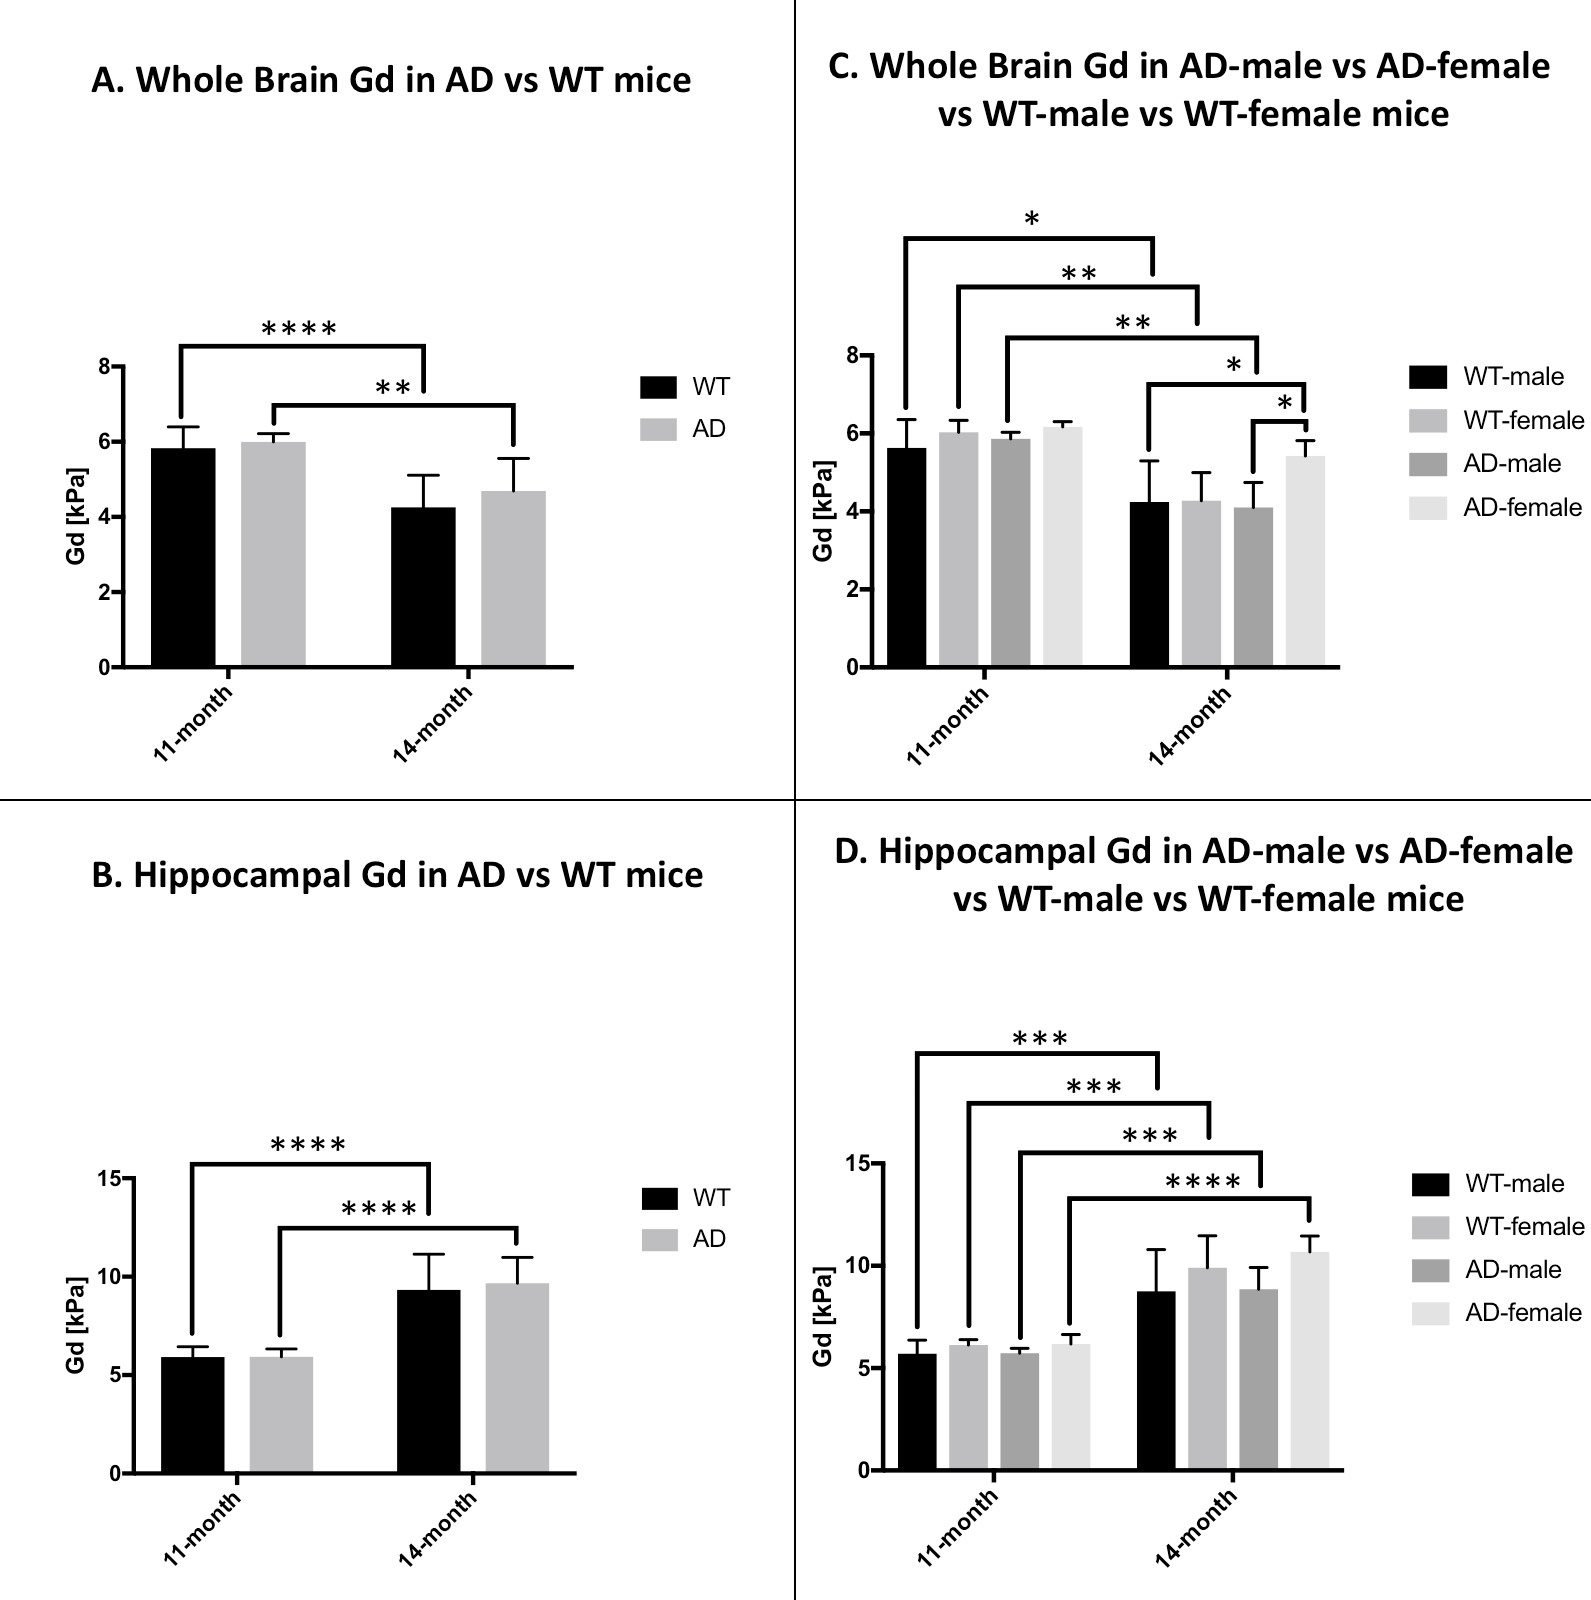
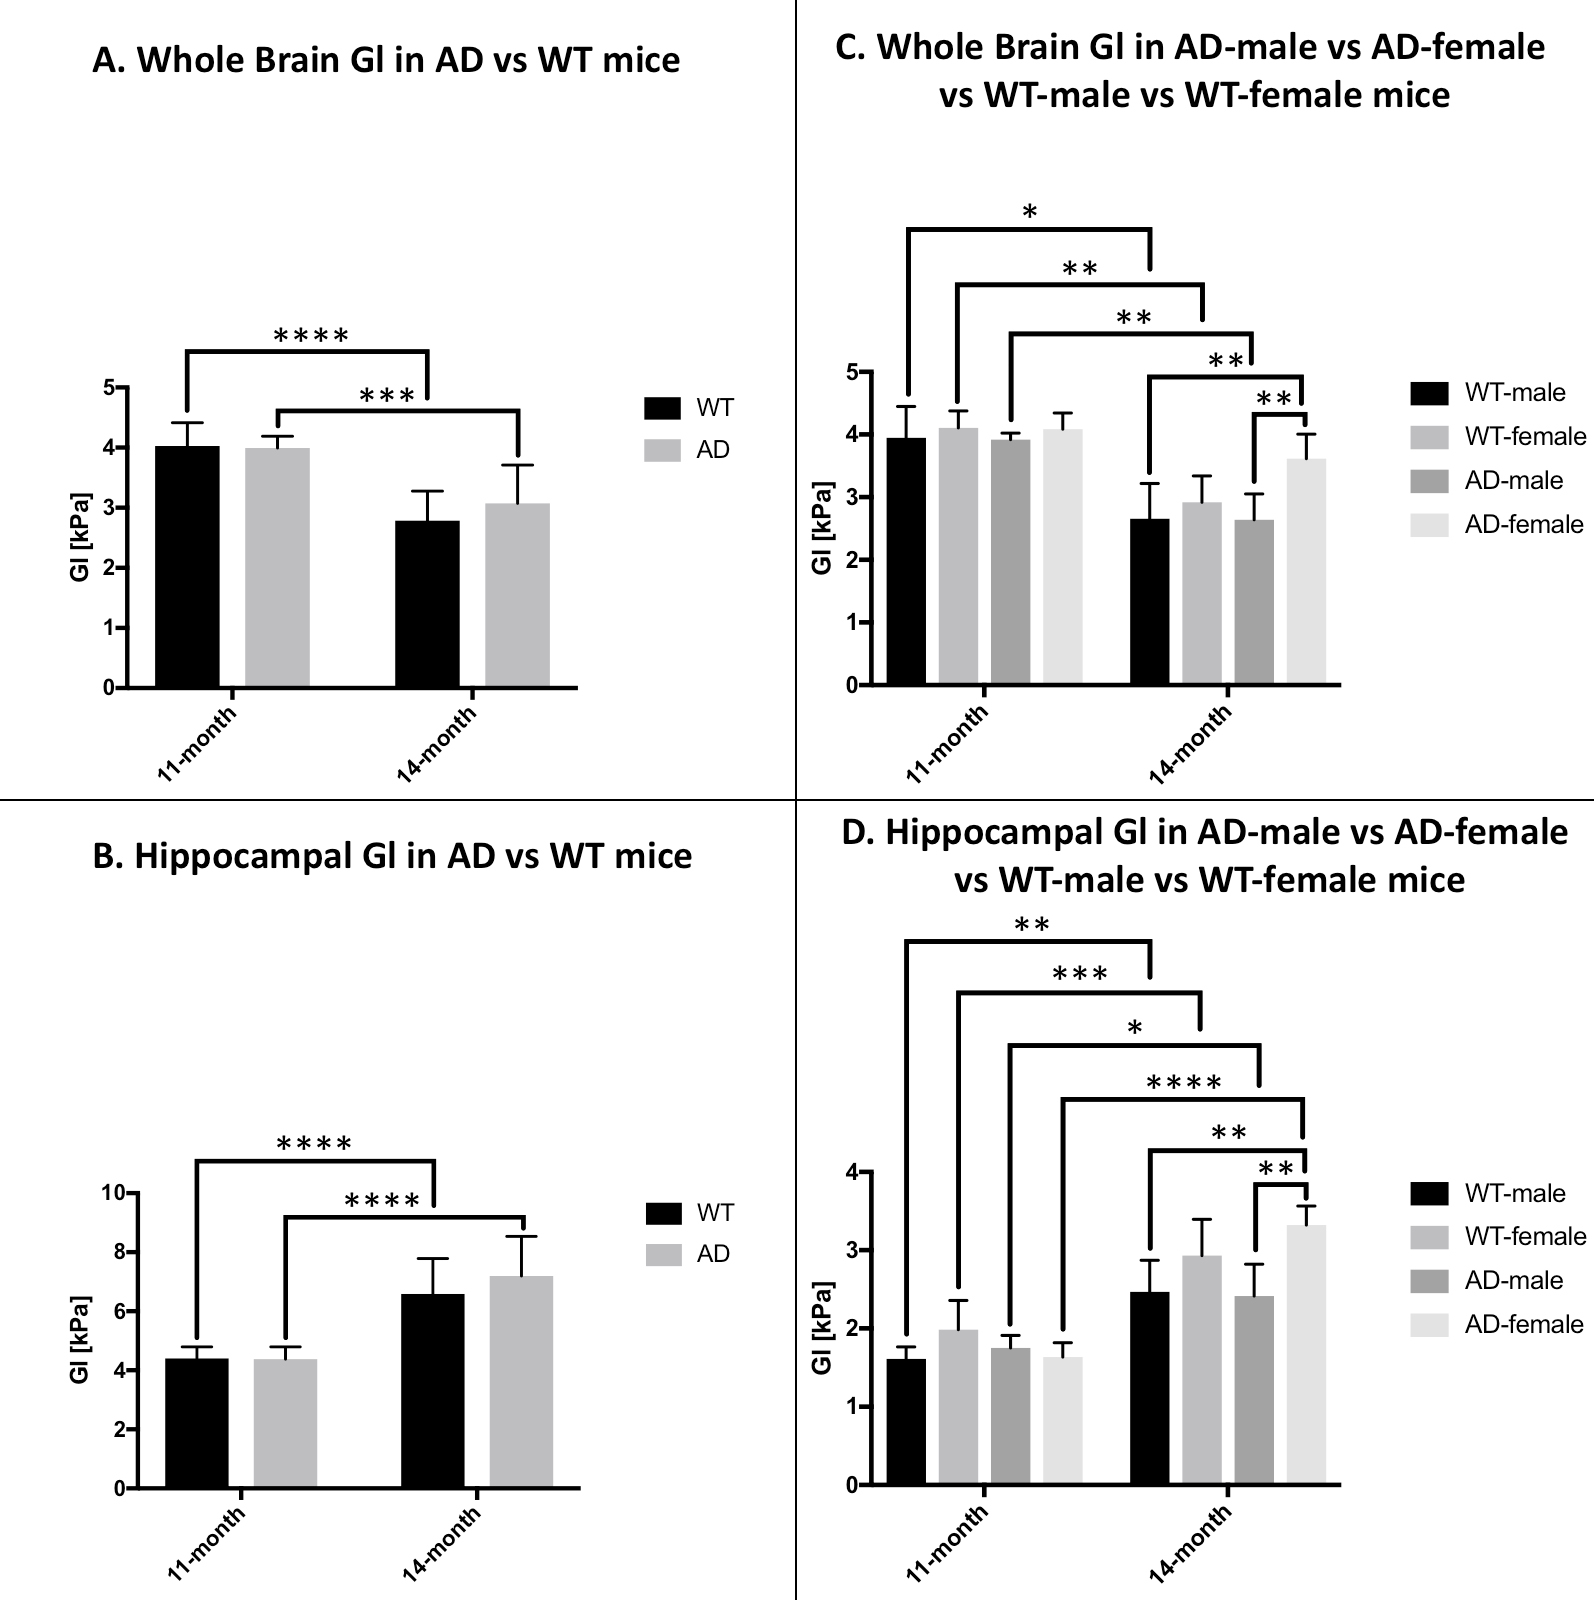
Cerebral biomechanical properties were assessed in 9 amyloidogenic transgenic (J20) [4] AD mice (5 males/4 females) and 10 wild-type (WT) C57BL/6 mice (5 males/5 females) at 11 and 14 months of age. T2-weighted MRI and 3D MRE images were acquired using a Bruker 7T small animal scanner. The bilateral hippocampi and the whole brain parenchyma (WB) (including the hippocampi) were manually segmented on T2-weighted MRI and MRE magnitude images, respectively. The hippocampal segmentations were then overlaid onto the elastograms. The following MRE parameters were calculated for each region of interest (ROI): viscoelastic modulus |G*|, elasticity (Gd), and viscosity (Gl) (). The right and left hippocampal MRE parameters were averaged. A two-way repeated measures ANOVA with Sidak’s post-hoc test was used to perform (1) a cross-sectional comparison of the MRE parameters at the 11- and 14-month time-points in AD versus WT mice, as well as (2) a longitudinal investigation of the MRE parameters between the two time-points in AD and WT mice separately. To investigate gender-specific differences, we repeated the above-mentioned analyses in the following 4 subgroups: AD males, AD females, WT males, and WT females. The threshold for statistical significance was set to p<0.05.Results
Cross-sectional analyses showed no difference between AD and WT mice at the 11- and 14-month time-points. At the 11-month time-point, there were no gender-specific differences between AD and WT mice. At the 14-month time-point, however, AD females showed significantly higher hippocampal G* and Gl as well as significantly higher WB G*, Gd, and Gl compared to both AD and WT males.
Longitudinal analyses showed significant increases in hippocampal G*, Gd, and Gl, as well as significant decreases in WB G*, Gd, and Gl between 11 and 14 months of age in both AD and WT mice. Each subgroup showed significant increases in hippocampal G*, Gd, and Gl, as well as significant decreases in WB G*, Gd, and Gl, with the exception of AD females, which showed no significant changes in WB G*, Gd, or Gl.
Discussion
Our most salient
findings are that AD females showed higher hippocampal and WB viscosity and higher
WB elasticity at 14 months of age compared to AD and WT males, while
differences with WT females were not statistically significant, but trended in
the same direction. Additionally, between 11 and 14 months of age, AD females showed
a significantly more pronounced increase in hippocampal (but not whole-brain)
elasticity and viscosity compared to AD males and WT mice. AD males showed no
significant differences compared to WT animals. Other studies found decreased
elasticity and increased viscosity in the hippocampus in earlier disease stages
(3-6 months) using AD mouse models in which, similar to the model used in our
study, amyloid plaque deposition begins around 6 months of age [5, 6]. A separate study has
found decreased shear stiffness in the WB in a later disease stage (~20 months)
using an AD mouse model in which amyloid plaque deposition begins around 6
weeks of age [7].Conclusion
The only differences observed between AD and WT mice were that the longitudinal change in the loss modulus between 11 and 14 months for female AD mice was significantly different than that of either the WT or male AD mice. Our study is of relevance for future studies investigating the diagnostic value of MRE in ADAcknowledgements
This study was supported by a grant from the National Institute of Health (NIH R21 EB030757).References
1. Selkoe, D.J., Alzheimer's disease: genes, proteins, and therapy. Physiol Rev, 2001. 81(2): p. 741-66.
2. Murphy, M.C., et al., Regional brain stiffness changes across the Alzheimer's disease spectrum. Neuroimage Clin, 2016. 10: p. 283-90.
3. Murphy, M.C., et al., Decreased brain stiffness in Alzheimer's disease determined by magnetic resonance elastography. J Magn Reson Imaging, 2011. 34(3): p. 494-8.
4. Mucke, L., et al., High-level neuronal expression of abeta 1-42 in wild-type human amyloid protein precursor transgenic mice: synaptotoxicity without plaque formation. J Neurosci, 2000. 20(11): p. 4050-8.
5. Munder, T., et al., MR elastography detection of early viscoelastic response of the murine hippocampus to amyloid beta accumulation and neuronal cell loss due to Alzheimer's disease. J Magn Reson Imaging, 2017.
6. Majumdar, S., et al., Early-stage analysis of murine models of Familial Alzheimer’s disease: Preliminary results. International MRE Workshop, Berlin, Germany, 2017.
7. Murphy, M.C., et al., Magnetic resonance elastography of the brain in a mouse model of Alzheimer's disease: initial results. Magn Reson Imaging, 2012. 30(4): p. 535-9.
Figures