2000
Quantification of Perfusion Asymmetries in MCI Subjects using Arterial Spin Labeling MR imaging1Harbin Institude of Technology (ShenZhen), ShenZhen, China, 2Department of Radiology, Johns Hopkins University School of Medicine, Baltimore, MD, Baltimore, MD, United States
Synopsis
In this study, we recruited seven subjects with MCI and ten subjects as cognitive normal groups. All subjects underwent PASL and T1-weighted MR imaging. Multimodal images were upload to MRICloud for segmentation and quantification of regional CBF. T-test was used to detect significant changes in brain region volumes and perfusion asymmetries in contralateral regions. We observed tendencies of atrophy in right posterior cingulate cortex and dilation in bilateral fornix, significant perfusion asymmetries were found in regions of temporal lobe, basal ganglia and posterior cingulate cortex among MCI subjects.
Introduction
Results of neuropathologic studies suggest that evidence of Alzheimer disease (AD) may be present in the brain years prior to the onset of clinical symptoms1. The diagnosis of patients at the earlier stages of the disease and the ability of objectively measuring disease progression might allow earlier intervention in the prodromal stages and to facilitate research studies into preventing AD in preclinical states1. Researches have suggested that intra-brain vascular dysregulation is an early pathological event during disease development of late-onset AD, from which biomarkers could be found for the preclinical state of AD2. Arterial spin labeling (ASL) MR imaging is a noninvasive technique permits quantification of cerebral blood flow (CBF), which can be used to detect dysfunctions of brain vascular perfusion3. Regional descreased of CBF have been observed in AD3, but the hypoperfusion of CBF in the early or preclinical stages of disease still need further study. This study was then proposed to detect perfusion asymmetric dysfunctions among mild cognitive impairment (MCI) subjects in order to explore helpful biomarkers for early diagonosis of AD.Methods
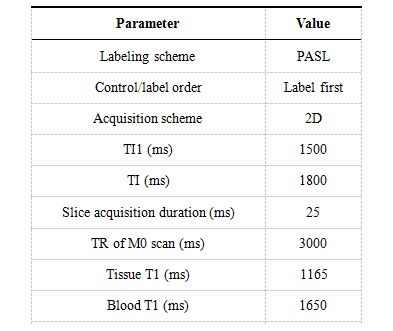
Seventeen subjects were recruited for this research with ethical approval and informed consent obtained. Seven subjects with MCI (2 men, 5 women; mean age, 63±8.5 years) and ten subjects (3 men, 7 women; mean age, 64±9.1 years) as cognitive normal groups (CN). All subjects underwent 2D QUIPSS II pulsed ASL (PASL) and T1-weighted structure MR imaging. T1 images of each subject were segmented using T1-based brain segmentation tool in MRICloud platform4. Analyze files of ASL slices were upload to ASL-MRICloud for generating of CBF images4,5, key parameters for uploading ASL datasets were listed in Table 1. A general kinetic model6 was used for quantification of relative regional CBF (rCBF) from single TI PASL data. The CBF images were registered to segmented T1 images allow the quantification of CBF in every brain regions. We then calculated the relative volumes of each brain regions after excluded voxels of CSF, skull, bone marrow and bain sulcus. Unpaired one-tail t test was used to detect volume changes of brain regions between MCI and CN groups, with p < 0.01 indicate significant differences. Z-scores of every MCI subjects were calculated for the volumes of segmented brain regions using CN group as population distribution. Absolute rCBF differences were calculated for contralateral brain regions, perfusion asymmetries in MCI compared with CN group were detected using unpaired one-tail t test with p value less than 0.01.Results
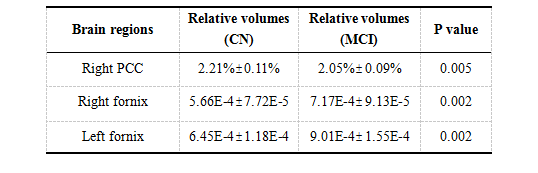
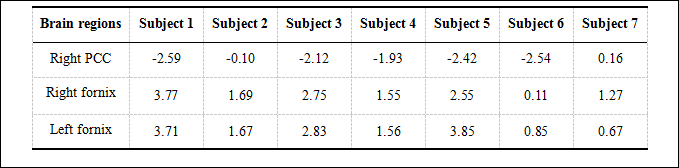
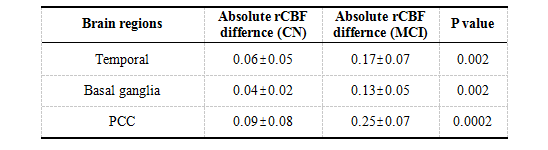
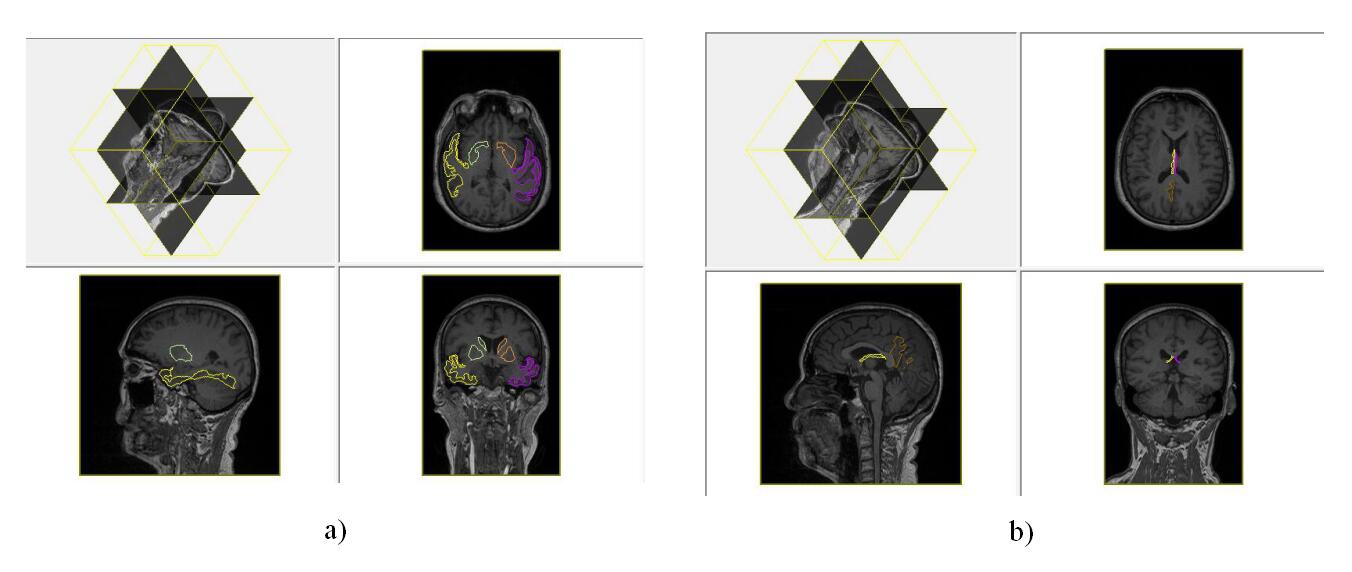
Table 2 shows brain regions with significant volumetric alterations. Brain regions of right posterior cingulate cortex (PCC) showed significant atrophy with p value equals to 0.005, bilateral fornix showed significant dilation with both p values equal to 0.002. Z-score showed uniform atrophy (z-score < 0) of right PCC among 6 MCI subjects with only one exception, meanwhile, all MCI subjects had positive z-score indicate uniform tendency of dilation in bilateral fornix (shown in Table 3). Brain regions suffered from significant perfusion dysfunctions were shown in Table 4, significent rCBF asymmetries were observed in contralateral brain regions of: temporal lobe, basal ganglia and PCC. However, as shown in Figure 1, brain regions suffered from significant perfusion asymmetries detected by the difference of rCBF covered much more areas than volumetric alterations.Discusssion
In accordance with previous research2,7,8, our results might suggest that during the early state of neurodegeneration from MCI to dementia, a remarkable predominance and higher abnormality magnitude of vascular dysregulation can be observed over the structural alterations in brain. The atrophy of PCC was detected in AD7,8, MCI patients with significant PCC atrophy might indicate higher risk of dementia. Since the fornix acts as the major output tract of the hippocampus, the dilation might be a compensatory hypertrophy for the decreased of memorial functions associated with hippocampus. Hypoperfusion in the PCC and precuneus seems to be the most consistent finding through different stages of the disease in different reseaches9. Our results also showed PCC as regions with significant perfusion asymmetry. Temporal and basal ganglia suffered significant atrophy in severe AD patients1,3,8, the asymmetric perfusion in these regions might indicate metobolic dysfunctions and predict a risk of anatomical lesion.Conclusion
With the application of MR neuroimaging, in MCI group, significant perfusion asymmetries were observed in temporal lobe, basal ganglia and PCC, while significant volume changes were observed in right PCC and bilateral fornix. Perfusion dysfunctions affected much more brain regions than structure alterations among MCI subjects, which might imply perfusion dysfunctions as better biomarkers than structure alterations in the early stages of AD.Acknowledgements
This study was supported by neurology department of ShenZhen people’s hospital, and the Basic Research Foundation of Shenzhen Science and Technology Program Key Project Track (JCYJ20150403161923510), (JCYJ20160509162237418), and (JCYJ20170413110656460).References
1. B Dubois, HH Feldman, C Jacova, et al. Advancing research diagnostic criteria for Alzheimer’s disease: the IWG-2 criteria. Lancet Neurology. 2014; 13(6): 614-629.
2. Y. Iturria-Medina, R. C. Sotero, P. J. Toussaint, et al. Early role of vascular dysregulation on late-onset Alzheimer’s disease based on multifactorial data-driven analysis. Nature Communications. 2016; 7: 11934-11948.
3. NA Telischak, JA Detre, and G Zaharchuk. Arterial spin labeling MRI: clinical applications in the brain. JMRI. 2015; 41(5): 1165-1180.
4. Mori S, Wu D, Ceritoglu C, et al. MRICloud: Delivering High-Throughput MRI Neuroinformatics as Cloud-Based Software as a Service. Computing in Science & Engineering, 2016; 18(5): 21-35.
5. Li Y, Liu P, Li Y, et al. ASL-MRICloud: Towards a comprehensive online tool for ASL data analysis. International Society of Magnetic Resonance in Medicine (ISMRM) Annual Meeting. 2017; p.3808.
6. Buxton RB, Frank LR, Wong EC, Siewert B, Warach S, Edelman RR. A general kinetic model for quantitative perfusion imaging with arterial spin labeling. Magn Reson Med 1998;40:383–396.
7. Chao LL, Buckley ST, Kornak J, et al. ASL perfusion MRI predicts cognitive decline and conversion from MCI to dementia. Alzheimer Dis Assoc Disord 2010; 24:19-27.
8. Zhang Y, Schuff N, Ching C, et al. Joint assessment of structural, perfusion, and diffusion MRI in Alzheimer’ s disease and frontotemporal dementia. Int J Alzheimer’s Dis. 2011; 2011(7): 546871-546882.
9. A Sierramarcos. Regional Cerebral Blood Flow in Mild Cognitive Impairment and Alzheimer's Disease Measured with Arterial Spin Labeling Magnetic Resonance Imaging. International Journal of Alzheimer’s Disease. 2017; 2017(7): 5479597.
Figures