1997
Structural and Functional Networks of Emotion Regulation Are Altered in Subjective Cognitive Decline1Institute of Medical Device and Imaging, National Taiwan University College of Medicine, Taipei, Taiwan, 2Department of Psychology, National Taiwan University, Taipei, Taiwan, 3Department of Neurology, National Taiwan University Hospital, College of Medicine, National Taiwan University, Taipei, Taiwan, 4Molecular Imaging Center, National Taiwan University, Taipei, Taiwan, 5Graduate Institute of Brain and Mind Sciences, College of Medicine, National Taiwan University, Taipei, Taiwan
Synopsis
Previous research suggested that subjective cognitive decline (SCD) may also present with other psychiatric diseases, personal traits, physical conditions and medication use. We hypothesized the depressive trait was the early factor and its neural correlates of function or structure changes may reflect such mental feature. We investigated the functional and structural connectivity of the emotion regulation network in SCD. We found that left amygdala to left IFG especially displayed both functional and structure changes. Our study suggests that the altered patterns of the emotion regulation network could serve as the neural basis of the emotion regulation function and display the depressive trait is the critical risk factor for SCD progression to memory disease.
Introduction
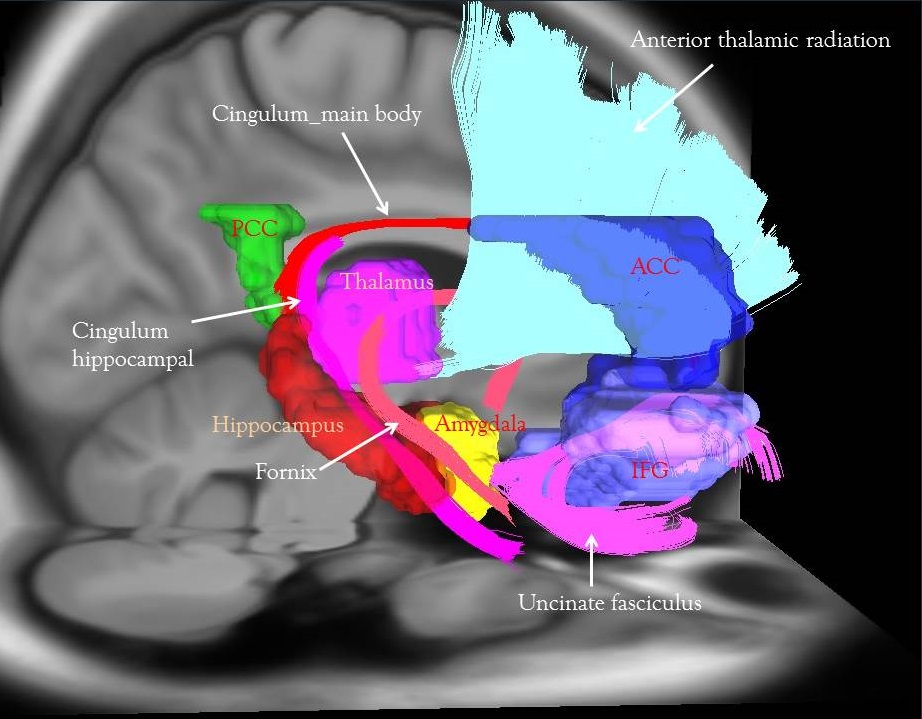
Previous research has reported that the clinical neurodegenerative trajectories are accelerated in mild cognitive impairment (MCI) patients with depressive symptoms1. It is unclear at earlier stage such as subjective cognitive decline (SCD) whether depression symptoms are an earlier marker of progression to dementia. Previous research suggested that SCD may also present with other psychiatric diseases, personal traits, physical conditions and medication use2. We considered the mental condition and personal traits such as the depressive characteristics are the critical risk factors for SCD progression to disease. We hypothesized the depressive trait was the early factor and its neural correlates of function or structure changes may reflect such mental feature. The present study investigated the functional and structural connectivity of the emotion regulation network connecting the limbic and frontal lobes, namely Papez’s circuit3, in SCDMaterial & Method
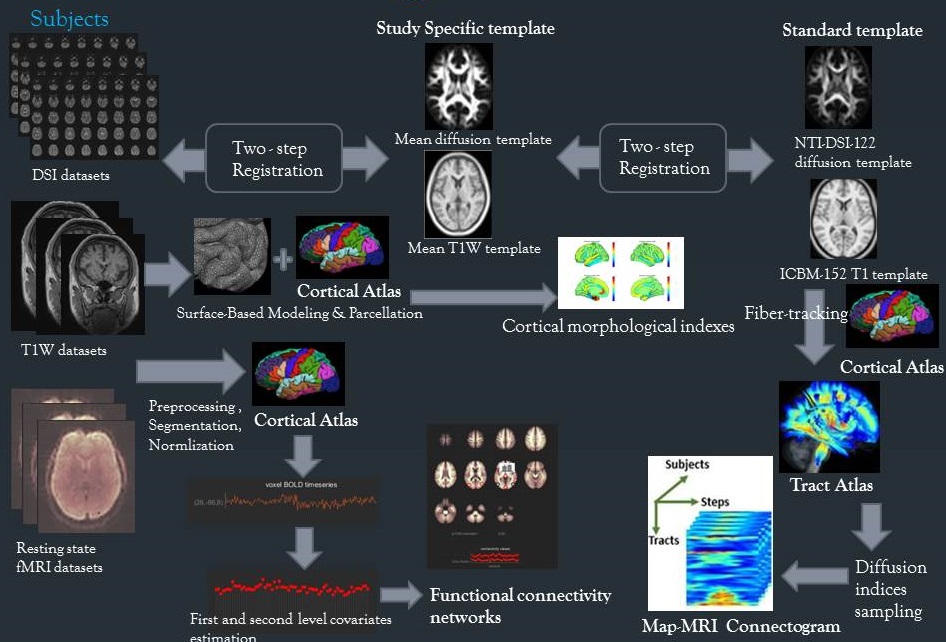
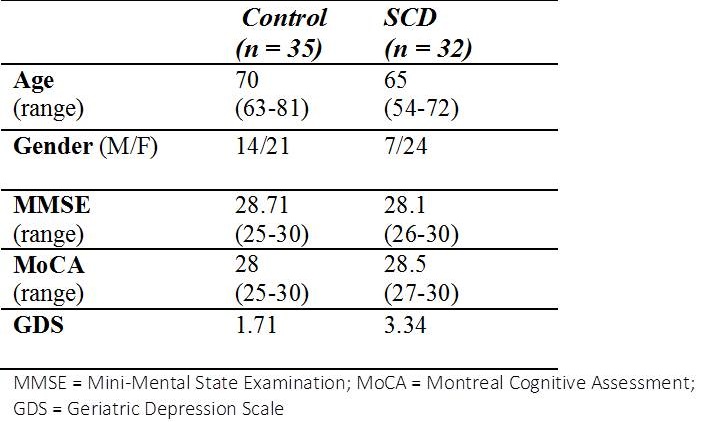
Subjects 35 cognitively normal older adults (Group1, mean ages 70 yrs), and 32 older adults with subjective cognitive decline (SCD) (Group 2, mean age 65 yrs) were recruited. All participants were diagnosed by memory clinic and completed a battery of neuropsychological tests. Table 1 shows the demographics. Age and gender effects were controlled in the statistical models applied for MRI imaging analyses. Image Acquisition MRI scanning was performed on a 3T MRI system (TIM, Trio, Siemens) with a 32 channel phased-array head coil. T1-weighted images were acquired using a 3D rapid gradient-echo sequence (TR/TE = 2530/3.4 ms, flip angle = 9°, FOV = 256 x192 x 208 mm3. Diffusion spectrum imaging (DSI) was acquired using a diffusion echo planar imaging sequence, TR/TE = 9600/130 ms, FOV = 200 mm, image matrix size = 80 x 80, and 2.5 mm slice thick. A total of 102 diffusion encoding gradients with the maximum diffusion sensitivity bmax = 4000 s/mm2 were sampled. For resting state functional MRI, the imaging parameters were echo planar imaging volumes = 180, TR/TE = 2000/24 ms, flip angle = 90°, FOV = 256 x 256 mm2, matrix size = 64 x 64, slice thickness = 3 mm, voxel size = 4 x 4 x 3 mm3. All participants were instructed to remain still with their eyes closed to complete a 6-min resting-state fMRI scan. Surface-Based Morphological Analysis The cortical regions segmented byT1W images was performed by FreeSurfer software and a computational anatomy toolbox CAT12. ANOCOVA was performed to compare the between-group differences in the cortical thickness index of the 5 tracts, controlling for the gender, and age effects. Mean Apparent Propagator (MAP)-MRI4Analysis and Template-Based Analytical Analysis (TBAA)5 MAP-MRI fits with a linear combination of Hermite functions. Various diffusion indexes can be readily calculated from the MAP-MRI coefficients, rendering MAP-MRI a good quantifying method for clinical studies.6 ANCOVA was performed to compare the between-group differences in the GFA of the 5 tracts, controlling for the gender, age, and white matter hyperintensity (Fazekas scale). Functional Connectivity Analysis ROI-ROI functional connectivity was analyzed using CONN toolbox and household Matlab connectivity scripts. Figure 2 visualizes the T1W, rsfMRI and DSI processing pipeline. All participants’ DSI and rsfMRI images were coregistered with their T1W images, normalized in MNI space and the cortical ROI were segmented on the basis of automated anatomical labeling (AAL) atlas.Results
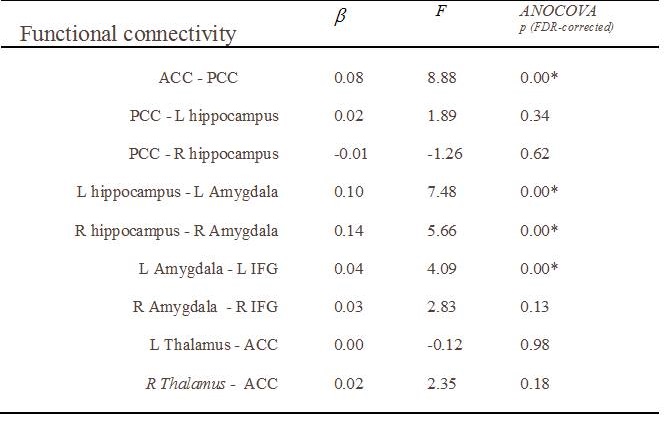
The functional connectivity of the emotion network shows that the connectivity with significant group differences was found between the anterior cingulum cortex (ACC) and posterior cingulum cortex (PCC), between bilateral hippocampus and amygdala, and between left amygdala and left inferior frontal cortex (IFG). The cortical thickness of bilateral entorhinal regions showed significant group differences. The structural connectivity connecting PCC and right hippocampus, namely cingulum hippocampal part, and connecting the bilateral amygdalae and IFG, namely bilateral uncinate fasciculi showed significant group differences (Table 2 & 3).Discussion
Bilateral entorhinal regions of the thickness index in the SCD group displayed significant difference from those in the control group. Such finding supports the previous literature that the morphological changes in the hippocampus plays a crucial role in dementia-related progression1,7. The structural and functional connectivity of the emotion network displayed the neural changes in the SCD group. The fiber tracts of the bilateral uncinate fasciculi connecting the limbic lobe and frontal cortex showed significant changes between the control and SCD groups. Left amygdala to left IFG especially displayed both functional and structure changes. Such finding suggests the crucial rule of the amygdala in emotion regulation function and its interaction with the frontal lobe. In summary, our study investigating SCD with depressive trait suggests that the altered patterns of the emotion regulation network could serve as the neural basis of the emotion regulation function and display the emotional tract is the critical risk factor for SCD progression to memory disease.Acknowledgements
1. Grant NSC 104-2628-H-002-001-MY3 (Yu-Ling Chang, Ph.D.)
2. Grant NSC 105-2420-H-002-003-MY2 (Yu-Ling Chang, Ph.D.)
3. Grant 06A1-PHSP08-028 (Ming-Jang Chiu, M.D., Ph.D.)
References
1 Chung, J. K. et al. Depressive Symptoms and Small Hippocampal Volume Accelerate the Progression to Dementia from Mild Cognitive Impairment. Journal of Alzheimer's disease : JAD 49, 743-754, (2016).
2 Cheng, Y. W., Chen, T. F. & Chiu, M. J. From mild cognitive impairment to subjective cognitive decline: conceptual and methodological evolution. Neuropsychiatr Dis Treat 13, 491-498, (2017).
3 Catani, M., Dell'acqua, F. & Thiebaut de Schotten, M. A revised limbic system model for memory, emotion and behaviour. Neuroscience and biobehavioral reviews 37, 1724-1737, (2013).
4 Ozarslan, E. et al. Mean apparent propagator (MAP) MRI: a novel diffusion imaging method for mapping tissue microstructure. Neuroimage 78, 16-32, (2013).
5 Avram, A. V. et al. Clinical feasibility of using mean apparent propagator (MAP) MRI to characterize brain tissue microstructure. Neuroimage 127, 422-434, (2016).
6 Chen, Y. J. et al. Automatic whole brain tract-based analysis using predefined tracts in a diffusion spectrum imaging template and an accurate registration strategy. Human brain mapping 36, (2015).
7 Mueller, S. G. et al. Hippocampal atrophy patterns in mild cognitive impairment and Alzheimer's disease. Human brain mapping 31, 1339-1347, (2010).
Figures