1995
Quantitative T1 and T2 mapping with standard and MR fingerprinting techniques to assess frontotemporal dementia: A pilot study1Department of Radiology, University Hospital Bonn, Bonn, Germany, 2Philips Research, Hamburg, Germany, 3Philips Healthcare, Bonn, Germany, 4Department of Psychiatry, University Hospital Bonn, Bonn, Germany
Synopsis
This pilot study explored the utility of MR fingerprinting (MRF) and standard T1 and T2 relaxometry to discover focal anomalies in patients with the primary progressive aphasic form of frontotemporal dementia (FTD). MRF and standard techniques revealed longer T1 and T2 relaxation times of cortex and deep white matter as well as the hippocampus (left>right) in FTD compared to healthy controls. Relaxation times between MRF and standard differed and not all techniques revealed all structures as altered in relaxation time. In conclusion, MRF and standard relaxometry have the potential to quantify brain anomalies in FTD, which may be used for diagnosis and monitoring, but are not interchangeable.
Introduction
Frontotemporal dementia (FTD) is an umbrella term covering several rare but very severe forms of dementia associated with frontotemporal lobe degeneration. In particular quantitative MR imaging has the potential to facilitate diagnostics, differentiation and follow-up based on alterations of brain anatomy, perfusion or composition1-3.
Quantitative T1 and T2 relaxometry allow an absolute quantification of tissue relaxation times defined by the physicochemical properties of the brain. qT1 or qT2 maps can either be generated from inversion recovery (T1 mapping) or multi-echo (T2 mapping) sequences4. A recent innovation is the reconstruction of T1 and T2 maps from MR fingerprinting (MRF) data5,6. MRF is due to its versatility of reconstruction potentially very time-saving, which means a great comfort for patients with dementia.
In comparison with healthy controls this pilot study explores the feasibility to detect focal differences of T1 and T2 relaxation times in patients with the primary progressive aphasic (PPA) form of FTD. Our secondary aim is to detect qualitative and quantitative differences between standard and MRF-based relaxometric data (s-qT1 and T2 vs. MRF-qT1 and T2).
Methods
This study was performed by permission of the local ethics committee with consenting test-confirmed PPA-type FTD patients (n=7) and healthy controls (n=26).
The protocol consisted of a 1mm³ 3D T1-weighted sequence, standard qT1 and qT2 sequences and a MRF sequence at 3T (Achieva TX) with an 8-channel head coil (scan time total: 18 minutes).
The 2D MRF sequence was FISP-based7 (TR 15ms, TE 3.5ms, two spiral interleaves/slice, acquisition window 7.0ms, acceleration factor 15, FOV 240x240x60mm; 12 slices) starting with an adiabatic inversion pulse followed by an optimized FA sequence8 (0 and 60°). MRF dictionary used the EPG (extended phase graphs algorithm) for T1 between 10 and 2000 in steps of 10ms and T2 between 10 and 200 in steps of 1ms and from 210 to 600ms in steps of 10ms. The slice profile of the RF pulse was included in the dictionary computation. MRF-T1 and T2 maps were obtained by inner product pattern matching of the dictionary with the reconstructed temporal signals for each pixel.
s-qT1 maps were isotropic inversion recovery (IR)-based (shortest TR 4.81–5.07msec, TE 2.49–2.59msec, FA 15°, 5 inversion time delays of 150, 350, 750, 1200 and 2300msec, FOV 240×220x70mm, 28 slices). Maps were generated with an in-house script in Matlab9. Multi-echo s-qT2 maps were (TR 1s, TE 15, 30, 45, 60, 75, 90, 105 and 120 msec, FOV 240x212x66mm; 12 slices) generated by industry-delivered software.
Coregistration and segmentation of substructural compartments (gray matter, white matter, hippocampus, putamen, pallidum, caudate both hemispheres) was done with FSL10 and visualized with ITK-SNAP11. Independent and paired t-tests were applied after testing for normal distribution.
Results
Mean age was 65.6±7.8yrs for FTD patients (4 women) and 66.3±4.9 years (healthy controls; 10 women). MRF-qT1 and s-qT2 mapping identified the same three regions as showing relaxation times deviant from controls: the cortical gray matter, the deep white matter and the hippocampus (Fig. 1).
While s-qT2 times were significantly longer in both hippocampi of FTD patients, MRF-qT1 time elongation reached significance only in the left hippocampus, but was more subtle in the right (Fig. 2; P=0.1 for the right hippocampus). The left hemisphere was with one exception also more affected by atrophy than the right (Fig. 3).
MRF-qT2 maps identified both hippocampi as affected by T2 time elongation compared to controls, but were not significantly different in cortical gray and white matter. s-qT1 showed a tendency for longer T1 times in white matter (P=.07). T1 times of both methods and T2 times respectively were significantly different for all substructures (P<.05).
Discussion and Conclusion
This pilot study revealed the potential of T1 and T2 mapping in the assessment of FTD. Longer relaxation times in gray and white matter for both T1 and T2 mapping can plausibly be explained by neuronal loss and reduced connectivity.
It is noteworthy that the stronger anatomical affection of the left hemisphere is also reflected in a larger deviance of relaxation times from normal. Both MRF-based and standard mapping methods revealed similar anomalies. However, relaxation times differed significantly, and frequently not all structures were identified, e.g. none to a 5% significance level by s-qT2 mapping. MRF-based and standard mapping do therefore not deliver interchangeable results. MRF however has the advantage to allow a reconstruction of multiple relaxation maps based on one sequence acquisition, which is a great advantage to patient comfort.
In conclusion, MRF-based and standard T1 and T2 relaxometry have the potential to discover focal FTD-related anomalies. Future studies must explore their value for diagnostics and monitoring of the disease.
Acknowledgements
No acknowledgement found.References
1. Mandelli ML, Vitali P, Santos M, et al. Two insular regions are differentially involved in behavioral variant FTD and nonfluent/agrammatic variant PPA. Cortex. 2016;74:149-157.
2.Steketee RM, Meijboom R, Bron EE, et al. Structural and functional brain abnormalities place phenocopy frontotemporal dementia (FTD) in the FTD spectrum. Neuroimage Clin. 2016;11:595-605.
3. Shi Z, Liu S, Wang Y, et al. Correlations between clinical characteristics and neuroimaging in Chinese patients with subtypes of frontotemporal lobe degeneration. Medicine (Baltimore). 2017;96(37):e7948.
4. Lescher S, Jurcoane A, Veit A, et al. Quantitative T1 and T2 mapping in recurrent glioblastomas under bevacizumab: earlier detection of tumor progression compared to conventional MRI. Neuroradiology. 2015;57(1):11-20.
5. Ma D, Gulani V, Seiberlich N, et al. Magnetic resonance fingerprinting. Nature. 2013;495(7440):187-192.
6. Badve C, Yu A, Rogers M, et al. Simultaneous T1 and T2 Brain Relaxometry in Asymptomatic Volunteers using Magnetic Resonance Fingerprinting. Tomography. 2015;1(2):136-144.
7. Jiang Y, Ma D, Seiberlich N, et al. MR fingerprinting using fast imaging with steady state precession (FISP) with spiral readout. Magn Reson Med. 2015;74(6):1621-1631.
8. Sommer K, Amthor T, Doneva M, et al. Towards predicting the encoding capability of MR fingerprinting sequences. Magn Reson Imaging. 2017;41:7-14
9. Hattingen E, Muller A, Jurcoane A, et al. Value of quantitative magnetic resonance imaging T1-relaxometry in predicting contrast-enhancement in glioblastoma patients. Oncotarget. 2017;8(32):53542-53551.
10. FSL. http://fsl.fmrib.ox.ac.uk. Accessed Nov 3, 2017.
11. Yushkevich PA, Piven J, Hazlett HC, et al. User-guided 3D active contour segmentation of anatomical structures: significantly improved efficiency and reliability. Neuroimage. 2006;31(3):1116-1128.
Figures
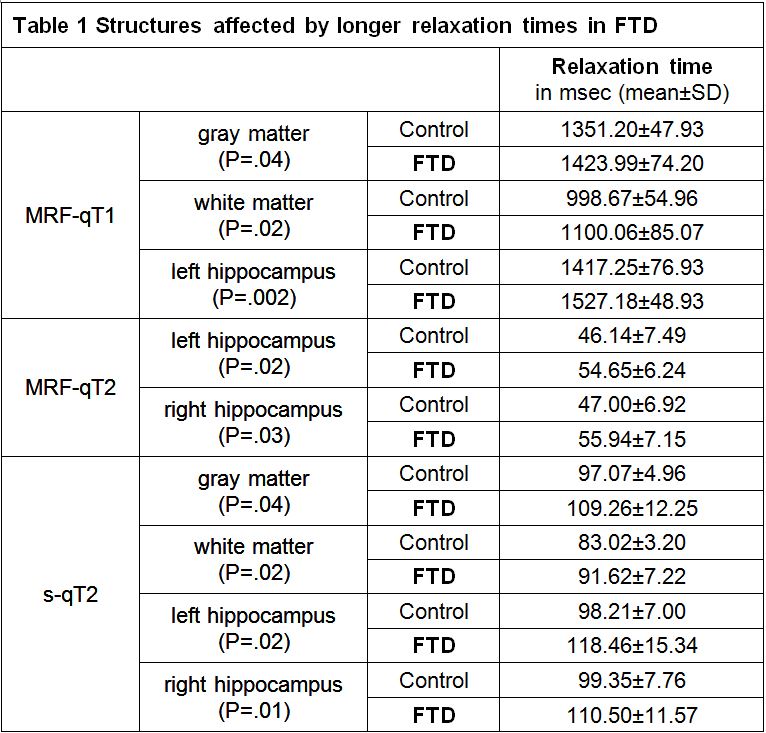
Fig. 1 Structures affected by longer relaxation times in FTD
Only significant relaxation time differences between healthy controls and PPA-FTD patients (P<0.05) were included. s-qT1 did not identify significant differences and is therefore not listed here.
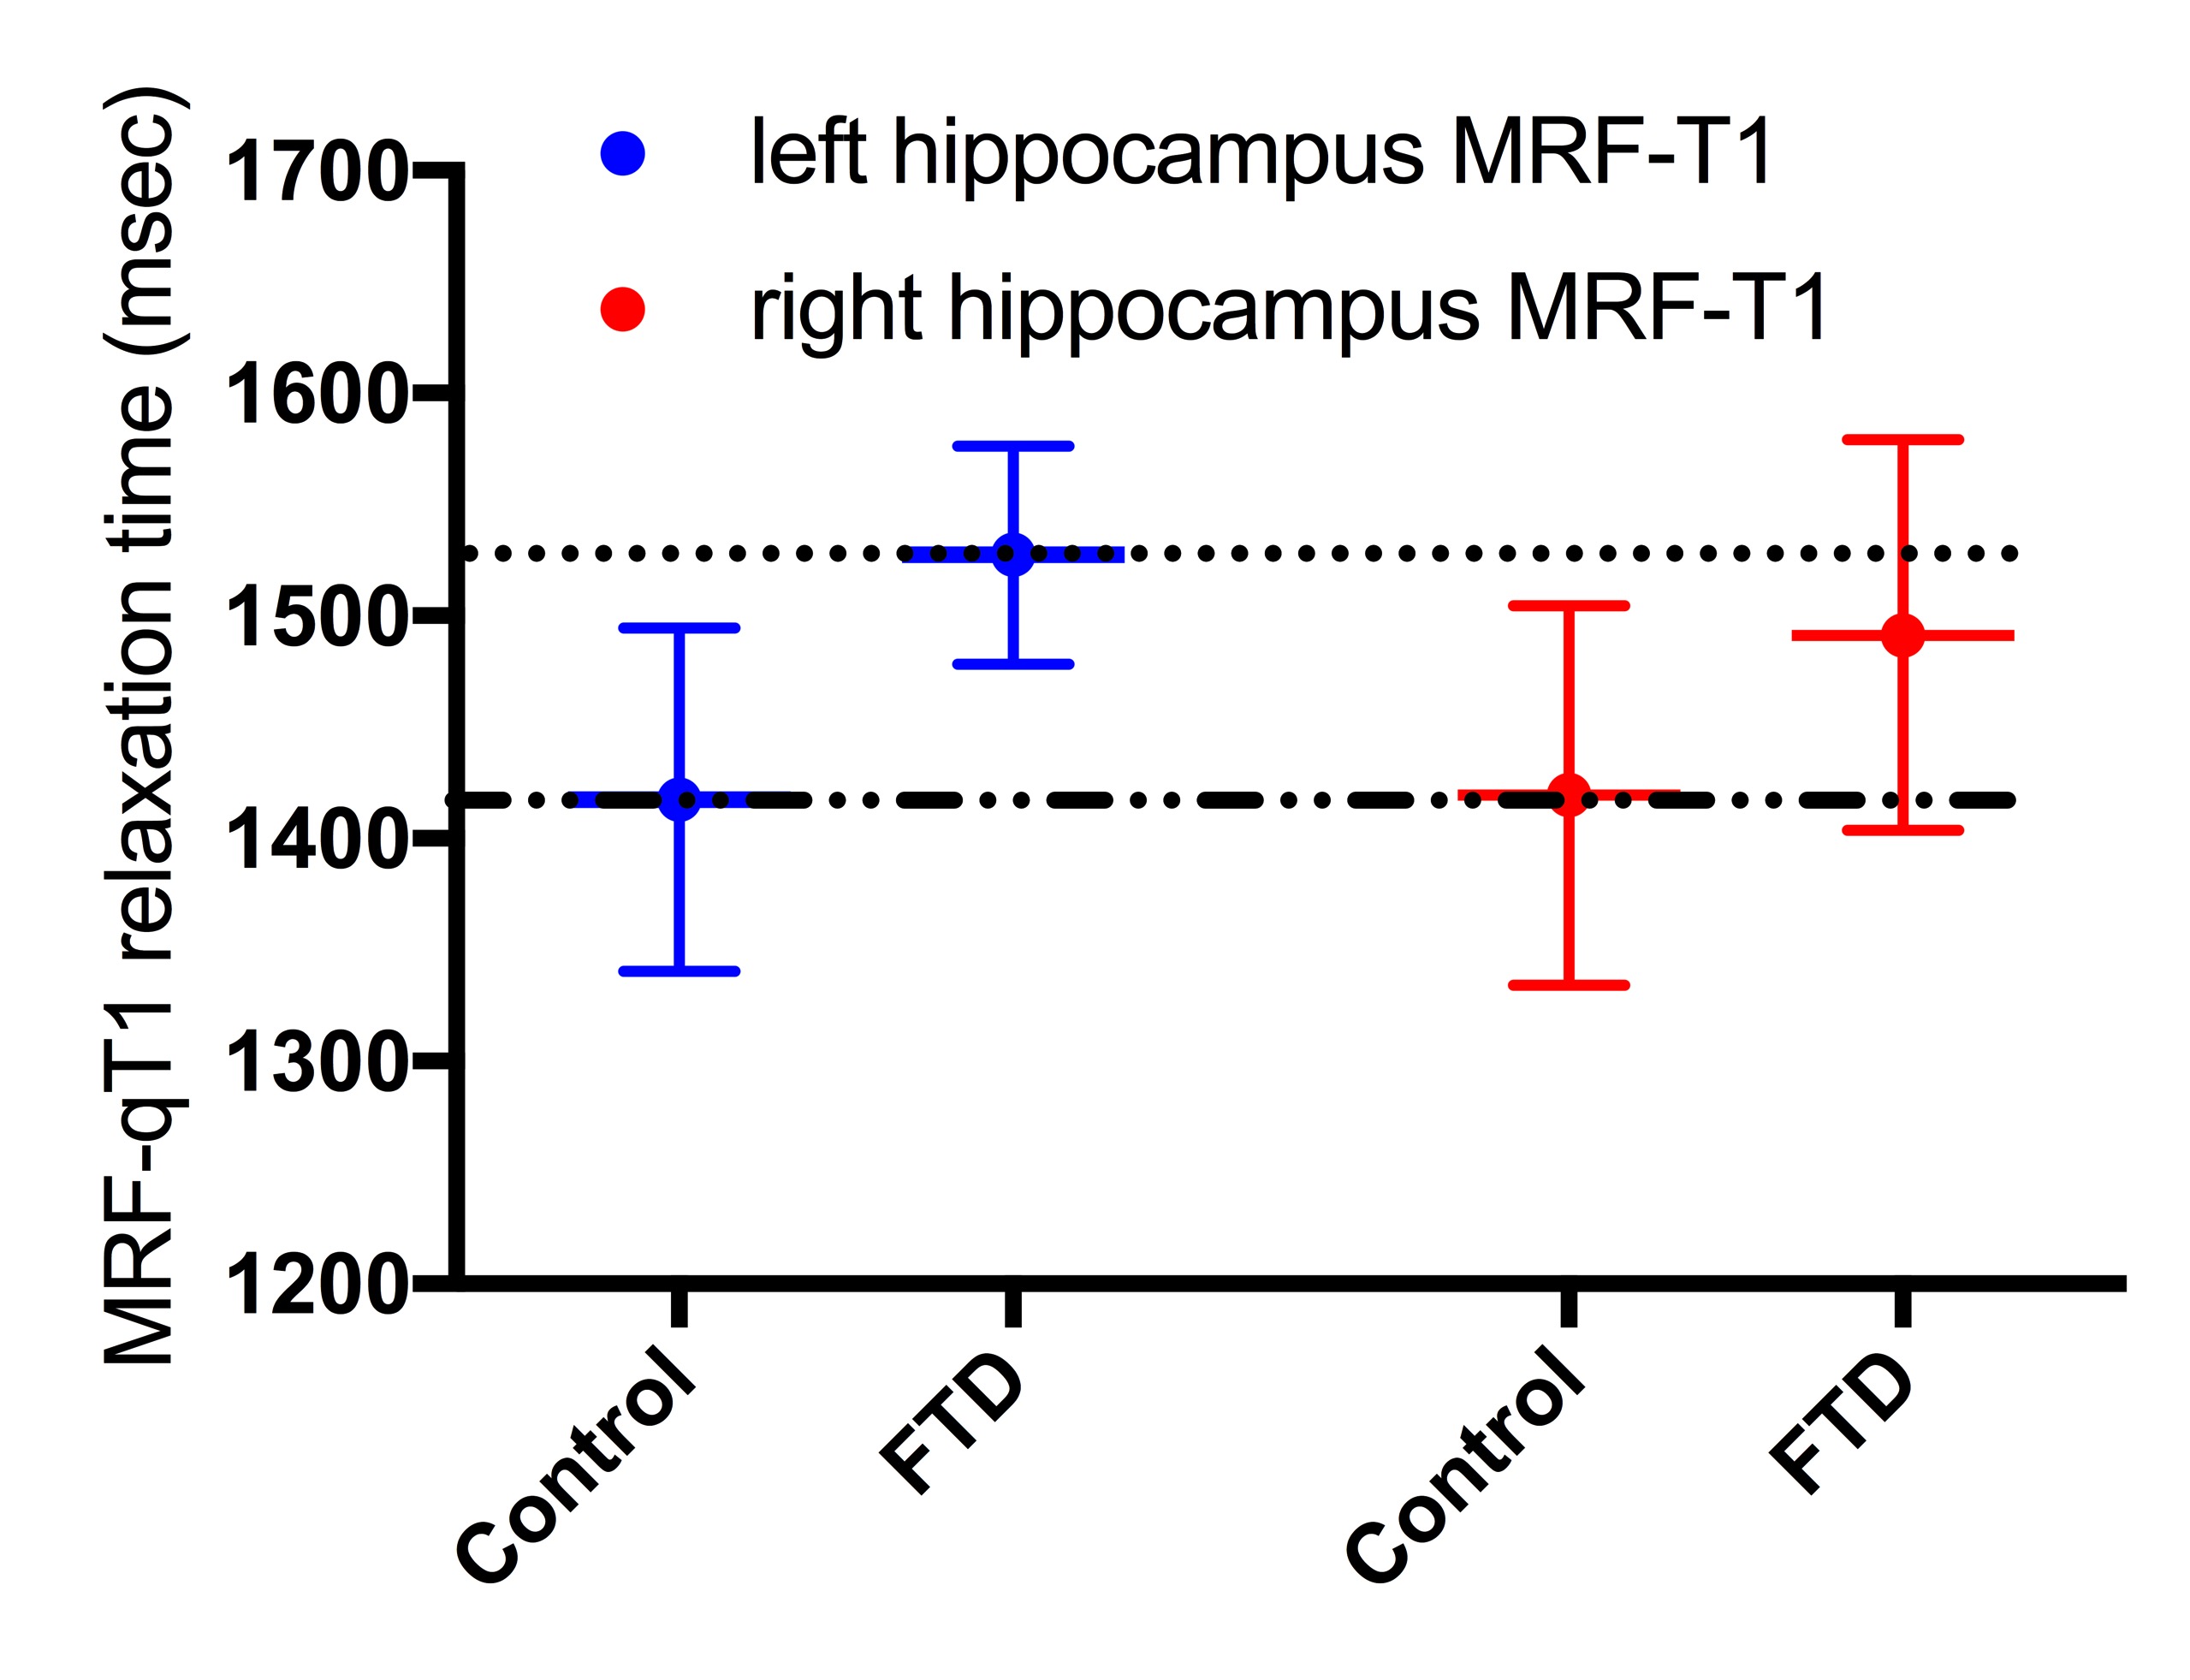
Fig. 2 Example of differences in T1 relaxation times (MRF-qT1)
While controls show near identical T1 relaxation times for both hippocampi, relaxation times are asymmetrically longer in FTD patients with greater mean affection of the left hemisphere. For easier interpretation, mean T1 times of the left hippocampus are marked with dotted lines.
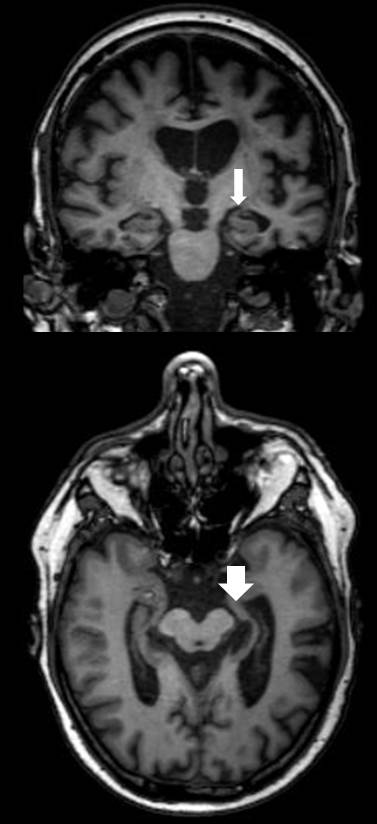
Fig. 3 Example of anatomy in an FTD patient of this cohort
The left hippocampus is more affected by atrophy than the right (white arrows), easily observed by asymmetrically widened temporal CSF spaces.