1994
Test-retest reproducibility of quantitative susceptibility mapping in a multi-site study on Alzheimer disease: effect of reference region of interest choice1Neuroradiology Department, Neurological Institute "Carlo Besta", IRCCS Foundation, Milan, Italy, 2Neuroimaging laboratory, IRCCS Santa Lucia Foundation, Rome, Italy, 3Division of Neurology V/Neuropathology, Neurological Institute "Carlo Besta", IRCCS Foundation, Milan, Italy, 4Laboratory of Alzheimer's Neuroimaging and Epidemiology, IRCCS Centro San Giovanni di Dio-FBF, Brescia, Italy, 5Memory Clinic and LANVIE-Laboratory of Neuroimaging of Aging, University Hospitals and University of Geneva, Geneva, Switzerland, 6Nuclear Medicine Unit, IRCCS San Raffaele Hospital, Milan, Italy, 7Department of Diagnostic Imaging, Neuroradiology Unit, University of Brescia, Brescia, Italy, 8Department of Neuroscience, Imaging and Clinical Sciences, University “G. d’Annunzio” of Chieti, Chieti, Italy, 9Institute for Advanced Biomedical Technologies (ITAB), University “G. d’Annunzio” of Chieti, Chieti, Italy, 10Neuroradiology Unit, Department of Diagnostic Imaging, R. Silvestrini Hospital, Perugia, Italy, 11Centre for Memory Disturbances, Lab of Clinical Neurochemistry, University of Perugia, Perugia, Italy, 12Department Health Professions - U.O.c Research and Development, Careggi University Hospital Florence, Florence, Italy, 13Department of Neuroradiology, Careggi University Hospital Florence, Florence, Italy, 14Medical Physics Unit, Spedali Civili di Brescia, Brescia, Italy, 15Section of Neurology, Center for Memory Disturbances, University of Perugia, Perugia, Italy, 16Scientific Direction, Neurological Institute "Carlo Besta", IRCCS Foundation, Milan, Italy, 17Center for Mind/Brain Sciences, University of Trento, Mattarello, Italy
Synopsis
Quantitative susceptibility mapping (QSM) is a neuroimaging marker of iron of interest as biomarker of Alzheimer disease (AD) progression. The purpose of this work was to assess the test-retest reproducibility of QSM in the Italian AD-NET project, a multi-site study on AD. We evaluated how QSM reproducibility is affected by acquisition (different clinical 3T MRI sites using vendor provided sequences) and analyses factors (choice of the reference region of interest used to compute within-subject relative QSM). The goal is to minimize reproducibility errors and thus maximize the sensitivity to detect longitudinal QSM changes related to the progression of AD.
INTRODUCTION
Recent studies reported an association between brain iron deposits and amyloid-beta-plaques in Alzheimer's disease (AD)1–3. Quantitative susceptibility mapping (QSM) is a novel magnetic resonance imaging (MRI) method that provides a sensitive and reliable quantification of brain iron concentrations in vivo4,5. In the last years, the growth of multi-center studies underlined the need to assess the stability of this technique for its widespread application. However, few studies investigated the reproducibility of this technique6,7. Open questions remain about the impact of a) different acquisition set-up and b) post-processing steps. The former includes a test for differences across sessions (e.g. head positioning) or across sites (e.g. different receiver coils); the latter comprises the choice of a suitable reference tissue independent of age and disease to obtain a relative QSM measure to allow the comparison among different subjects4,8,9 (Figure 1). In our multi-site study, we aimed at testing the reproducibility of QSM measure using test-retest acquisitions in healthy participants. The objectives of this work were to choose an accurate analysis pipeline and to evaluate the reproducibility of QSM estimates within and across scanning session/sites in different reference regions reported in literature.METHODS
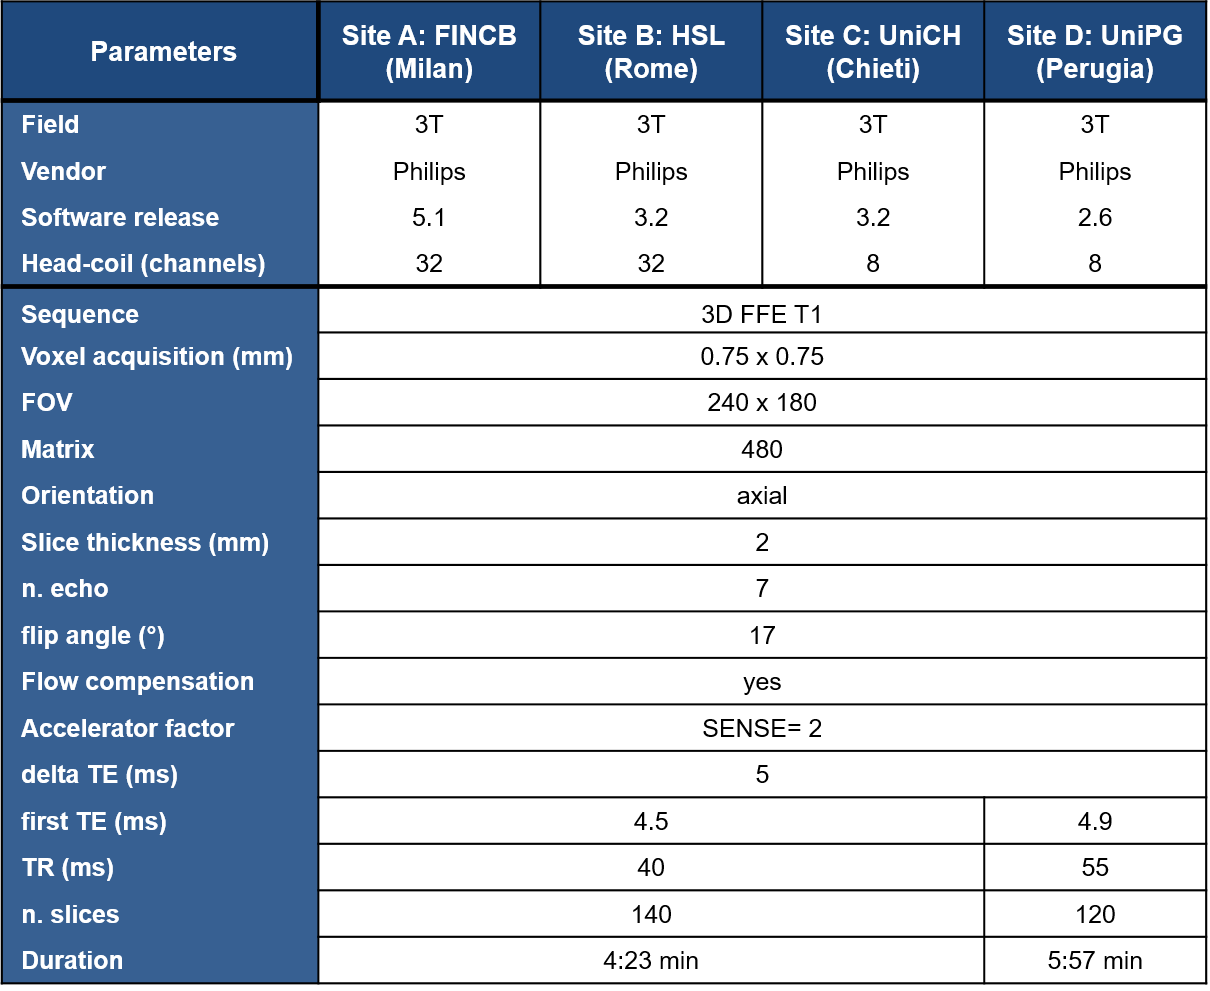
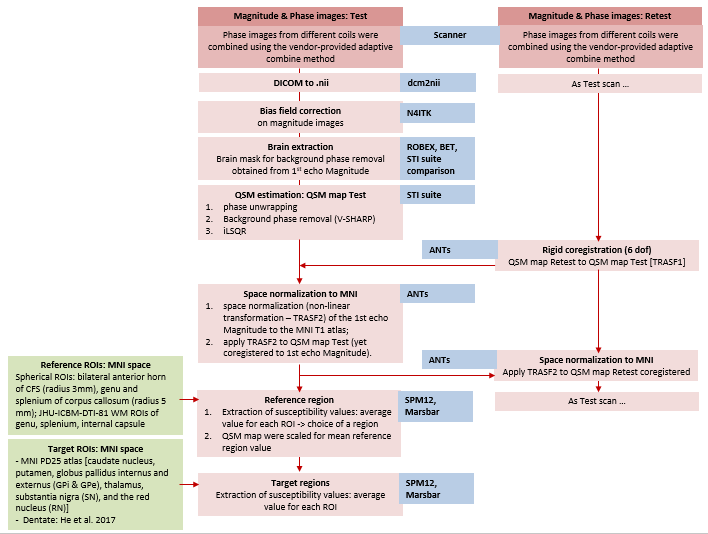
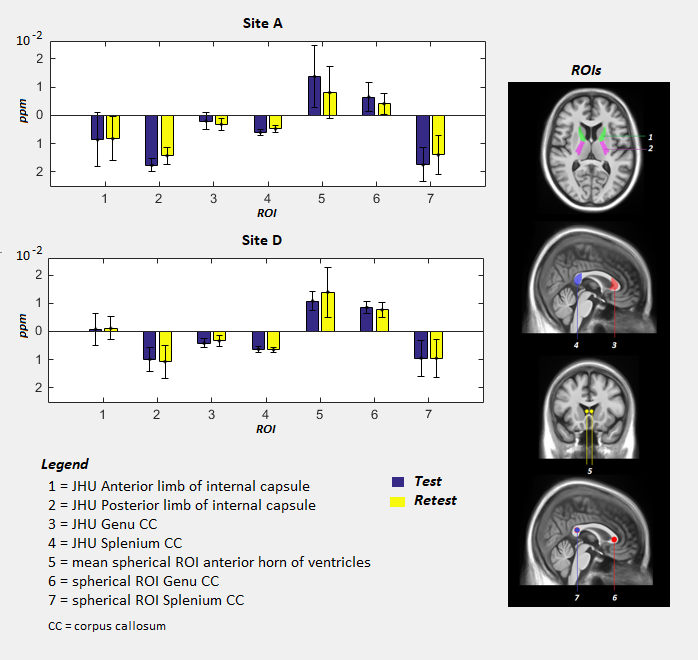
Four clinical 3T MR scanners performed QSM acquisition and five healthy subjects (age range: 35-75 years) were recruited in each site. Each subject underwent 2 scans (test and retest), with a time interval of approximately 7 days between the two scans. 3D T1-weighted and multi-echo gradient-echo images were acquired for QSM reconstruction. Details of MR imaging scanners and QSM sequences are reported in Figure 2. Steps of analysis pipeline were implemented according to the state of art in this field 10,11 (Figure 3). An important step in group QSM analyses is the choice of a reference region for computing relative QSM measures. Several choices for the reference region of interest (ROI) have been proposed in the literature (Figure 1), for QSM computation we considered the following volumes: JHU-ICBM-DTI-81 atlas ROI in anterior and posterior limb of internal capsule, spherical ROI in anterior horns of cerebral ventricles as well as JHU-ICBM-DTI-81 atlas and spherical ROI in genu and splenium of corpus callosum8 (Figure 4). For each of these ROIs we computed the intra-site test-retest reproducibility. Inter-site reproducibility differences were assessed with Mann-Whitney (p<0.05, corr. multiple measures), while intra-site reproducibility with absolute % relative errors.RESULTS
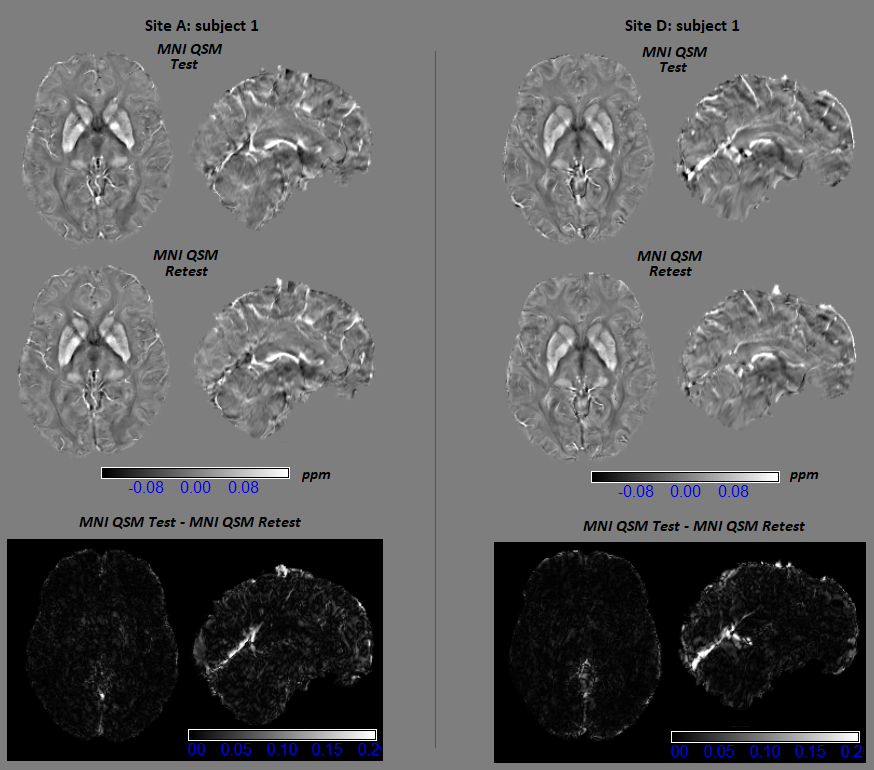
Figure 5 reports sample montreal neurological institute (MNI) QSM maps of test-retest for two different subjects scanned in Site A and D, respectively, and the corresponding test-retest difference map. Figure 4 reports the mean and standard deviation for 7 reference ROIs. Standard deviations were lower than previous studies8. Regardless of reference ROI, no significant inter-site differences were reported. For intra-site reproducibility, the lowest absolute % relative errors in site A were obtained for atlas posterior limb of internal capsule and atlas splenium of corpus callosum, while in site D for atlas splenium of corpus callosum, atlas posterior limb of internal capsule, and spherical ROI in genu of corpus callosum. Across site, the atlas splenium of corpus callosum and posterior limb of internal capsule give the highest consistency. Moreover, the susceptibility values derived from atlas ROIs presented a smaller standard deviation than values obtained by spherical ROI, indicating more stable measures.DISCUSSION
One of the critical steps in the definition of the analysis pipeline for QSM was the identification of a suitable reference region to correct for the current offsets due to field map estimation. The absence of inter-site differences in ROIs allow the evaluation of QSM measures in the multi-site study. Our preliminary results in two sites shows that splenium obtained from atlas, among the tested ROIs, are the most reproducible reference regions not only intra-, but also inter-scanners. This result is in line with a previous study that reported this region as suitable reference regions on a sample of patients8.CONCLUSION
We preliminarily evaluate acquisition and post-processing analysis pipeline for QSM, identifying possible reference regions with the highest reproducibility intra- and inter-scanner in Site A and D. Analyses will be extended to other scanners of the consortium. This will allow the use of QSM in the context of a multi-site study on AD, whose primary aim is the development of operational research criteria for early recognition of typical and atypical forms of AD integrating clinical, imaging, and molecular data. Our study, contributing to appreciation of possible advantages of this technique, may support its use as an early biomarker of AD.Acknowledgements
This work was supported by the Italian Minister of Health, grant number: NET-2011-02346784.References
1. Ayton S, Fazlollahi ÃA, Bourgeat ÃP, et al. Cerebral quantitative susceptibility mapping predicts amyloid- b -related cognitive decline. Brain. 2017;(October):2112-2119. doi:10.1093/awx167.
2. Bergen JMG Van, Li X, Hua J, Schreiner SJ, Steininger SC, Quevenco FC. Colocalization of cerebral iron with Amyloid beta in Mild Cognitive Impairment. Sci Rep. 2016;(September):1-9. doi:10.1038/srep35514.
3. Callaghan JO, Holmes H, Powell N, et al. NeuroImage Tissue magnetic susceptibility mapping as a marker of tau pathology in Alzheimer's disease. Neuroimage. 2017;159(March):334-345.
4. Wang Y, Liu T. Quantitative Susceptibility Mapping ( QSM ): Decoding MRI Data for a Tissue Magnetic Biomarker. Magn Reson Med. 2015;101:82-101.
5. Haacke EM, Liu S, Buch S, Zheng W, Wu D, Ye Y. Quantitative susceptibility mapping : current status and future directions. Magn Reson Imaging. 2015;33(1):1-25.
6. Lin P.Y., Chao T.C. and WML. Quantitative Susceptibility Mapping of Human Brain at 3T: a multisite reproducibility study. Am J Neuroradiol AJNR. 2015:467-474.
7. Wang R, Xie G, Zhai M, Zhang Z, Wu B. Stability of R2 * and quantitative susceptibility mapping of the brain tissue in a large scale multi-center study. Sci Rep. 2017;(February):1-8.
8. Straub S, Schneider TM, Emmerich J, et al. Suitable Reference Tissues for Quantitative Susceptibility Mapping of the Brain. Magn Reson Med. 2017;214(July 2016):204-214.
9. Deistung A, Schweser F, Wiestler B, et al. Quantitative Susceptibility Mapping Differentiates between Blood Depositions and Calcifications in Patients with Glioblastoma. PLoS One. 2013;8(3):1-8.
10. Acosta-cabronero XJ, Betts MJ, Cardenas-blanco A, Yang S, Nestor PJ. In Vivo MRI Mapping of Brain Iron Deposition across the Adult Lifespan. J Neurosci. 2016;36(2):364-374.
11. Hinoda T, Fushimi Y, Okada T, et al. Evaluation of Consistency and Reproducibility. Invest Radiol. 2015;50(8):522-530.
Figures
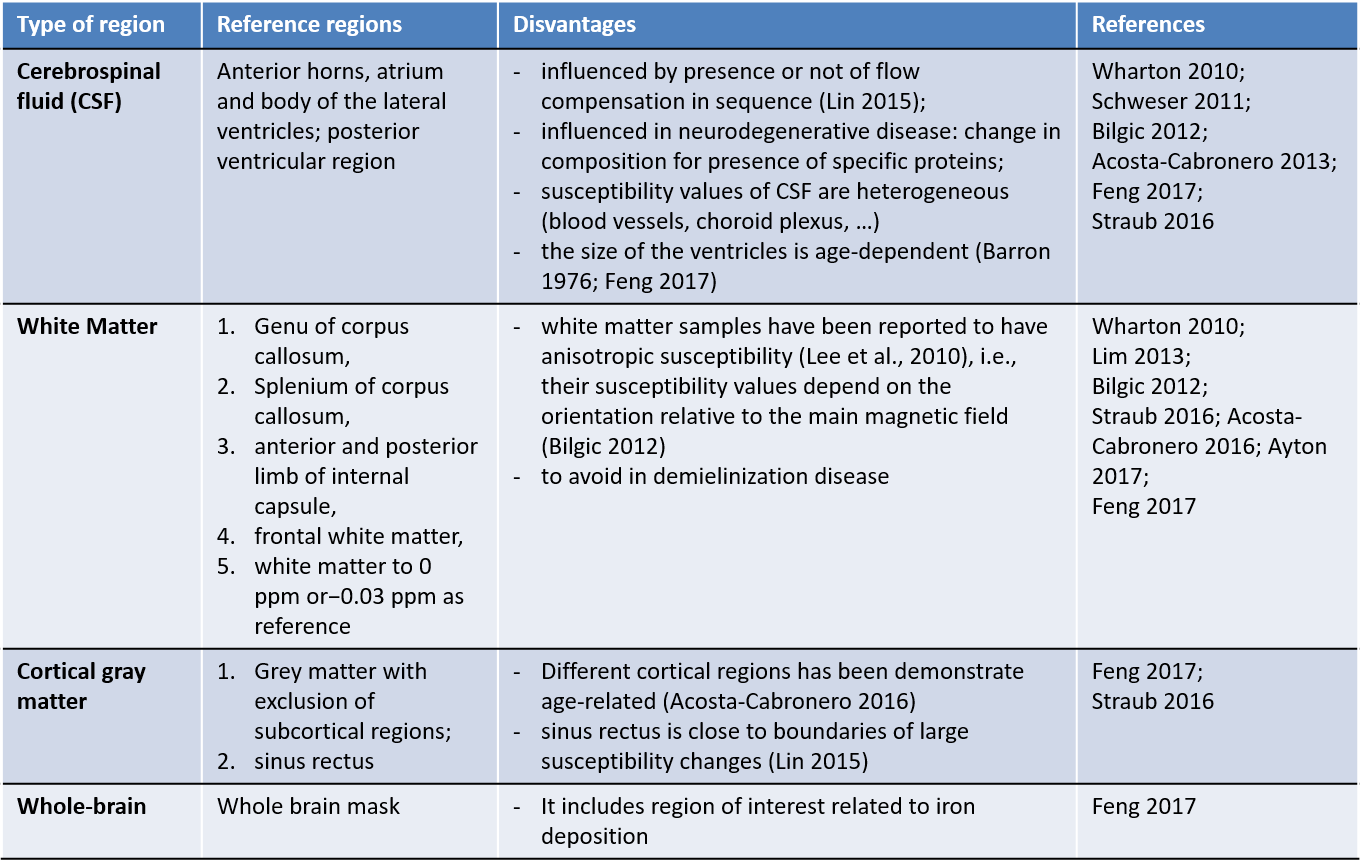
Figure 1. Reference regions reported in literature for computation of relative QSM.