1993
Clustering of Multiple Sclerosis Patient's Clinical Courses with White Matter Fiber-Bundle Profiles1CREATIS Laboratory, Université Claude Bernard - Lyon 1, Lyon, France, 2Centre Hospitalier Lyon-Sud - Service de Radiologie, Hospices Civils de Lyon, Lyon, France, 3Hôpital Neurologique - Service de Neurologie A, Hospices Civils de Lyon, Lyon, France, 4CERMEP - Imagerie du Vivant, Université de Lyon, Lyon, France
Synopsis
Predicting the individual multiple sclerosis (MS) patients evolution, based on markers available from disease onset, may help the neurologist in the patient care. However, such a prediction remains a challenge. In this study, we merged spatial information of fiber tracking with diffusivity metrics, measured in 68 patients presenting the three forms of MS, in order to classify patients using a white matter fiber-bundle profile analysis. The good performances of the clustering, reached with fractional anisotropy and mean diffusivity together, make our method a potential tool to better predict the disease evolution, especially the conversion of RR-MS to SP-MS.
Introduction
Multiple sclerosis (MS) is the most frequent disabling neurological disease in young adults. Today’s neurologist challenge is to predict the individual patient evolution and response to therapy based on the clinical, biological, and imaging markers available from disease onset.
By merging spatial information of fiber tracking with DTI metrics, WM fiber-bundles could be modeled and analyzed along their profile. [1] This WM fiber-bundle profile analysis enable to characterize the diffusion properties of WM structures and their pathological alterations in MS. The main scope of this work is to discriminate MS patients clinical courses according to their WM fiber-bundle profiles.
Material and Methods
Participants
Sixty-eight MS patients (25 RR-MS, 26 SP-MS, and 17 SP-MS) were recruited from the MS clinic of Lyon Neurological Hospital. Diagnosis and disease course were established according to the McDonalds criteria. [2, 3] Twenty-five healthy control (HC) subjects, age and sex matched with the MS patients, were included in this study. This prospective study was approved by the local ethics committee (CPP Sud-Est IV) and the French national agency for medicine and health products safety (ANSM).Written informed consent was obtained from all participants.
MRI Acquisitions
MS patients and HC subjects underwent an MR examination on a 1.5T Siemens Sonata system (Siemens Medical Solution, Erlangen, Germany) using an 8-channel head-coil. An axial 2D-spin-echo DTI sequence (TE/TR = 86/6900ms; 2 × 24 directions of gradient diffusion; b = 1000s.mm2, spatial resolution of 2.5 × 2.5 × 2.5mm3) was acquired.
Image Processing
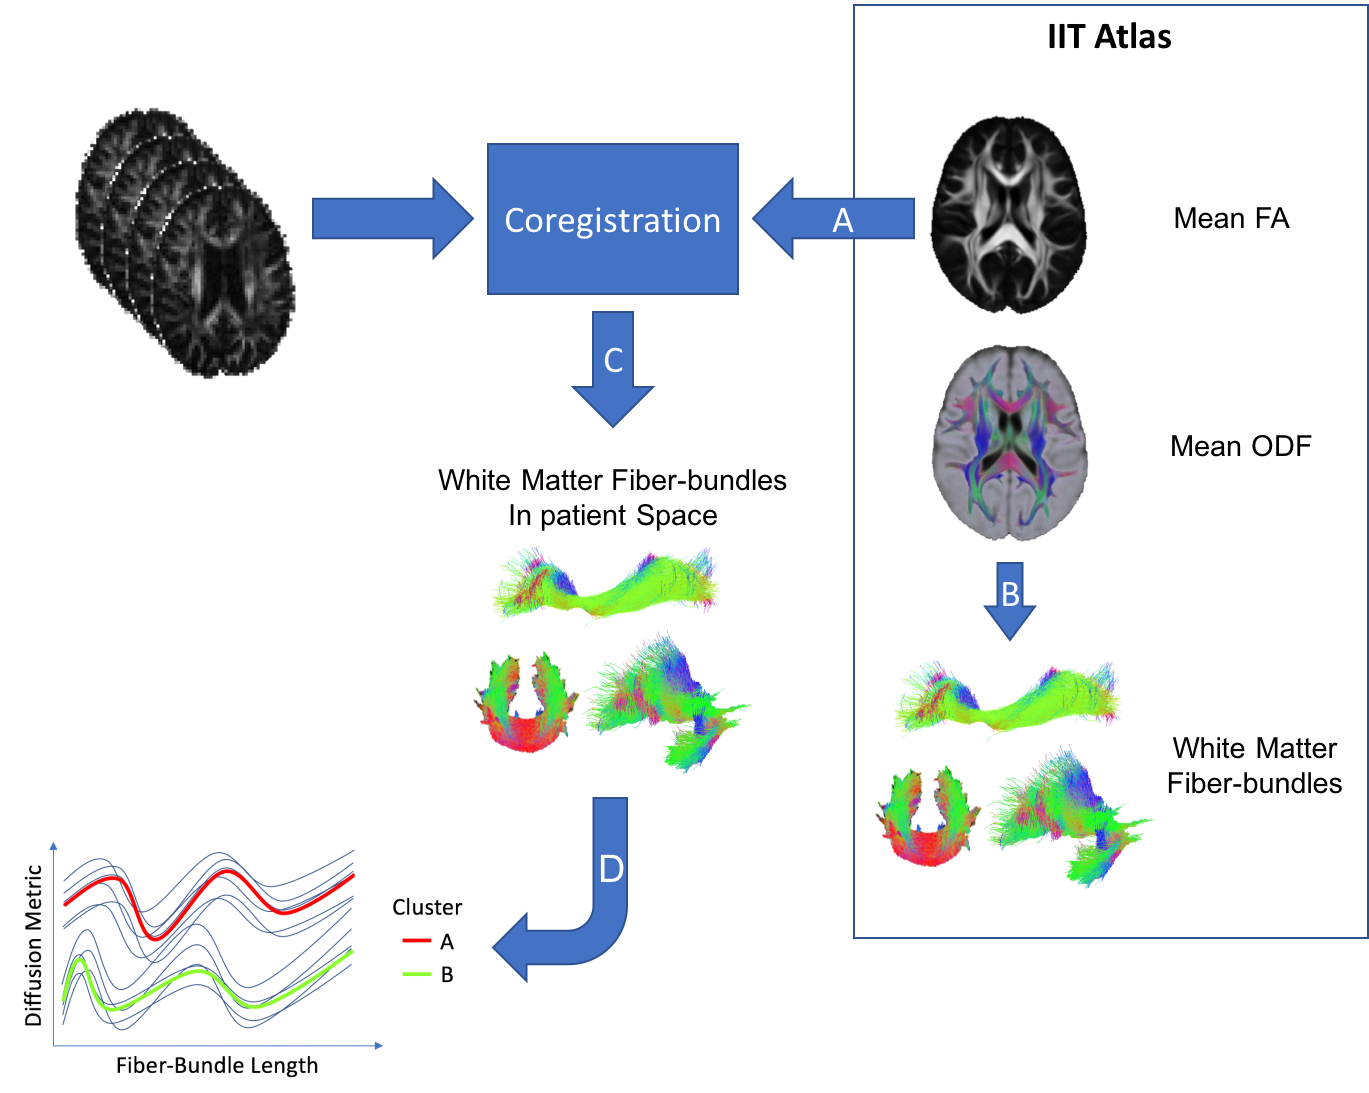
Diffusion data were corrected for subjects motion and Eddy currents using the FMRIB Software Library (FSL). [4] Non brain voxels were removed using FSL-BET. For each subject, the tensor model was then fitted on diffusion data using the FDT module of FSL. Fractional Anisotropy (FA) and Mean Diffusivity (MD) maps were extracted. Each subject FA was non-rigidly coregistered to the FA map of the IIT3 Atlas [5] using niftyReg software. [6] Finally, structural information obtained performing the tractography on the reference atlas were coupled with the diffusion signal of each patient. Image processing steps are illustrated in Figure 1.
Statistics
The FA and MD signal profiles obtained along each fiber-bundle were independently used to dis- criminate patients in the specific clinical form, using an unsupervised method for trajectory clus- tering based on classical k-means (KmL). [7] FA and MD signal profiles were also jointly used to discriminate patients in the specific clinical form, using a non-parametric algorithm for clustering joint trajectories (KmL3D). [8] Clustering performances were estimated by computing a score (χ) based on the fraction of patients attributed to each cluster (A and B). Considering HC versus RR-MS patients clustering, x is the number HC, y the number of RR-MS patients in the cluster A, z the number HC and w the number of RR-MS patients in the cluster B. The $$$\chi$$$ score is calculated with the following formula: $$$\chi=\sqrt{\left(\frac{x+w}{2}-\frac{y+z}{2}\right)^2}$$$.
Results
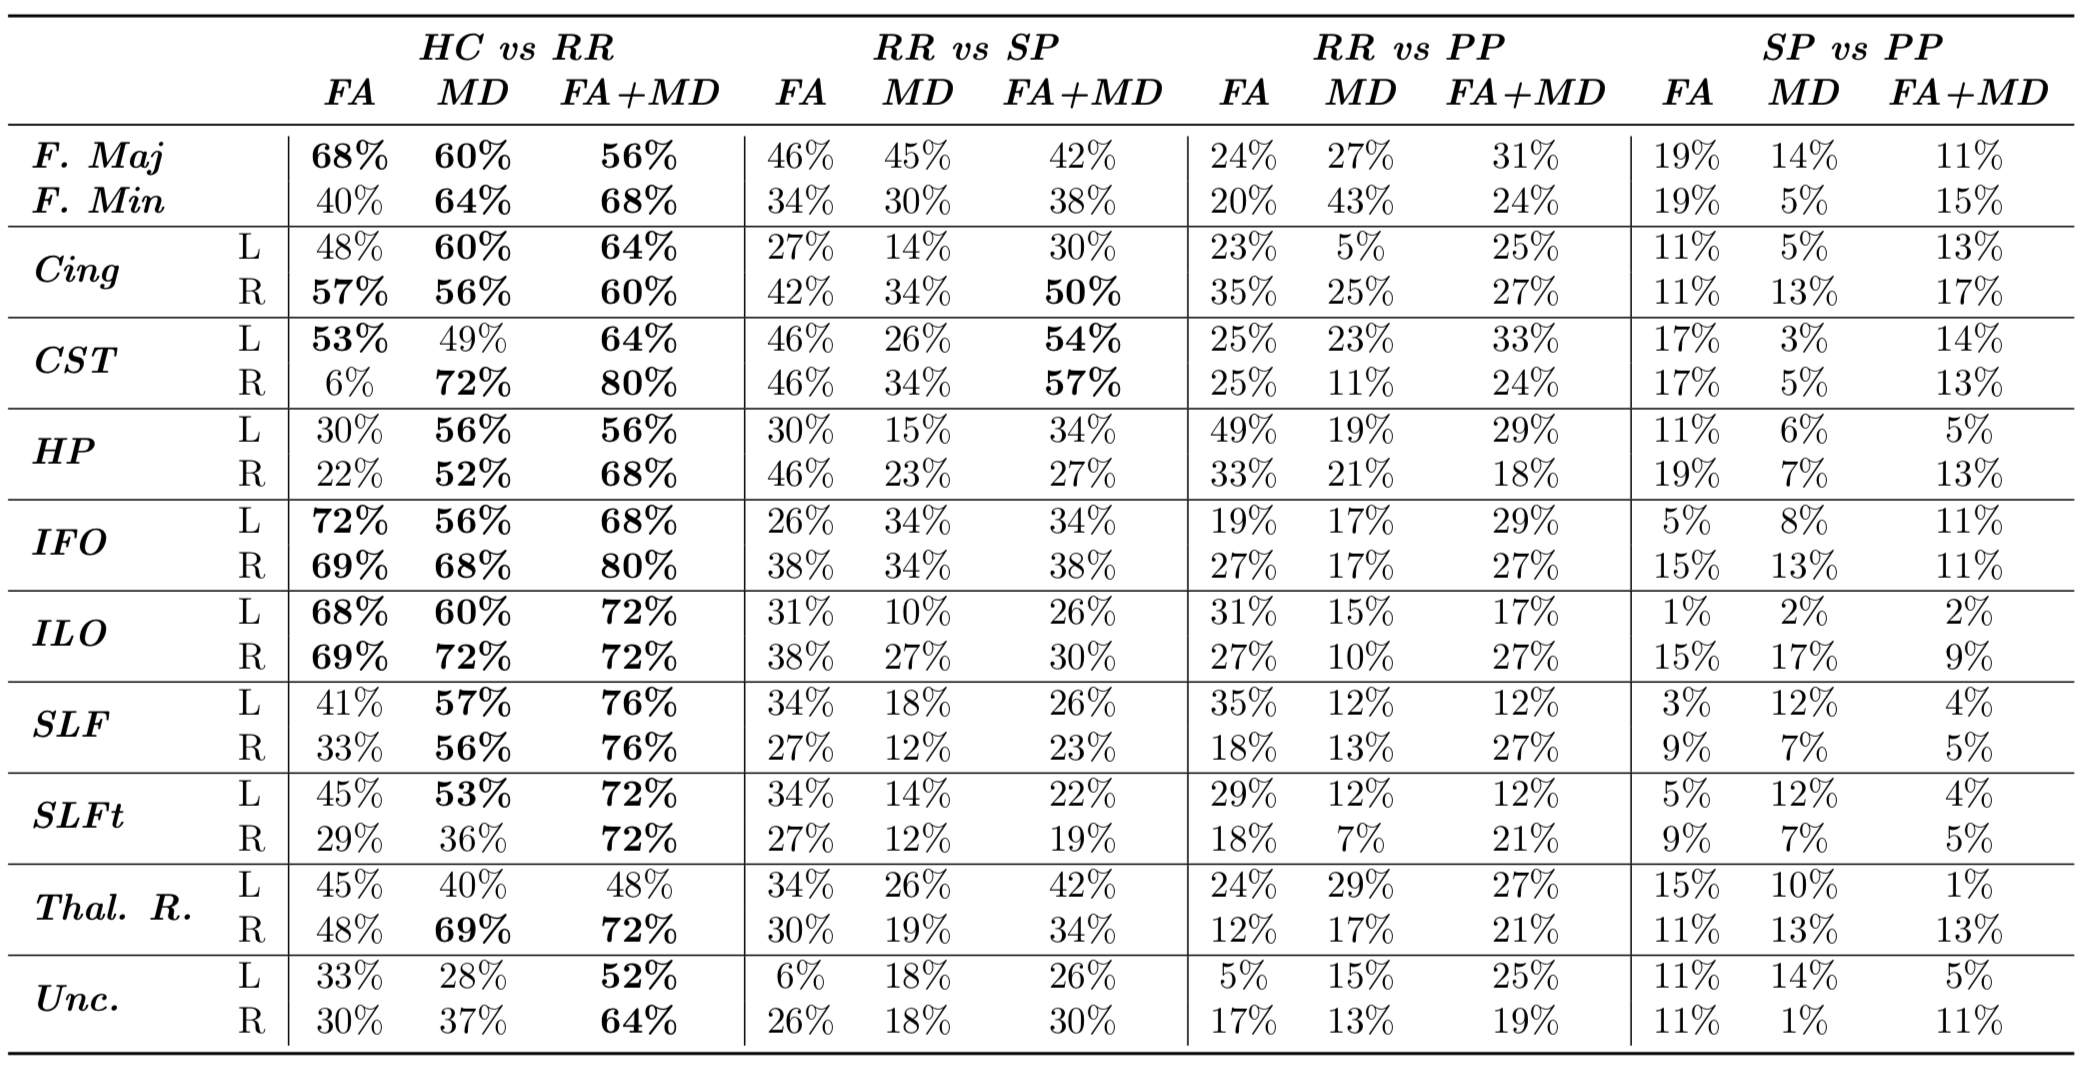
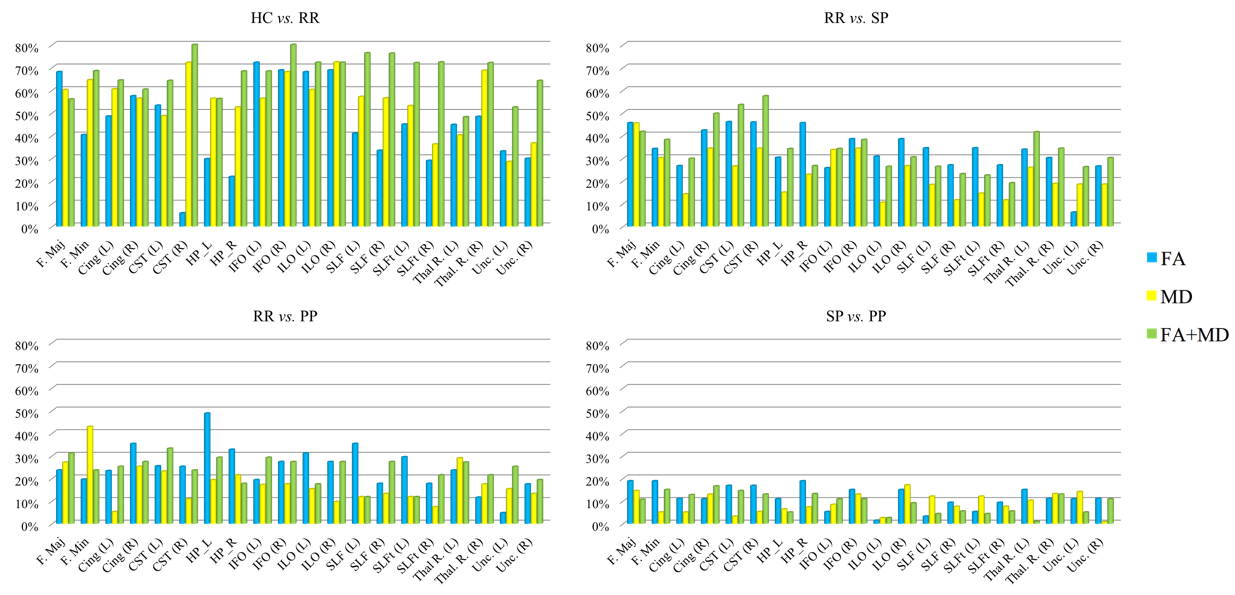
Clustering performances ($$$\chi$$$) are reported in Table 1. Figure 2 is composed of four bar graphs reflecting the performances for each clustering task. The top-left bar graph represents clustering performances when classifying controls versus RR-MS patients. The top-right bar graph represents RR-MS versus SP-MS patients clustering performances. The bottom-let bar graph represents RR-MS versus PP-MS patients clustering performances. The bottom-right bar graph represents SP-MS versus PP-MS patients clustering performances.
The clustering of HC versus RR-MS patients reached good performances for a large majority of the fiber-bundles. These performances are even higher when using FA and MD jointly, reaching a maximum of 80% with the right inferior fronto-occipital fascicle. When clustering RR-MS versus SP-MS patients, performances were acceptable when using FA and MD jointly in the left and right cortico-spinal tract and in the right cingulate fascicle. Finally, the clustering of RR-MS versus PP-MS patients and SP-MS versus PP-MS patients did not reach acceptable performances for any fiber-bundle.
Discussion - Conclusion
In this work, we proposed a method, based on fiber-profile analysis, to identify specific patterns capable to cluster each MS patient according to its clinical form. Fiber-bundle signal profile analysis proposed in [1] was applied to each patient. The obtained fiber-bundle signal profiles were then used to cluster each subject using KML. The main result of this study showed that the use of machine learning algorithms is suitable in environments where it is difficult to build a descriptive model like in MS disease. The good performances reached when classifying the two "following" clinical courses of MS, make our method a potential tool to better predict the conversion of RR-MS to SP-MS.Acknowledgements
This work was performed within the framework of the LABEX PRIMES (ANR-11-LABX-0063) of Université de Lyon, within the program "Investissements d'Avenir" (ANR-11-IDEX-0007) operated by the French National Research Agency (ANR).References
[1] C. Stamile, G. Kocevar, F. Cotton, F. Durand-Dubief, S. Hannoun, C. Frindel, C. R. Guttmann, D. Rousseau, and D. Sappey-Marinier, “A sensitive and automatic white matter fiber tracts model for longitudinal analysis of diffusion tensor images in multiple sclerosis,” PLoS ONE, vol. 11, no. 5, pp. 1–15, 2016.
[2] F. D. Lublin, S. C. Reingold, and P. Tiqwa, “Defining the clinical course of multiple sclerosis :,” Neurology, vol. 46, pp. 907–911, 1996.
[3] W. I. McDonald, A. Compston, G. Edan, D. Goodkin, H.-P. Hartung, F. D. Lublin, H. F. McFarland, D. W. Paty, C. H. Polman, S. C. Reingold, M. Sandberg-Wollheim, W. Sibley, A. Thompson, S. Van Den Noort, B. Y. Weinshenker, and J. S. Wolinsky, “Recommended diagnostic criteria for multiple sclerosis: Guidelines from the international panel on the diagnosis of multiple sclerosis,” Annals of Neurology, vol. 50, pp. 121–127, jul 2001.
[4] M. Jenkinson, C. F. Beckmann, T. E. Behrens, M. W. Woolrich, and S. M. Smith, “Fsl,” NeuroImage, vol. 62, no. 2, pp. 782–790, 2012.
[5] A. Varentsova, S. Zhang, and K. Arfanakis, “Development of a high angular resolution diffusion imaging human brain template,” NeuroImage, vol. 91, pp. 177–186, 2014.
[6] S. Ourselin, R. Stefanescu, and X. Pennec, “Robust Registration of Multi-modal Images: Towards Real-Time Clinical Applications,” in Lecture Notes in Computer Science, pp. 140–147, 2002.
[7] C. Genolini and B. Falissard, “Kml: A package to cluster longitudinal data,” Computer Methods and Programs in Biomedicine, vol. 104, pp. e112–e121, dec 2011.
[8] C. Genolini, J. B. Pingault, T. Driss, S. Cote, R. E. Tremblay, F. Vitaro, C. Arnaud, and B. Falissard, “KmL3D: A non-parametric algorithm for clustering joint trajectories,” Computer Methods and Programs in Biomedicine, vol. 109, no. 1, pp. 104–111, 2013.
Figures