1992
Gray Matter Atrophy and Microstructural White Matter Abnormalities Underlying Cognitive Impairment in Benign MSElisabetta Pagani1, Gianna Carla Riccitelli1, Marta Radaelli2, Paolo Preziosa1,2, Giancarlo Comi2, Andrea Falini3, Massimo Filippi1,2, and Maria A. Rocca1,2
1Neuroimaging Research Unit, INSPE, Division of Neuroscience, San Raffaele Scientific Institute, Vita-Salute San Raffaele University, Milan, Italy, 2Department of Neurology, San Raffaele Scientific Institute, Vita-Salute San Raffaele University, Milan, Italy, 3Department of Neuroradiology, San Raffaele Scientific Institute, Vita-Salute San Raffaele University, Milan, Italy
Synopsis
The definition of benign multiple sclerosis (BMS) is based on long disease duration and low level of disability, without considering cognitive deficits. Aim of the study was to apply voxel-wise methods to investigate whether cognitive dysfunction in BMS patients is associated with specific patterns of regional damage in the brain gray matter (GM) and white matter (WM). High-resolution T1-weighted and diffusion tensor MRI scans were acquired from 50 healthy controls and 38 BMS patients, 42% of which were classified as cognitively impaired. Distinct regional patterns of abnormalities, functionally relevant for cognitive processing, were associated with cognitive impairment in BMS patients.
Background
The definition of benign multiple sclerosis (BMS) is based on the long disease duration and low level of disability of subjects, without taking into consideration other features, such as cognitive deficits. Purpose. To apply voxel-wise methods to investigate whether cognitive dysfunction in BMS patients is associated with specific patterns of regional damage in the brain gray matter (GM) and white matter (WM).Methods
Using a 3.0 Tesla scanner, high-resolution 3D T1-weighted, diffusion tensor (DT) and dual-echo images were acquired from 38 BMS patients (Expanded Disability Status Scale score < 3.0 and disease duration >15 years) and 50 matched healthy subjects (HC). All patients underwent neuropsychological assessment through the Rao Brief Repeatable battery. Patients with abnormal scores (z-score>2) in at least 2 tests were considered as cognitively impaired (CI). Regional GM atrophy was estimated using a voxel-based morphometry analysis (1), while WM microstructural abnormalities were investigated with Tract Based Spatial Statistics (TBSS) analysis (2).Results
Sixteen (42%) BMS were classified as CI. Compared to HC, cognitive preserved (CP) BMS patients had significant GM atrophy of the thalami, left precuneus and left middle cingulate gyrus. Additional areas of GM atrophy in CI patients were found in the anterior and posterior cingulate gyrus, left caudate nucleus, and right precentral gyrus (Figure 1). Compared to HC, CP and CI BMS patients had decreased fractional anisotropy (FA) of supratentorial and infratentorial WM tracts and increased mean (MD), axial (AD) and radial (RD) diffusivity of the main supratentorial WM tracts. CI patients had additional increased MD and RD of several infratentorial regions located in the cerebellum and brainstem (Figure 2). No area was more affected in CP vs CI BMS patients.Conclusions
Distinct regional patterns of GM atrophy and WM microstructural abnormalities, functionally relevant for cognitive processing, are associated with CI in MS patients with a benign course. These findings support the need for a new clinical definition of BMS, including cognitive features.Acknowledgements
Partially supported by Fondazione Italiana Sclerosi Multiple (FISM2013/S/1).References
1) Ashburner J. Computational anatomy with the SPM software. Magn Reson Imaging. 2009;27(8):1163-74. 2) Smith SM, Jenkinson M, Johansen-Berg H, et al. Tract-based spatial statistics: Voxelwise analysis of multi-subject diffusion data. NeuroImage, 2006;31:1487-1505.Figures
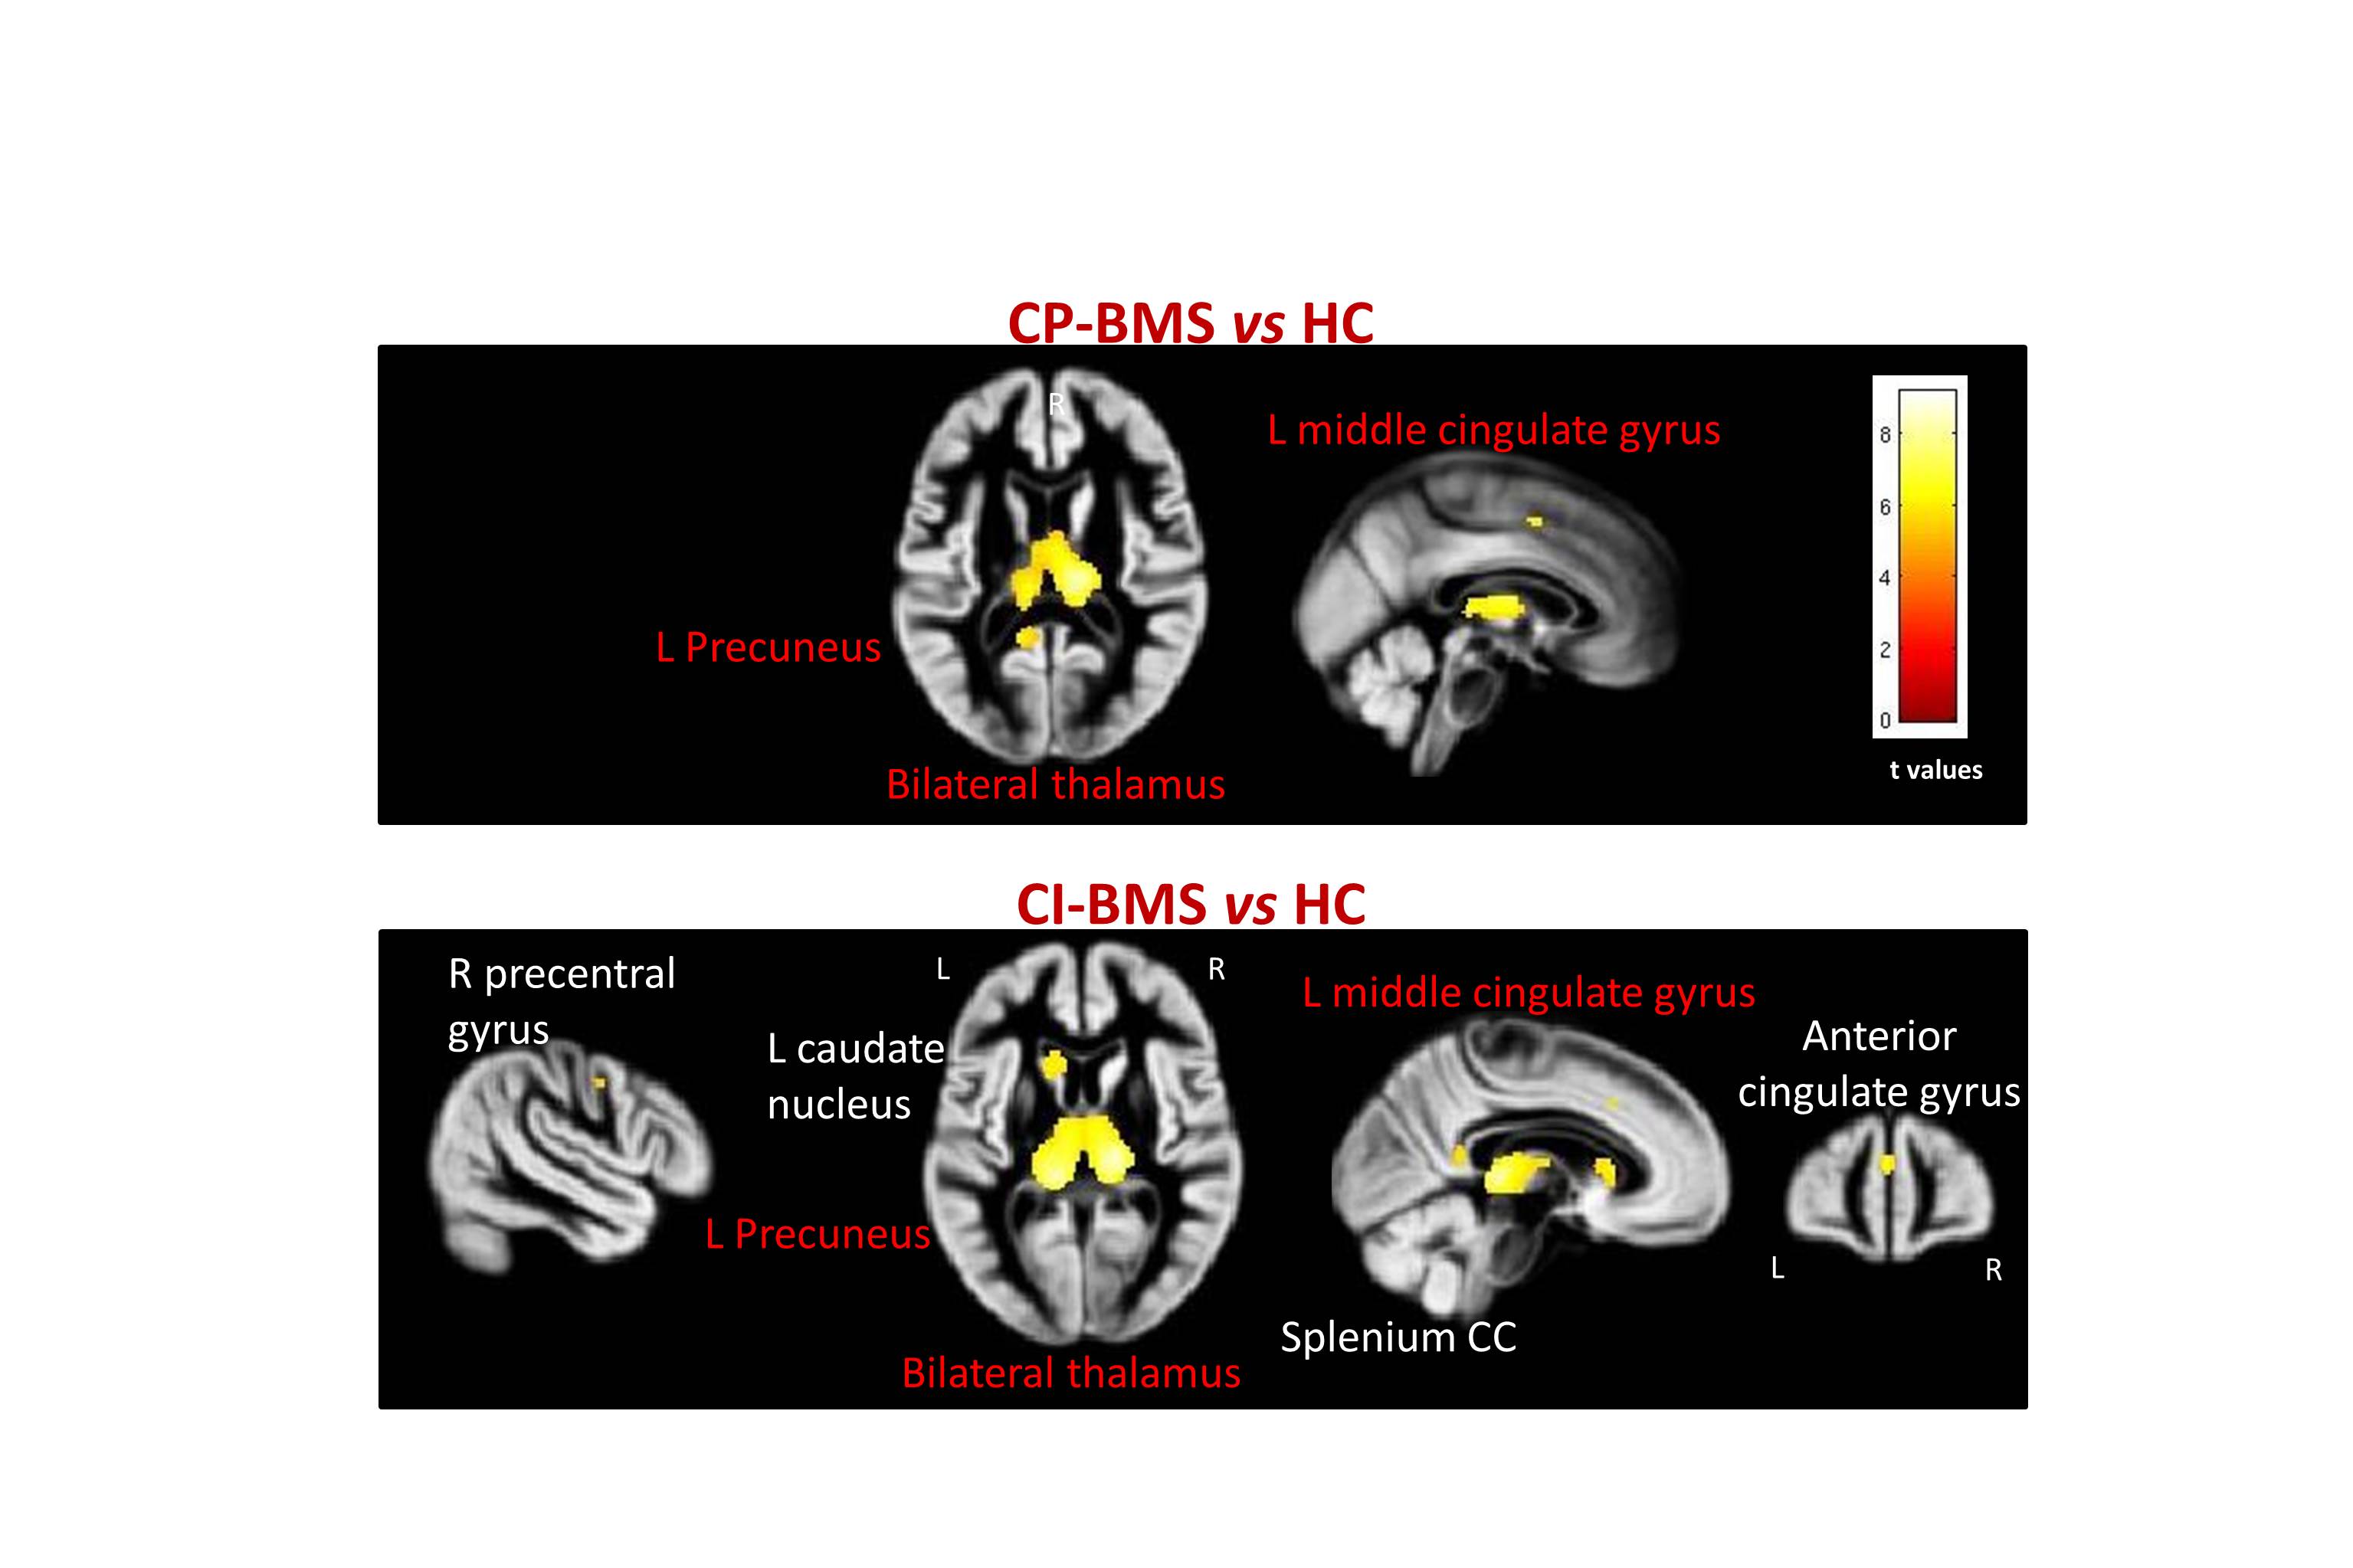
Figure 1. Voxel Based Morphometry results. In yellow, voxels of the GM with
significantly decreased volume in CP-BMS (upper row) and CI-BMS patients (lower
row) in comparison with HCs. The name of GM regions atrophied in both CP and
CI-BMS patients is written in red.
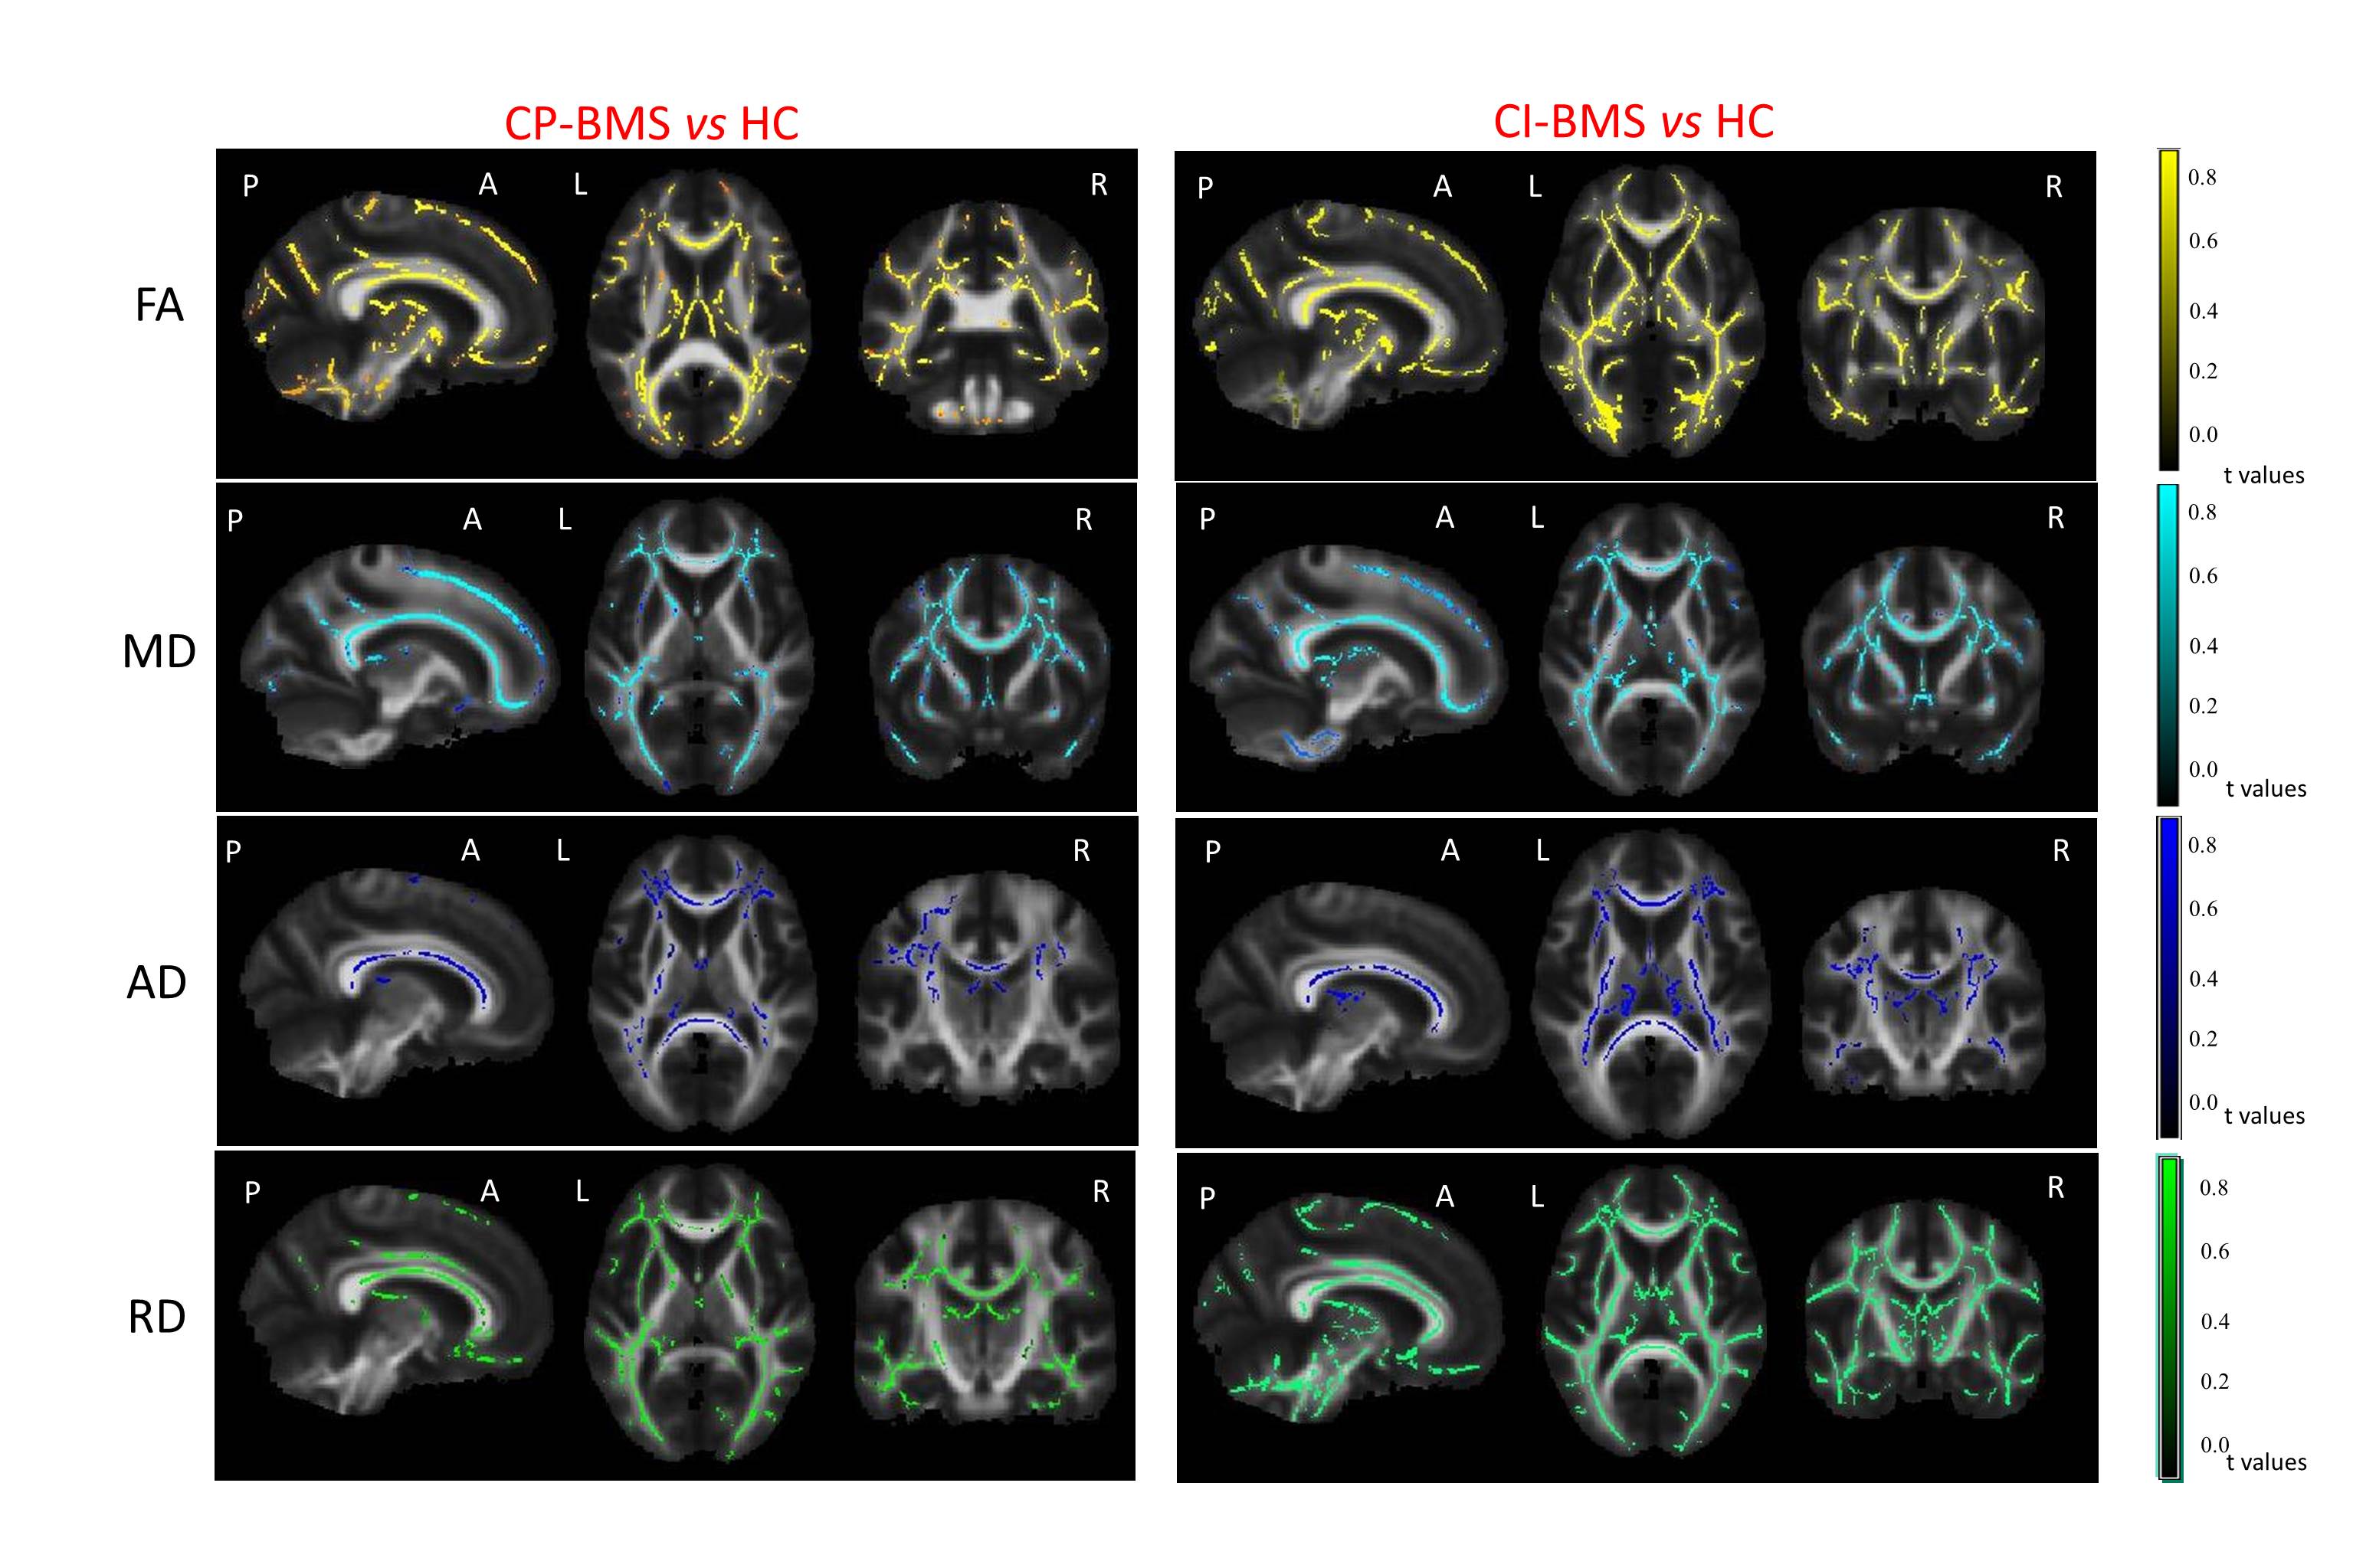
Figure 2. TBSS results. In color,
voxels of the WM skeleton where FA, MD, AD and RD indices were found significantly different in the
comparison CP-BMS
vs HC (left) and CI-BMS vs HC (right).