1991
Multiple Sclerosis Gray Matter Shows Greater Abnormalities in Phosphate Metabolites than White Matter1Advanced Imaging Research Center, Oregon Health & Science University, Portland, OR, United States, 2The Warren Alpert Medical School, Brown University, Providence, RI, United States, 3Department of Neurology, Oregon Health & Science University, Portland, OR, United States, 4MS Center of Excellence West, VA Portland Health Care System, Portland, OR, United States
Synopsis
Phosphate metabolite distribution in gray matter and white matter in human brain is compared between healthy control (HC) and subjects with Multiple Sclerosis (MS) using 31P Magnetic Resonance Spectroscopic Imaging (MRSI) at 7T. Phosphate metabolites are decreased in GM in MS compared to healthy controls.
Introduction
Neurodegeneration is an early disease feature and contributor to clinical disability in Multiple Sclerosis1-3. It has been linked to mitochondrial dysfunction and perturbed metabolism4,5. This study investigates -with one of the largest number of subjects- phosphate metabolites levels in gray and white matter tissues in Multiple Sclerosis by using 31P MR spectroscopy and imaging (MRSI) at 7T . It may have potential applications as a biomarker for monitoring disease progression and treatment.Methods
Twenty seven healthy control subjects (age range: 24-82 years, 17 females and 10 males) and forty nine subjects with multiple sclerosis (age range: 28-68 years, 35 females, 14 males) were recruited and enrolled in IRB approved protocols between years 2009 and 2016. There were 3 primary progressive MS (PPMS, 1M/1F), 8 secondary progressive MS (SPMS, 3M/5F) and 39 relapsing remitting MS (RRMS, 10M/29F) subjects in MS cohort.
MR data acquisition was performed on a whole-body 7T Siemens MAGNETOM system using singly-tuned RF coils6. Anatomic MPRAGE images [TR/TI/FA: 2.30 s/1.05 s/ 6°, 0.8 mm3, TA = 10.8 min] were acquired using 8-or 24-channel RF array head coil. A modified quadrature transmit/receive 31P coil, (Siemens, Erlangen, Germany) and integrated with a home-built proton loop coil for acquiring scout images, referred to as a “1Halo” coil7, was used for 31P MRSI acquisition.
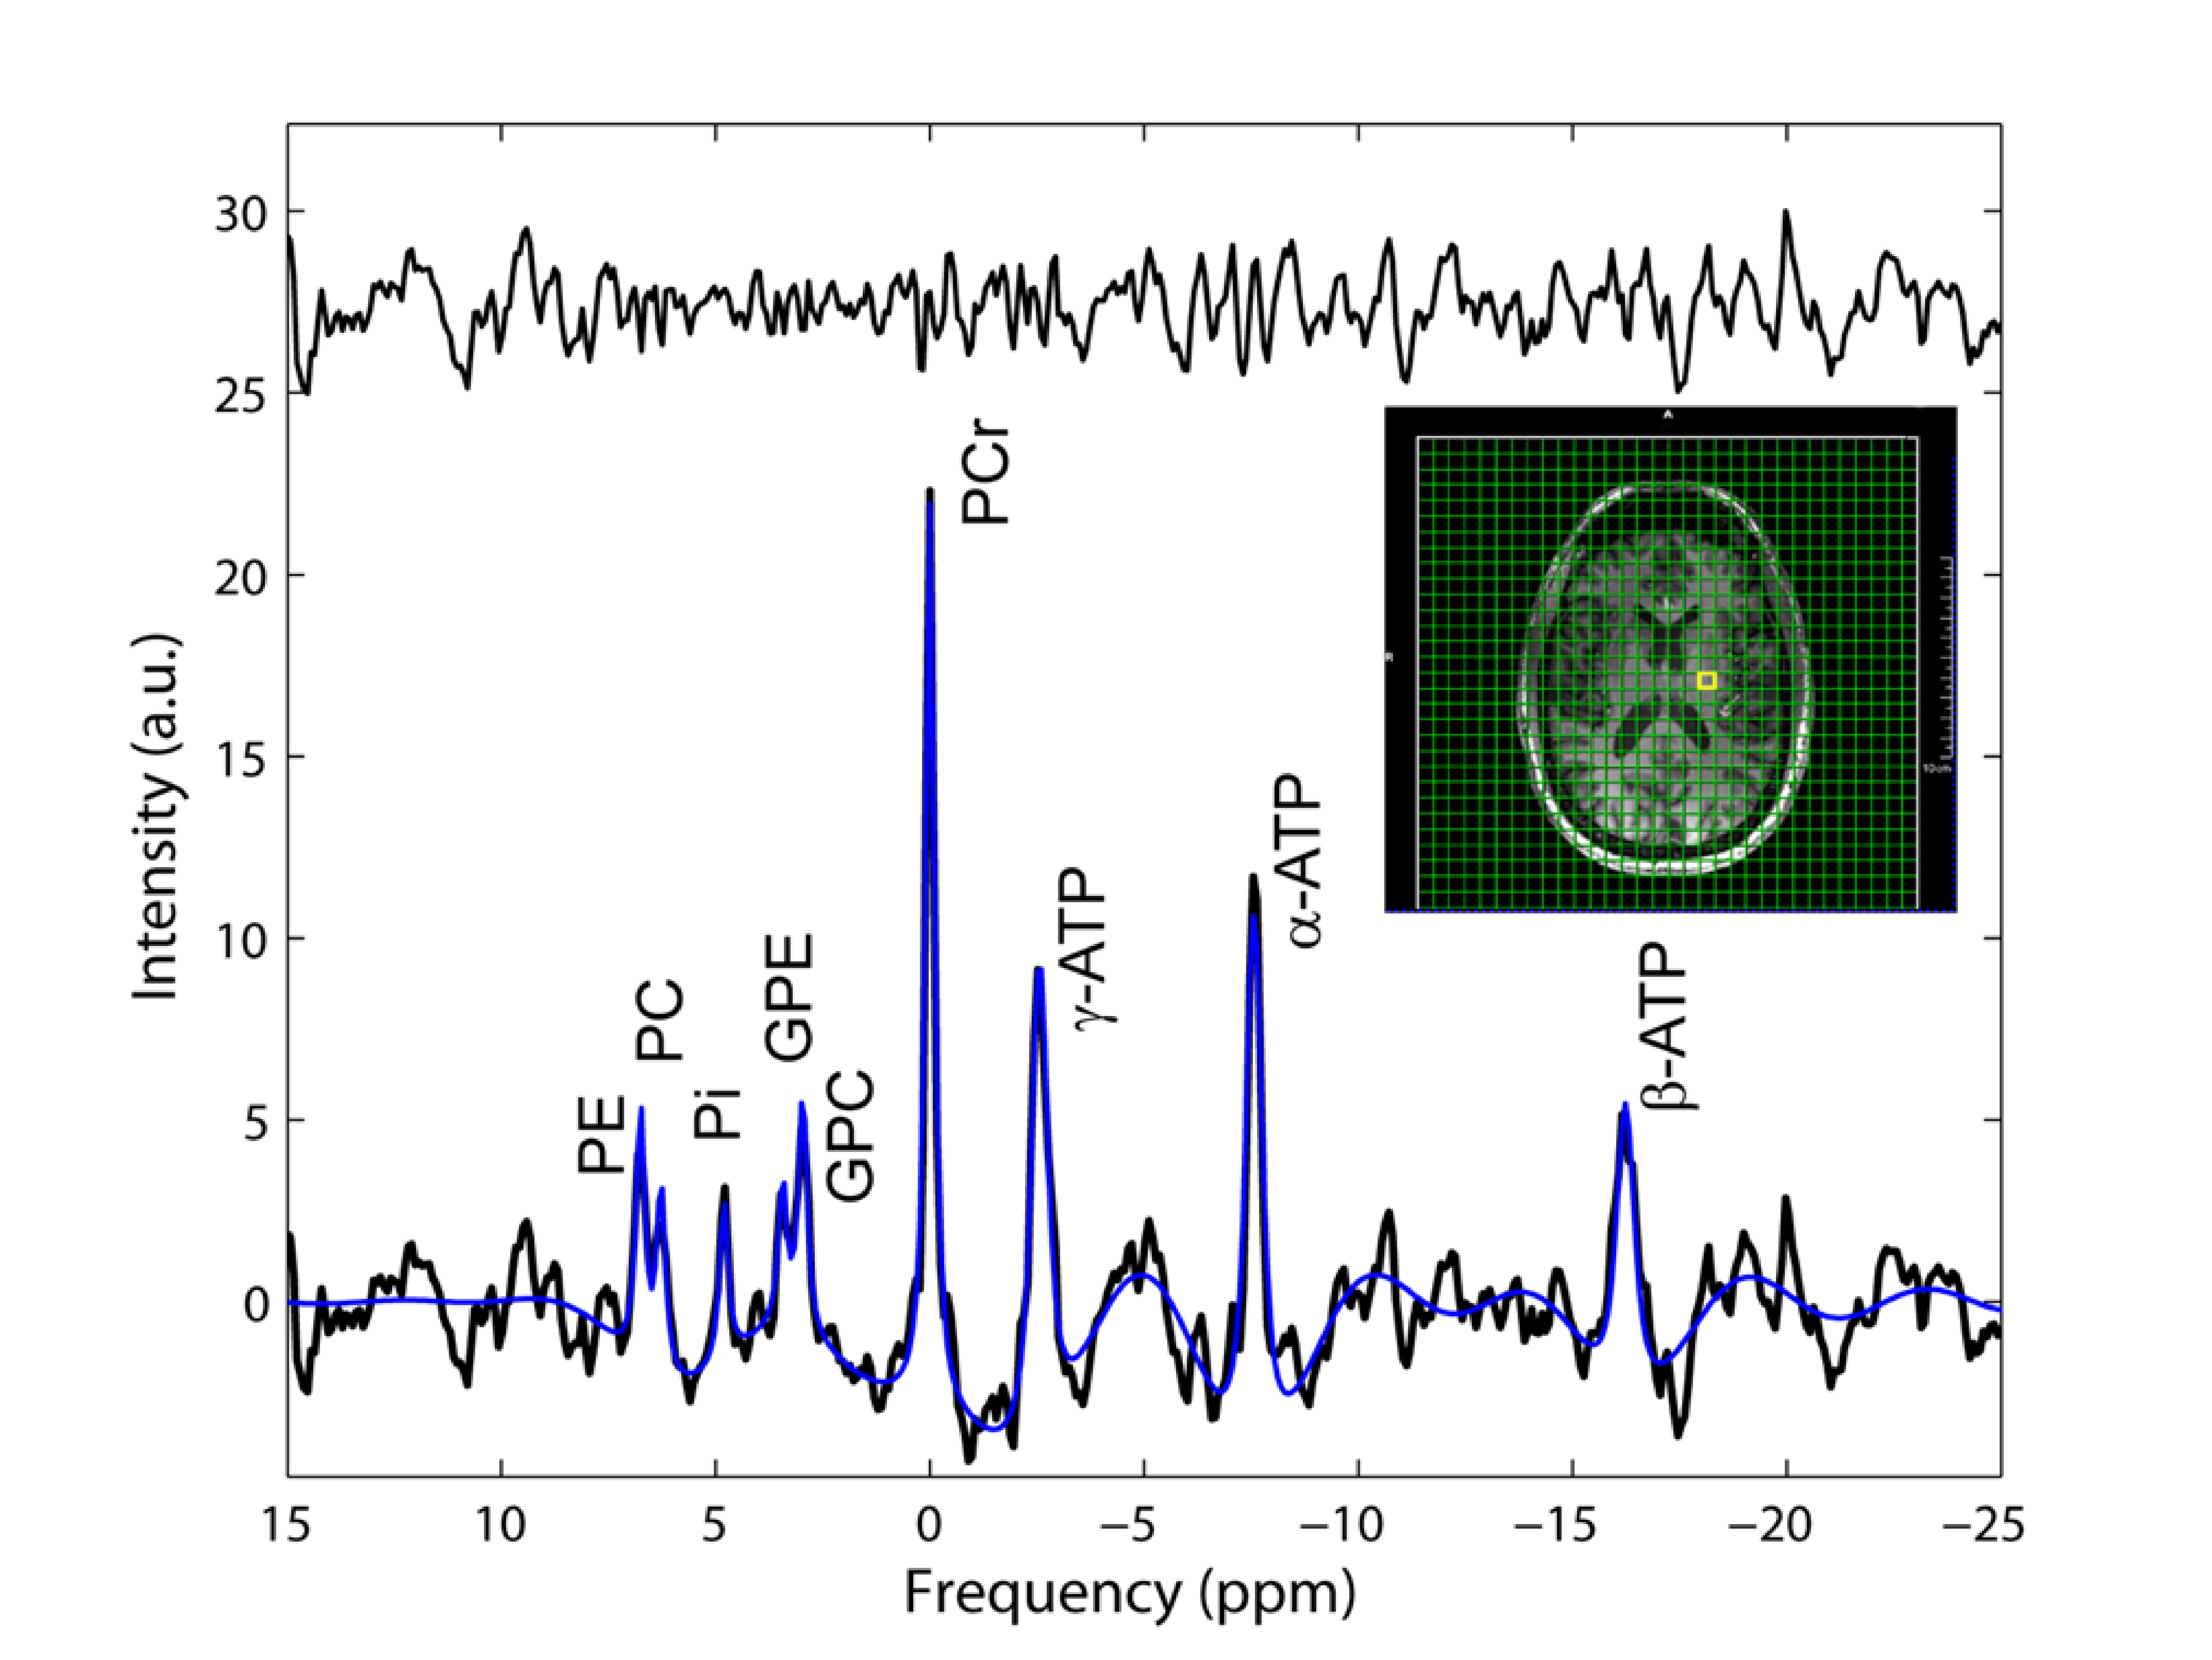
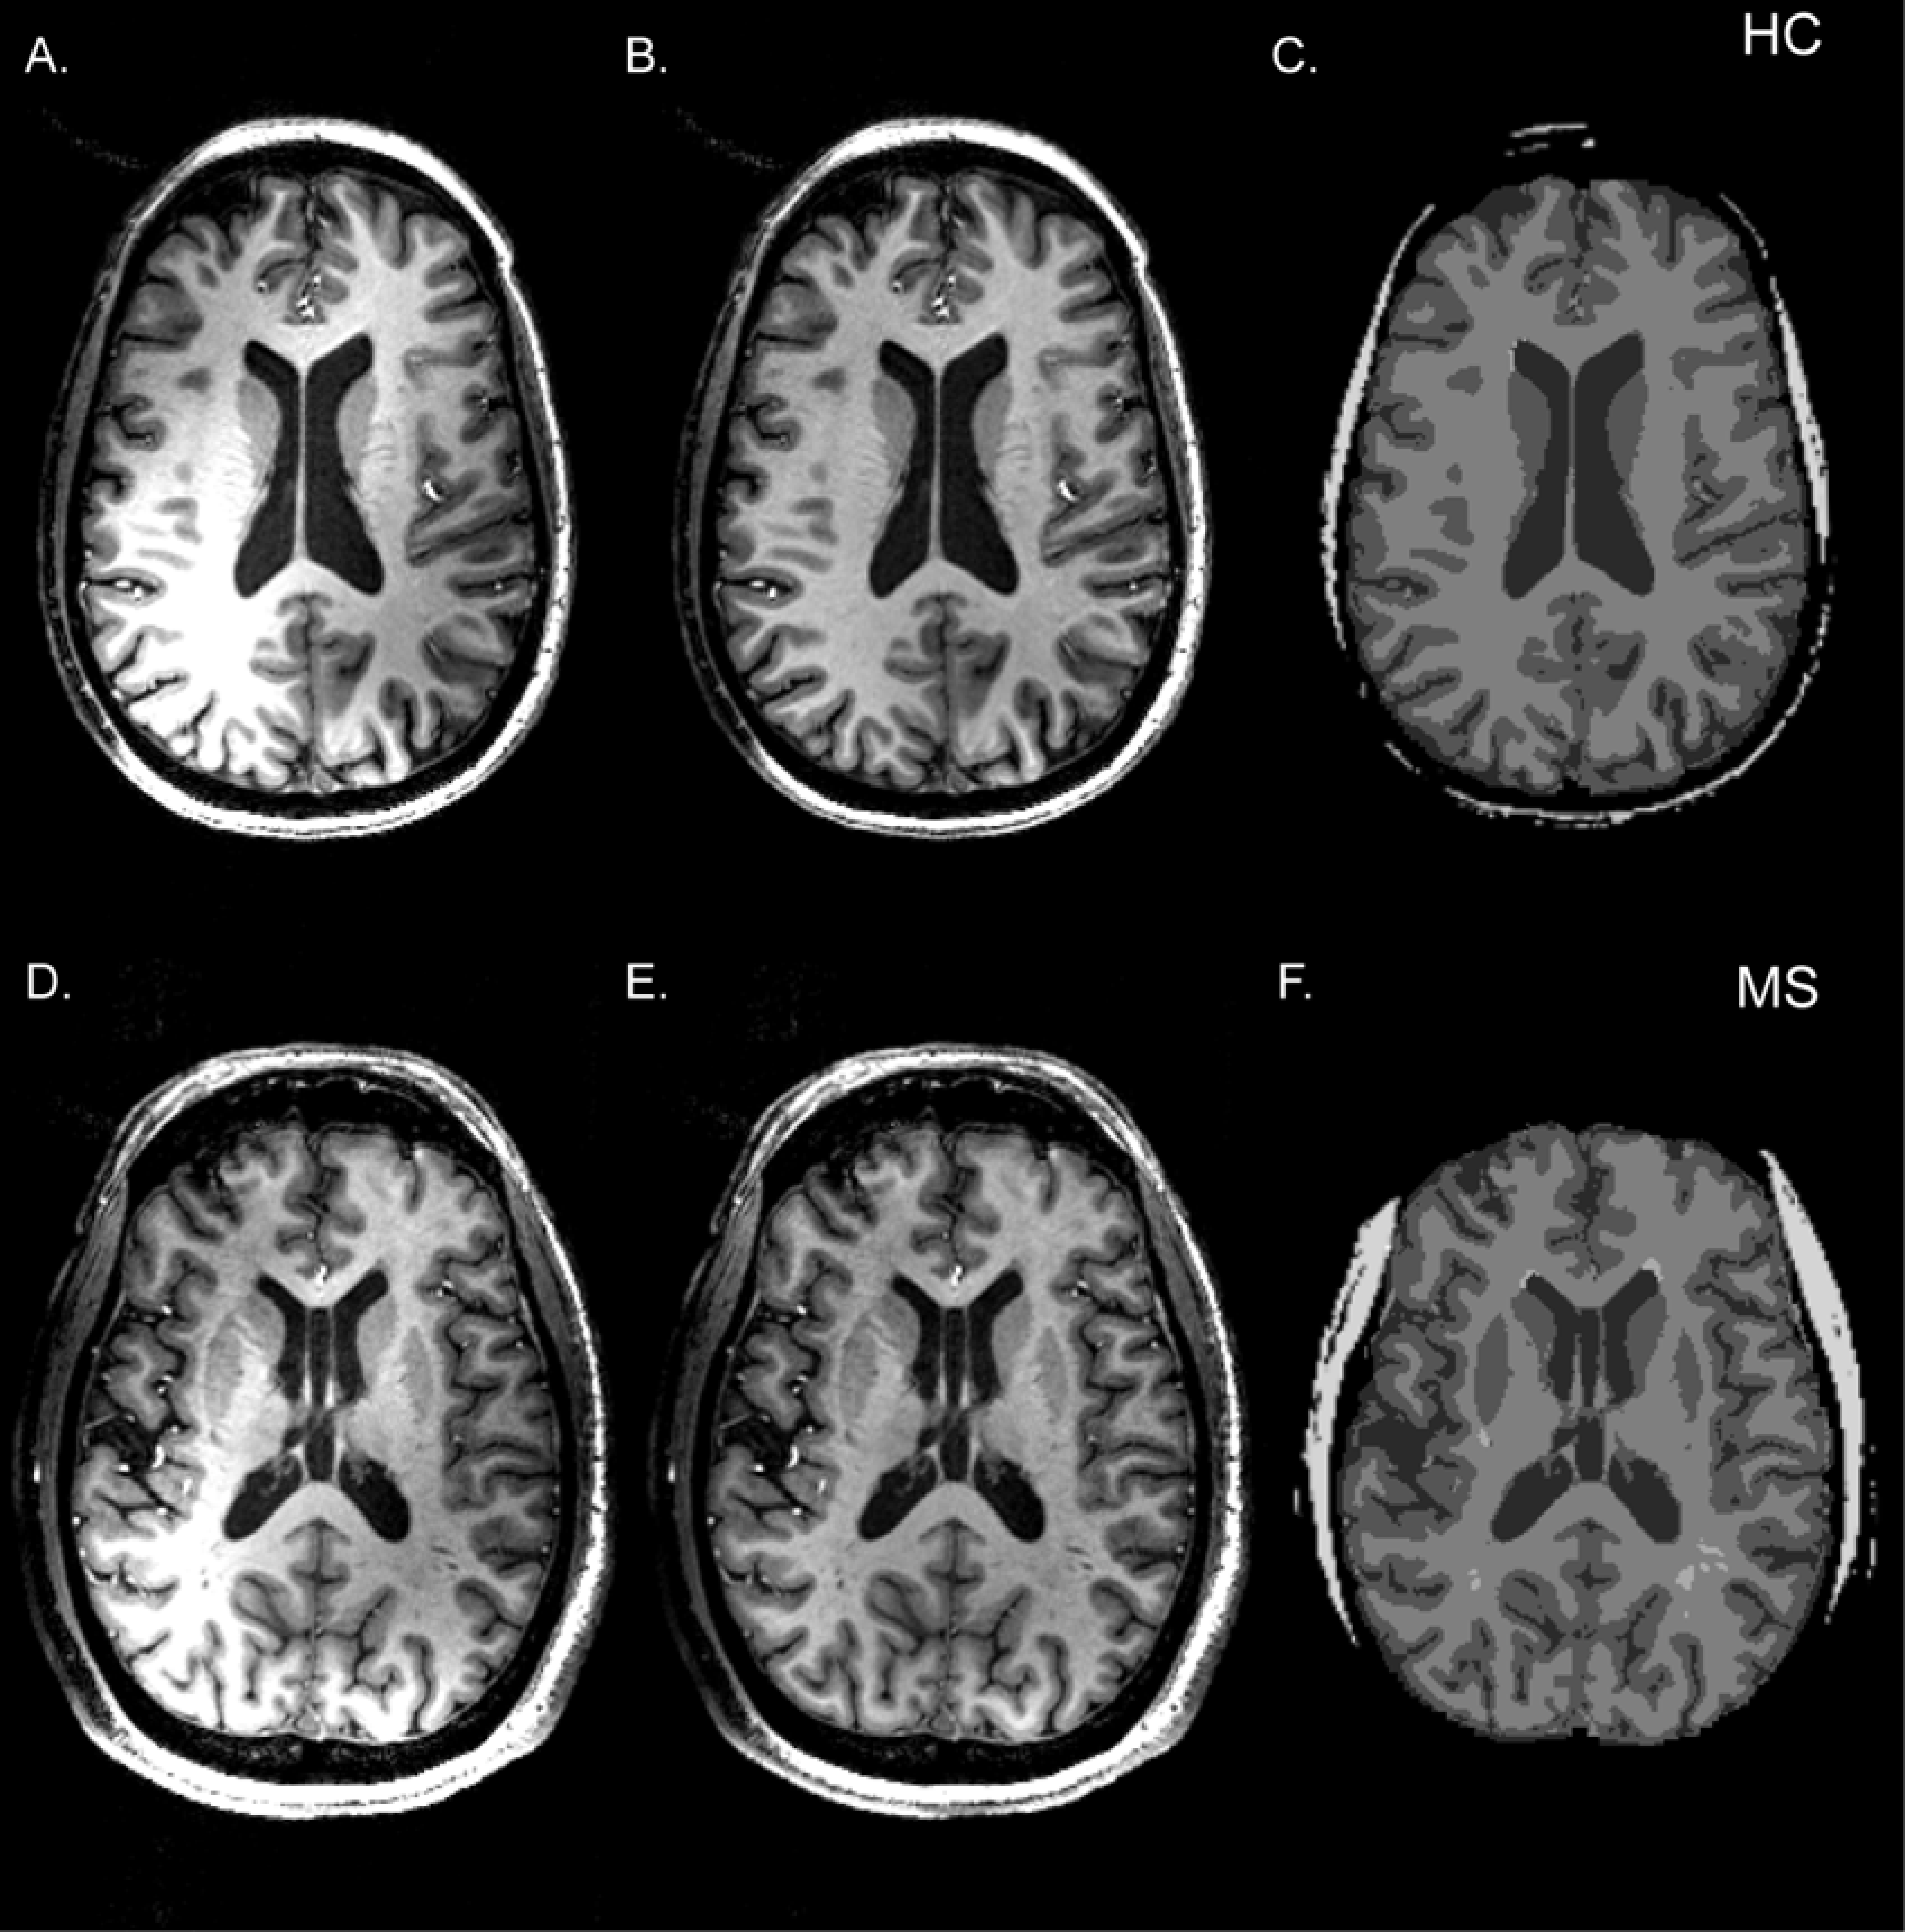
A 3D 31P MRSI FID acquisition, with gradient echo spatial encoding, [TR/TE/FA/PD: 300 ms/2.3 ms/24°/600 µs, np = 1024, SW = 10 kHz, resonance frequency and chemical shift centered at phosphocreatine (PCr) peak, FOV: (250 mm)2x200 mm, data matrix: 20 x 20 x 16, reconstruction data matrix: 32 x 32 x 16] and 3D cosine-weighted spatial phase encoding was performed (2379 unique k‑space locations, ns = 12, total 7476) to minimize the acquisition time (37.5 minutes). Nominal voxel volume was 1.95 mL for this acquisition. Software routines developed in Matlab were used to create input files for batch processing and analyzing spectroscopy data using jMRUI software (AMARES routine8) (Figure 1). High spatial resolution T1-w MPRAGE images were segmented into GM (gray matter), WM (white matter), CSF (cerebrospinal), and SM (skeleton muscle) using SPM129. FIRST routine was used to define GM subcortical brain structures10. WM lesions were identified using MPRAGE and/or FLAIR image sets (Figure 2). Scout to MPRAGE transformation matrix was used to co-register (FLIRT11) segmented tissue images to 31P spectroscopic data.
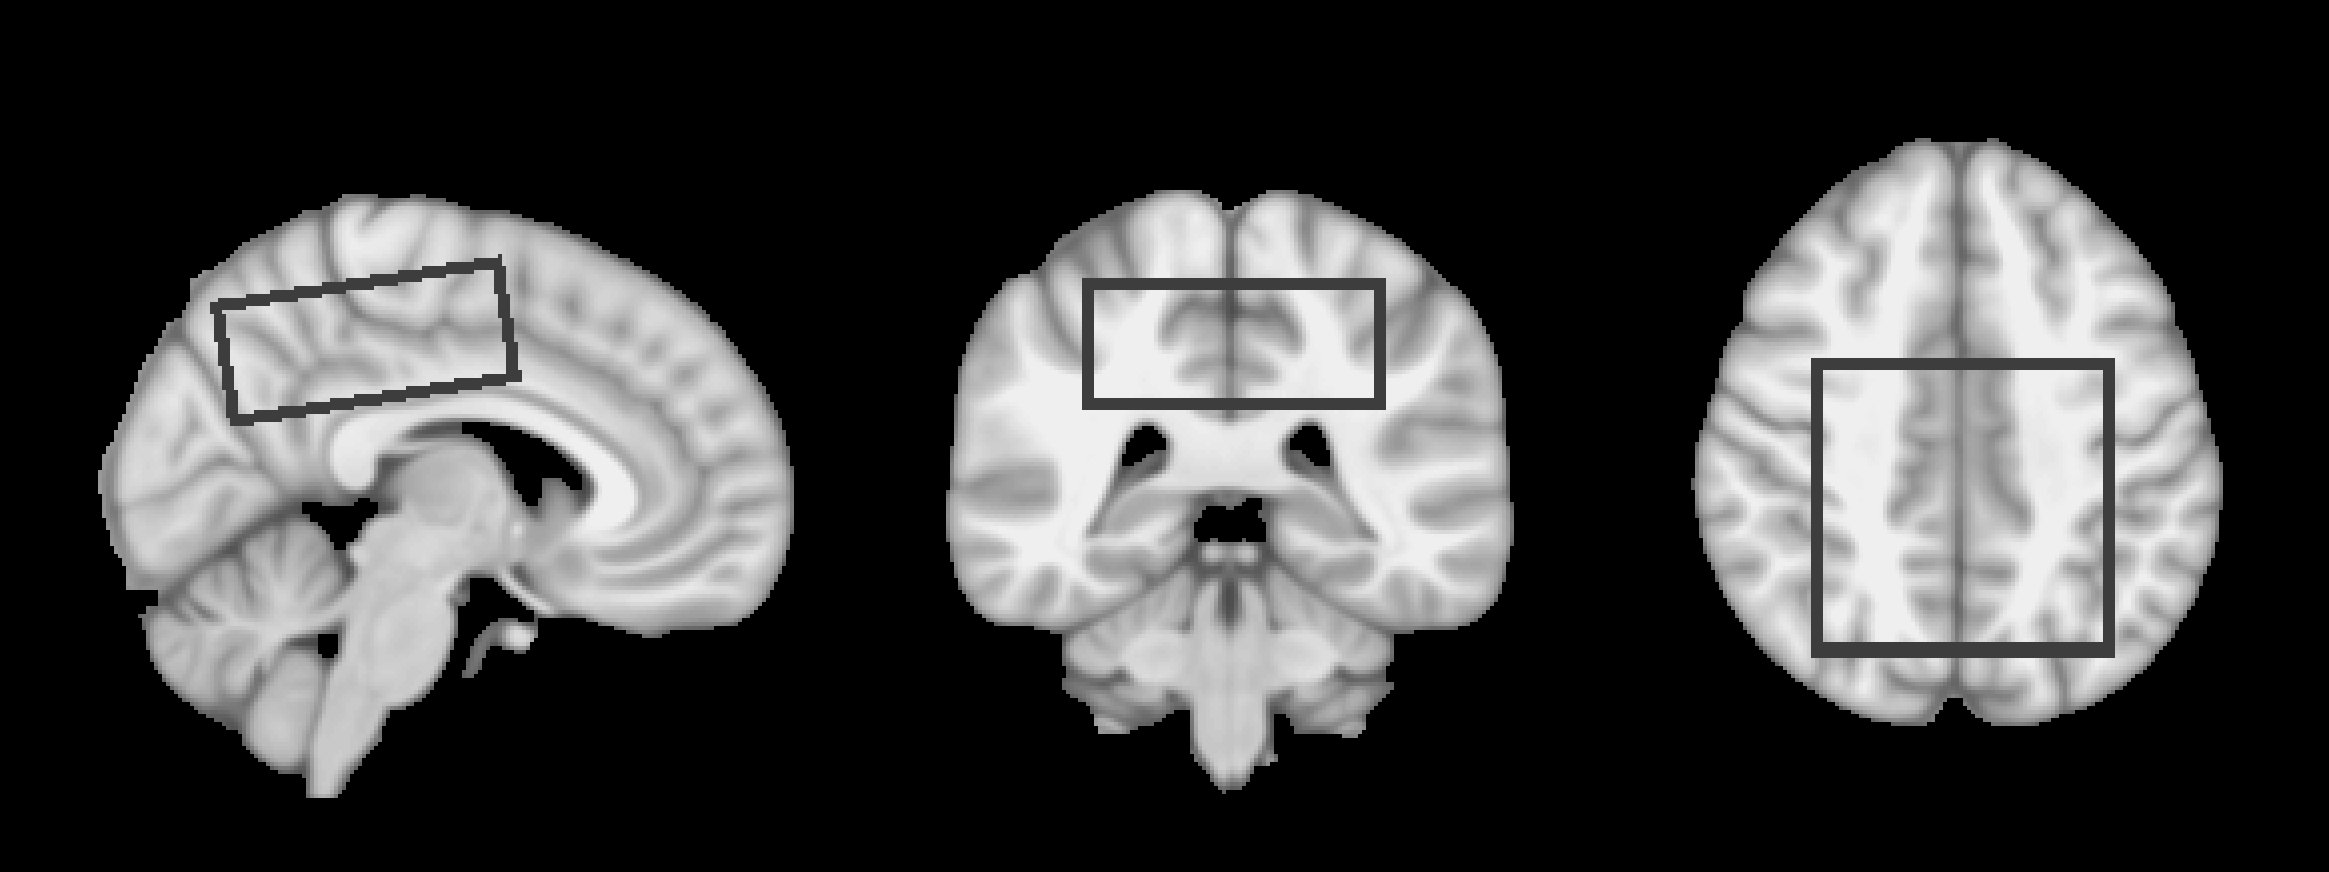
A volume of interest (VOI; 160 mL) in supratentorial brain region superior to the ventricles was defined in the brain atlas (Figure 3) and transformed to each subject’s brain, selecting same brain volume without any significant B1- and B0–inhomogeneity effects. Linear mixed-effect regression models were constructed to estimate phosphate signals within pure tissue types for each subject and fitted using restricted maximum likelihood (Linear and Nonlinear Mixed Effects Models library in R12,13). These models included terms for group membership, tissue class, and their interactions as well as subject specific random errors (εSubject) as shown in Equation:
SMetabolite = GM + WM + Group + GM*Group + WM*Group + εSubject +εrandom
The estimated metabolite peak amplitudes for the pure tissue classes from the remaining models were then compared for group differences using t-tests. A separate regression analysis for signal ratios (metabolite/Total 31P signal) was also modeled for a comparison.
Results
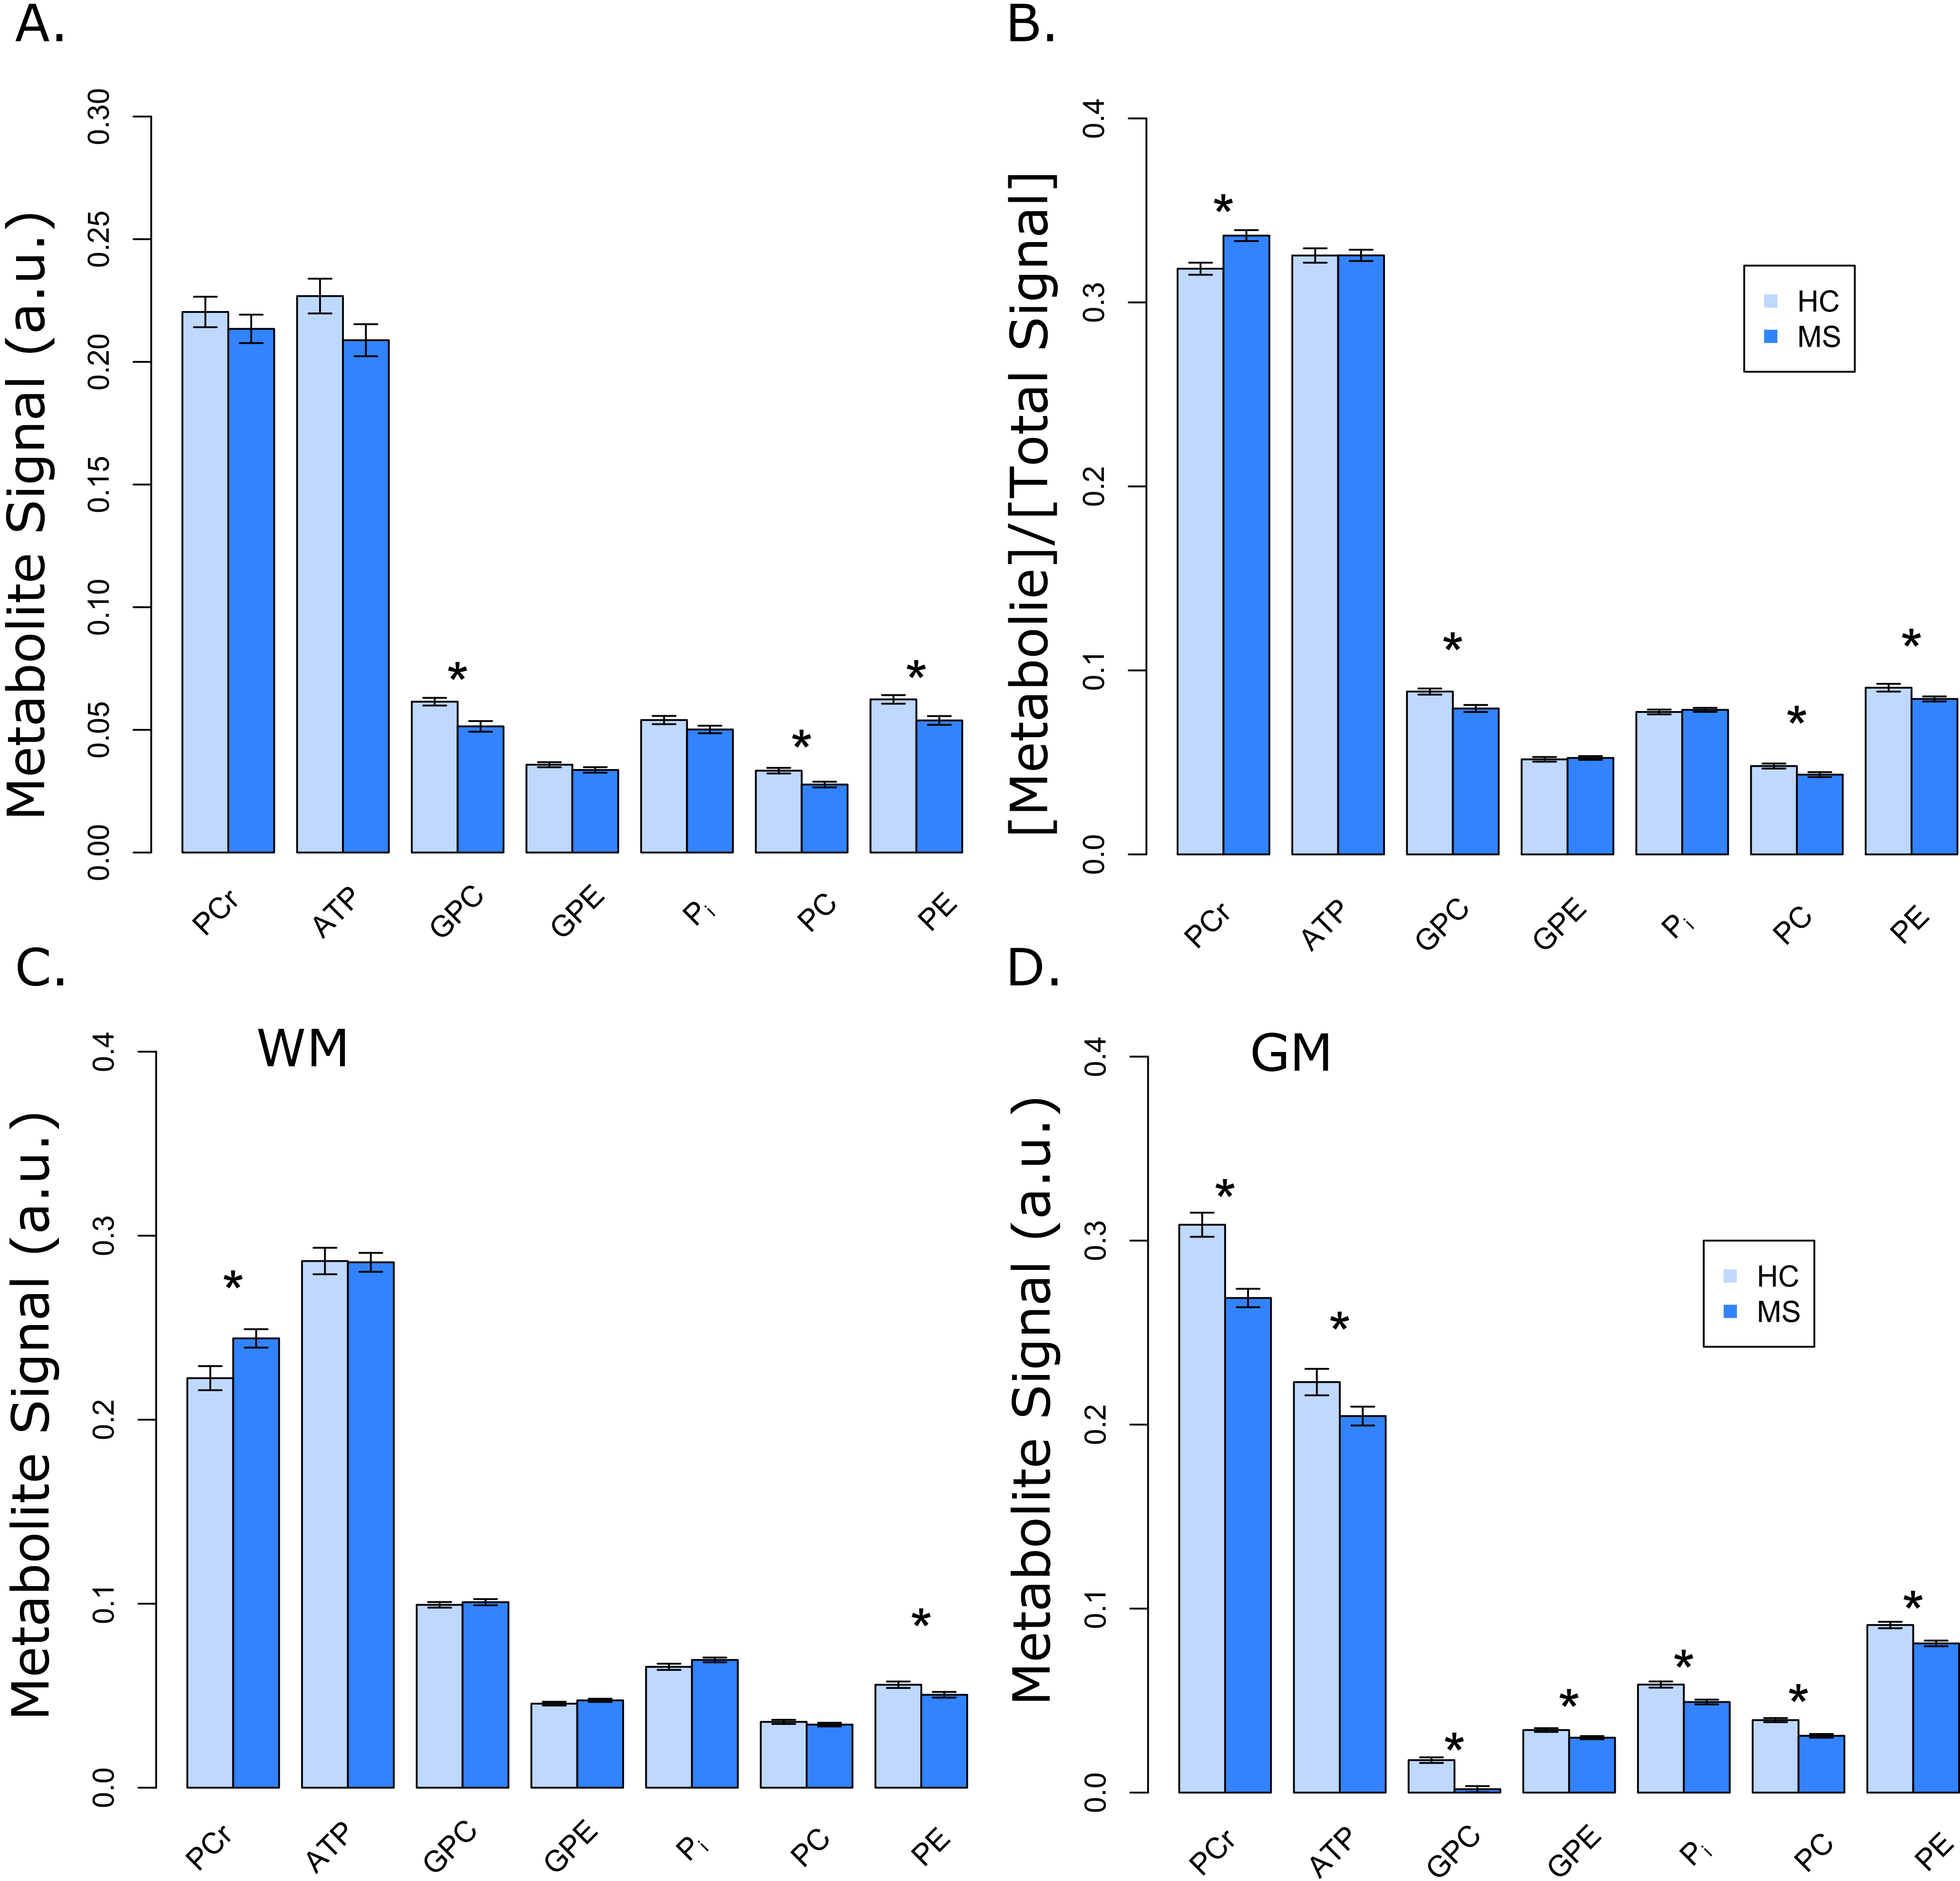
Robust fit were obtained for PCr, ATP, Pi, phosphoethanolamine (PE) and phosphocholine (PC), glycerol-3-phosphoethanolamine (GPE) and Glycerol-3-phosphocholine (GPC) peaks as shown in Figure 1 (blue line). Absolute 31P metabolite signals from VOI as a function of subject group shows no significant changes in PCr and ATP (Figure 4A). When these were expressed as percentage of total phosphate signal in the voxel (Total 31P = PCr+ATP+GPC+GPE+PC+PE+Pi peak amplitudes), there was significant change in PCr (+6%), GPC (-10%), PC (-10%) and PE (-7%) signals (Figure 4B). There were no significant differences for both pH (7.00 ± 0.05 and 7.00 ± 0.07 in HC and MS, respectively) and magnesium ion concentration (reported as pMg, 3.75 ± 0.07 and 3.74 ± 0.10 in HC and MS, respectively) in the two groups. A tissue dependent mixed-effect regression analysis showed significant decrease in PCr (‑13%), ATP (-8%), PC (-22%) PE (-11%), GPC (-90%), GPE (-12%) and Pi (-16%) in GM while PCr (10%) shows an increase and PE (-10%) a decrease in WM (Figure 4C and 4D).Discussion
Phosphate metabolites are altered in subjects with MS compared to controls and this perturbation is stronger in GM compared to WM. Reduced levels of phosphate metabolites could identify GM at-risk for neurodegeneration. Additional studies that investigate phosphate kinetics can shed more light on the compromised metabolic fluxes.Conclusion
Phosphate metabolites are predominantly lost in GM compared to WM, consistent with patterns of tissue loss in MS.Acknowledgements
Grant support: NMSS CA 1055A3, NIH R01-NS04801, NIH/NCRR 3UL1RR024140-04S1, Oregon Opportunity, Race to Erase MS, Laura FundReferences
1. Fisher E, Lee J, Nakamura K, Rudick RA. Gray matter atrophy in multiple sclerosis: A longitudinal study. Ann Neurol 2008; 64: 255-265.
2. Roosendaal SD, Bendfeldt K, Vrenken H, Polman CH, Borgwardt S, Radue EW, Kappos L, Pelletier D, Hauser SL, Matthews PM, Barkhof F, Geurts JJ. Grey matter volume in a large cohort of MS patients: relation to MRI parameters and disability. Mult Scler 2011; 17: 1098-1106.
3. Paolillo A, Pozzilli C, Gasperini C, Giugni E, Mainero C, Giuliani S, Tomassini V, Millefiorini E, Bastianello S. Brain atrophy in relapsing-remitting multiple sclerosis: relationship with 'black holes', disease duration and clinical disability. J Neurol Sci 2000; 174: 85-91.
4. Beal MF. Mitochondria take center stage in aging and neurodegeneration. Ann Neurol 2005; 58: 495-505.
5. Lin MT, Beal MF. Mitochondrial dysfunction and oxidative stress in neurodegenerative diseases. Nature 2006; 443: 787-795.
6. Sammi MK, Berlow Y, Barbara TM, Grinstead J, Bourdette D, Rooney WD. 31P Magnetic Resonance Spectroscopy and Imaging at 7T and signal dependence on Brain Tissue. Proc Int Soc Magn Reson Med 2010; 18: 3375.
7. Barbara TM, Sammi MK, Rooney WD, Grinstead J. A 7T Halo Loop Resonator for Registration of 31P MRSI. Proc Int Soc Magn Reson Med 2011; 19: 1896.
8. Vanhamme L, van den Boogaart A, Van Huffel S. Improved Method for Accurate and Efficient Quantification of MRS Data with Use of Prior Knowledge. Journal of Magnetic Resonance 1997; 129: 35-43.
9. Ashburner J, Friston KJ. Unified segmentation. Neuroimage 2005; 26: 839-851.
10. Patenaude B, Smith SM, Kennedy DN, Jenkinson M. A Bayesian model of shape and appearance for subcortical brain segmentation. Neuroimage 2011; 56: 907-922.
11. Jenkinson M, Bannister P, Brady M, Smith S. Improved Optimization for the Robust and Accurate Linear Registration and Motion Correction of Brain Images. Neuroimage 2002; 17: 825-841.
12. R Development Core Team. R: A language and environment for statistical computing. 2011.
13. Pinheiro J, Bates D, DebRoy S, Sarkar D, R Development Core Team. nlme: Linear and Nonlinear Mixed Effects Models. 2013; R package version 3.1-113.
Figures