1990
A new texture-based method for assessing high angular diffusion MRI from patients with multiple sclerosis1Schulich school of engineering, University of Calgary, Calgary, AB, Canada, 2University of Calgary, Calgary, AB, Canada
Synopsis
The capacity of high angular resolution diffusion MRI to detect subtle pathology in multiple sclerosis (MS) patients can be enhanced when combined with image texture analysis techniques. This study proposes a new voxel-based analysis of diffusion image texture including entropy and angular second moment (ASM, homogeneity), and 45 direction-values per voxel. Results show that while all diffusion maps have differences between lesions and control tissue, both diffusion entropy and ASM maps have better contrast than the classical maps of fractional anisotropy. This new approach may enhance our ability in detecting subtle nerve fiber tract integrity.
Introduction
High resolution diffusion-weighted MRI can detect subtle abnormalities in brain white matter as seen in patients with multiple sclerosis (MS).1 Image texture analysis is another approach to identify invisible changes in tissue structure2. Recent evidence shows that combining diffusion MRI with texture analysis can further enhance the detection of tissue pathology.3 Specifically, diffusion-based texture entropy, a measure of tissue complexity, outperformed fractional anisotropy (FA) in the detection of both traumatic brain injury and crossing nerve fibers4. In this study, we aim to investigate the utility of diffusion texture measures including entropy and angular second moment (ASM, diffusion homogeneity) as compared to FA in assessing MS lesions and the normal appearing white matter (NAWM).Method
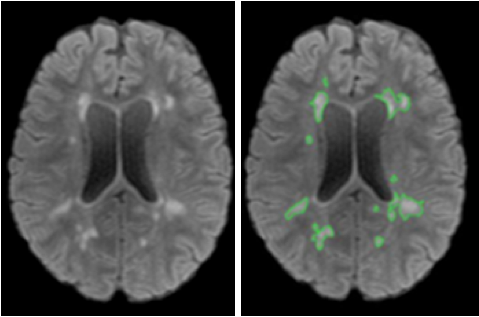
We evaluated the MR images of 16 MS patients enrolled in an ongoing clinical trial acquired from a GE 3T scanner (Discovery750, Milwaukee, USA). Imaging protocols included FLAIR images (TR/TE = 6000/84 ms; slice thickness = 3 mm; matrix =512 x512) and diffusion MRI: b=1000, 3 b0 volumes, and 45 directions, matrix = 120x120 mm2, and slice thickness = 2 mm. Image preprocessing involved several steps to improve quality. This included brain extraction using FSL (Oxford, UK), signal intensity normalization (ranging 0 to 255) with an in-house program, and eddy current correction for FA computation in FSL. Additionally, we used a connected-component labeling method based on morphological features to segment the MS lesions using FLAIR images for further analysis (Figure 1).The computation of diffusion entropy and ASM used a voxel-based approach. Based on the diffusion values from all 45 directions per voxel in a diffusion volume, we used the following equations to calculate diffusion entropy: $$$-{\sum}_{x_{i}\epsilon k}p(x_{i})\log_{2}{p(x_{i})}$$$ and ASM: $$${\sum}_{x_{i}\epsilon k}p(x_{i})^{2}$$$, where p(xi) represented the probability of a diffusion value repeating in corresponding voxels among the 45 gradient directions; x_i referred to the diffusion value in each direction.The final value of diffusion entropy and ASM per patient were derived from the mean of 5 brain MRI slices. These slices representing the slices with the most lesions around the lateral ventricles. The segmented lesion ROIs in FLAIR images served as the reference for selecting contralateral NAWM ROIs for comparison. These ROIs were spatially transformed to the diffusion maps using ImageJ for quantitative analysis.Result
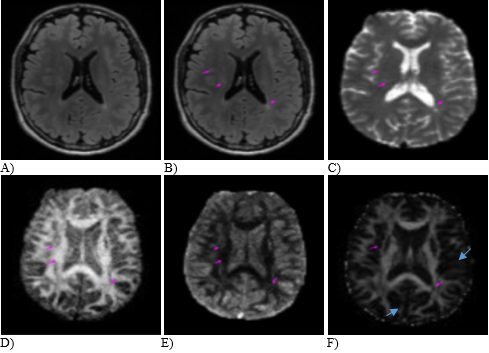
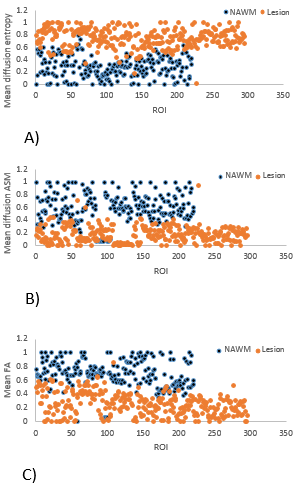
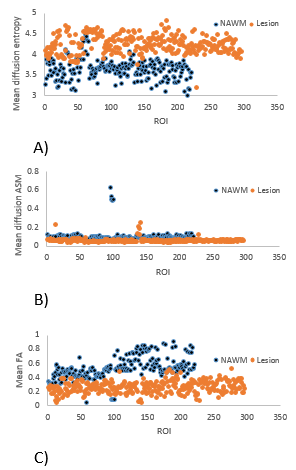
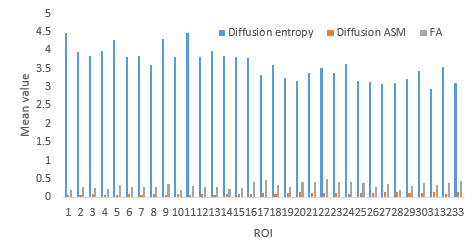
We evaluated 296 lesions and 221 NAWM ROIs from 16 patients. Both diffusion entropy and ASM maps showed better contrast between tissue types and revealed finer details of white matter tracks than the FA maps, including the thin fiber tracts in brain gray matter (Figure 2). Quantitatively, the diffusion entropy was significantly higher and ASM and FA were lower in lesions than in the NAWM (Figures 3 & 4), where p≤0.01 for each outcome. The range of diffusion entropy values was also higher (3-5) than that of ASM (0-0.2) and FA (0-1) for both lesions and the NAWM (Figure 5).Discussion
This study provides a new way of assessing the MRI diffusion data. In contrast to the traditional method that analyzes diffusion one MRI slice at a time, this study focuses on the distribution of diffusion along various directions per image voxel, and thereby takes full account of the angularity of diffusion within the microstructure of a voxel. The present work shows that brain regions that were lacked organized structure such as CSF had low diffusion entropy and it was higher in MS lesions. (Figure 3), consistent with previous studies showing that entropy correlated with axonal density and was superior to FA in detecting white matter disorganization.4
Measures of diffusion ASM are opposite to that of entropy. As it reveals the homogeneity of a structure, the ASM showed a similar trend to FA, which was higher in anisotropic structures such as NAWM and lower in disrupted (lesions). Moreover, the high dynamic range of diffusion entropy and ASM values can help improve the visibility of image content,5 maintain anatomical details, and prevent feature loss in weak signal areas.6Conclusion
Both diffusion entropy and diffusion ASM demonstrated high sensitivity in delineating subtle microstructure properties of brain white matter as compared to FA. Combining texture analysis with high angular diffusion MRI may prove to be a new useful approach for assessing lesion structure in MS and similar diseases. With further validation, this method may be used to monitor axonal injury and repair in the future.Acknowledgements
We acknowledge the funding support from MS Society of Canada and NSERC for this study.References
1. Jan Scholz, Heidi Johansen-Berg. Individual Differences in White Matter Microstructure in the Healthy Brain, 2014; in Diffusion MRI (Second Edition) 2. Kassner A, Thornhill RE. Texture analysis: a review of neurologic MR imaging applications. American Journal of Neuroradiology. 2010 May 1;31(5):809-16.3. Fozouni N, Chopp M, Nejad-Davarani SP, Zhang ZG, Lehman NL, Gu S, Ueno Y, Lu M, Ding G, Li L, Hu J, Bagher-Ebadian H, Hearshen D, Jiang Q. . Characterizing brain structures and remodeling after TBI based on information content, diffusion entropy. PLoS One, 2013; 8:e76343.4. Delic, J., Alhilali, L. M., Hughes, M. A., Gumus, S., & Fakhran, S. White matter injuries in mild traumatic brain injury and posttraumatic migraines: diffusion entropy analysis. Radiology, 2016; 279(3), 859–866. doi:10.1148/radiol.20151513885. Mantiuk R., Daly S.J., Myszkowski K., Seidel H.-P.: Predicting Visible Differences in High Dynamic Range Images: Model and its Calibration. In Electronic Imaging 2005 (2005), International Society for Optics and Photonics, pp.204–214. 106. Hung AH, Liang T, Sukerkar PA, Meade TJ. High Dynamic Range Processing for Magnetic Resonance Imaging. PloS one. 2013 Nov 8;8(11):e77883.Figures