1989
Multi-shell diffusion imaging is a sensitive marker for longitudinal axonal degeneration in multiple sclerosis1Biomedicine and Prevention, University of Rome Tor Vergata, Rome, Italy, 2Athinoula A. Martinos Center for Biomedical Imaging and Harvard Medical School, Boston, MA, United States, 3CSIC-UMH, Instituto de Neurociencias de Alicante, Alicante, Spain, 4Brain Research Imaging Centre (CUBRIC), Cardiff University, Cardiff, United Kingdom, 5Department of Clinical Neuroscience, Karolinska Institutet, Solna, Sweden, 6Department of Radiology, Karolinska University Hospital, Stockholm, Sweden
Synopsis
Axonal loss, a crucial pathological process in multiple sclerosis (MS), can be disentangled non-invasively by the CHARMED diffusion model. 8 early MS subjects were scanned at baseline and after 1 year follow-up. At follow-up, TBSS analysis showed statistically significant changes (decrease in FR/FA, increase in MD) compared to baseline in widespread brain regions. The most extensive change was evident in FR, which also showed the greatest sensitivity, especially in areas of fiber-crossing. FR was the only index which detected longitudinal change in axonal density in lesions and therefore holds promise as a biomarker for early diagnosis and disease-monitoring purposes.
INTRODUCTION
Axonal loss is a main determinant of long-term disability and disease progression in multiple sclerosis (MS)1. However, detecting axonal loss non-invasively in vivo is challenging and the nature of its link to inflammatory demyelination is still unknown. Diffusion tensor imaging (DTI)2 studies have reported microstructural abnormalities in focal white matter (WM) lesions and normal-appearing WM (NAWM) in MS3. DTI metrics, however, are relatively unspecific to changes in axonal microstructure. The Composite Hindered and Restricted Model of Diffusion (CHARMED)4 is an advanced multi-shell diffusion-weighted imaging method that, in contrast to DTI, disentangles the effects of demyelination and axonal loss by providing an estimate of the so-called restricted fraction (FR) - a surrogate marker for axonal density. We previously provided evidence for the presence of widespread decrease in axonal density in NAWM of early MS cases that is, at least in part, unrelated to focal demyelinating lesions. These differences are invisible to conventional DTI5. In this paper, we investigate the potential of FR estimation in comparison to DTI microstructural indices in tracking disease progression after 1 year.METHODS
Eight early MS subjects (disease duration ≤5 years, all females) were scanned on a Siemens 3 T Connectom scanner equipped with 300 mT/m maximum gradient strength at baseline and after 1 year. Three diffusion weightings (b-values) were applied along non-collinear gradient directions: 1000 (64 directions), 5000 (128 directions) and 10000 s/mm2 (128 directions), isotropic voxel size 1.5 mm3. In addition, 28 diffusion un-weighted scans (b0 images) were acquired, interspersed throughout the diffusion-weighted scans to facilitate motion correction. Additional imaging (used for lesion segmentation) included a 3D MEMPRAGE (FA/TR/TEs/TI=7°/2530ms/1.15-3.03-4.89-6.75/1100ms, GRAPPA=2) and a 3D T2-SPACE-FLAIR (variable FA, TR/TE/TI=5000ms/393ms/1800ms, GRAPPA=2). Diffusion-weighted data were pre-processed with FreeSurfer and FSL tools. Pre-processing included gradient nonlinearity correction, motion correction and eddy current correction including b-matrix reorientation, after which axonal density (FR) maps were obtained through the CHARMED5 pipeline. DTI maps (mean diffusivity (MD) and fractional anisotropy (FA)) were obtained using ExploreDTI6 and employing b=0 and b=1000 data only. Lesion masks were drawn by a radiologist for both time points independently. Successively, the follow-up scan was registered to the baseline scan using the FA maps to guide the warps. The same transformation was then applied to MD and FR maps and as well as to lesion masks. We discarded lesions smaller than 12 voxels. The overlap between lesions at baseline and followup was calculated and lesions were classified as conserved (i.e. present at both scans with overlap > 10%), disappeared (visible at baseline but not at followup) and novel (visible only at follow-up). CHARMED and DTI maps were compared voxel-wise between timepoints using tract-based spatial statistics (TBSS)7 while controlling for age, gender and multiple comparisons across clusters and excluding the lesion masks. Additionally, for each parameter P={MD, FA, FR}, the asymmetry (Pfollowup-Pbaseline)/(Pfollowup+Pbaseline) was calculated for conserved, novel and disappeared lesions. The null hypothesis of 0 asymmetry was tested using one-sample t-tests.RESULTS
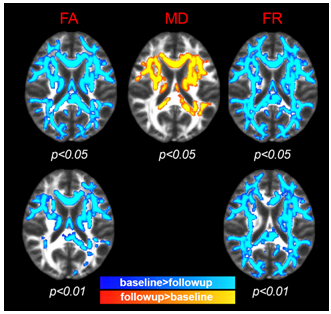
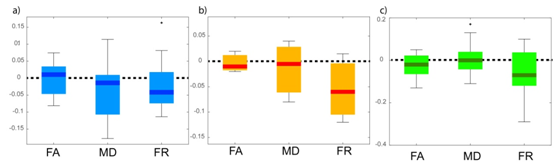
At 1 year follow-up, TBSS analysis showed statistically significant (p<0.05) change (decrease in FR and FA, increase in MD) compared with the baseline in widespread regions, especially in FA and FR. The most extensive change, which can be interpreted as axonal loss, was evident in FR, and this increased sensitivity especially in areas of fiber crossing (compared to DTI indices) was confirmed when lowering the statistical threshold to p<0.01 (Figure 1, bottom). In all lesion categories, the largest asymmetry between follow-up and baseline was seen in FR, and was only statistically significant in FR (at p=0.02) in the category of conserved lesions. Interestingly, the same trend (largest asymmetry in FR) was evident in disappeared lesions and in novel lesions, although not statistically significant (possibly due to sparsity of novel lesions).DISCUSSION and CONCLUSION
Our findings show in vivo evidence of progressive axonal loss in WM lesions and NAWM of early MS cases. In lesional WM tissue, the greatest reduction in axonal density is found in persisting lesions. The variability in FR changes in resolving lesions could indicate the presence of repair mechanisms in some plaques. The axonal density estimate FR extracted from the CHARMED model is a sensitive marker for longitudinal change in MS both in NAWM and in lesions, which clearly outperforms conventional DTI and therefore holds promise as a novel biomarker for early diagnosis and disease-monitoring purposes.Acknowledgements
This study was supported by a grant of the National Institute of Health (NIH R01NS07832201 A1), and partly by the Human Connectome Project, MGH-USC Consortium (NIH U01MH093765) and by NIH P41EB015896 and the Instrumentation Grants S10RR023043, 1S10RR023401, 1S10RR019307. Dr. De Santis is supported by a NARSAD Young Investigator Grant (Grant #25104) and by the European Research Council through a Marie Skłodowska-Curie Individual Fellowship. Dr. Granberg was supported by the Stockholm City Council and Karolinska Institutet (ALF grants 20120213 and 20150166) and the Swedish Society for Medical Research (post-doctoral fellowship). Dr. Herranz was supported by the National Multiple Sclerosis Society (fellowship FG-1507-05459).References
1. Lee JY, Taghian K, Petratos S. Axonal degeneration in multiple sclerosis: can we predict and prevent permanent disability? Acta Neuropathol Commun 2014, 2:97
2. Basser PJ, Mattiello J, LeBihan D. Estimation of the effective self-diffusion tensor from the NMR spin echo. J Magn Reson B 1994;103:247–254.
3. Werring DJ, Clark CA, Barker GJ, et al. Diffusion tensor imaging of lesions and normal-appearing white matter in multiple sclerosis. Neurology 1999;52:1626-1632.
4. Assaf Y, Ben-Bashat D, Chapman J, et al. High b-value q-space analyzed diffusion-weighted MRI: Application to multiple sclerosis. Magn Res Med 2002;47:115-126.
5. De Santis S, Granberg T, Ouellette R, Treaba CA, Fan Q, Herranz E, Mainero C, Toschi N (2017), Early axonal damage in normal appearing white matter in Multiple Sclerosis: novel insights from multi-shell diffusion MRI. 39th Annual International Conference of the IEEE Engineering in Medicine and Biology Society (EMBC).
6. Leemans A, Jeurissen B, Sijbers J, Jones DK (2009). ExploreDTI: A graphical toolbox for processing, analyzing, and visualizing diffusion MR data. Proceedings of the 17th Scientific Meeting, International Society for Magnetic Resonance in Medicine, Honolulu, USA, abstract n. 3537.
7. Smith SM, Jenkinson J, Johansen-Berg H, Rueckert D, Nichols TE, Mackay CE, Watkins KE, Ciccarelli O, Cader MZ, Matthews PM, Behrens TE (2006). Tract-based spatial statistics: Voxelwise analysis of multi-subject diffusion data. NeuroImage 31:1487-1505.
Figures