1985
Diagnostic Accuracy of Semiautomatic T2 Subtraction plus Quantitative Susceptibility Mapping in the Detection of New Multiple Sclerosis Lesions1Radiology, Tongji Hospital, Tongji Medical College, Huazhong University of Science and Technology, Wuhan, China, 2Radiolgy, Weill Cornell Medical College, NewYork, NY, United States, 3Healthcare Policy and Research, Weill Cornell Medical College, NewYork, NY, United States, 4Neurology, Weill Cornell Medical College, NewYork, NY, United States, 5Biomedical Engineerring, Cornell University, Ithaca, NY, United States
Synopsis
The ability to identify new MRI lesions in patients with multiple sclerosis (MS) on follow-up imaging is of great importance in monitoring disease activity and informing therapeutic decision-making. Gadolinium (Gd)-enhancing lesions tend to be isointense or slightly hyperintense on QSM images whereas non-enhancing tend to be hyperintense. However, characterization of QSM signal of MS lesions in isolation can be difficult without coregistered T2-weighted imaging. For this reason, we developed an algorithm of T2-subtraction based on two time points of FLAIR images, as well as an automatic lesion mask to help detect new MS lesions with the overall goal of combining this technique with QSM to predict the enhancement status of MS lesions. We found that T2 subtraction+QSM has a sensitivity of 90.9% to predict new enhancing lesions that had been previously identified by experienced neuroradiologists on T1w+Gd imaging. In discriminating between new enhancing versus new but nonenhancing lesions, our T2 subtraction+QSM protocol had a sensitivity of 87.5%, and specificity of 89.7%. Receiver operating characteristic (ROC) curve analysis using region-of-interest of susceptibility values on QSM showed an optimal cutoff susceptibility value of -4.92 ppb (referenced to CSF) in distinguishing new enhancing lesions from new but nonenhancing lesions (sensitivity 88.9%, specificity 80.0%). Our results suggest that T2 subtraction plus QSM no Gd protocol can be a useful tool in detecting the new enhancing MS lesions in clinical practice without Gd injection.
Background and purpose: The ability to identify new MRI lesions in patients with multiple sclerosis (MS) on follow-up imaging is of great importance in monitoring disease activity and informing therapeutic decision-making. Quantitative susceptibility imaging (QSM) has gained recent interest as a novel tool to study MS, because both iron and myelin pathologies cause measurable magnetic susceptibility changes in MS patients. We have shown that the susceptibility value of MS lesions increases as a lesion evolves from enhancing to nonenhancing over time and that QSM can be a useful tool to discriminate between new gadolinium-enhancing from new but nonenhancing lesions1, 2. Gd-enhancing lesions tend to be isointense or slightly hyperintense on QSM whereas non-enhancing lesions tend to be hyperintense on QSM. In this study, we developed an algorithm of T2-subtraction based on two time points of FLAIR images, as well as an automatic lesion mask to help detect new MS lesions. By combing the T2-subtraction technique and QSM images, we aimed to evaluate the diagnostic accuracy of this no-Gd MRI protocol in detecting new enhancing lesions, as well as in discriminating between new enhancing versus new but not enhancing MS lesions.
Methods: We included 19 MS patients with two MRI time points consisting of T1w post-Gd, T2 FLAIR and QSM. T2-subtraction maps were generated by subtracting the voxel-by-voxel signal intensity on the two T2 FLAIR time points. First, two experienced neuroradiologists used T1w pre- and post-contrast images to identify all enhancing lesions using conventional side-by-side comparison, then retrospectively reviewed the T2-subtraction map to identify which enhancing lesions were detected by the automated masks. Second, with the aid of the T2-subtraction map and automatic lesion mask, the neuroradiologists identified all the new enhancing and new but nonenhancing lesions based on two time points of T2 FLAIR, T2 subtraction and T1w post-Gd images. Finally, after a 4-week washout period to reduce the risk of recall bias, the coregistered T2+QSM images were used to predict new enhancing lesions. The previously identified new enhancing and new but nonenhancing lesions were used as the reference standard for diagnostic accuracy assessments. Receiver operating characteristic (ROC) curve analysis was also performed using ROI analysis of susceptibility values to determine the optimal cutoff susceptibility value in distinguishing new-enhancing lesions from new but nonenhancing lesions.
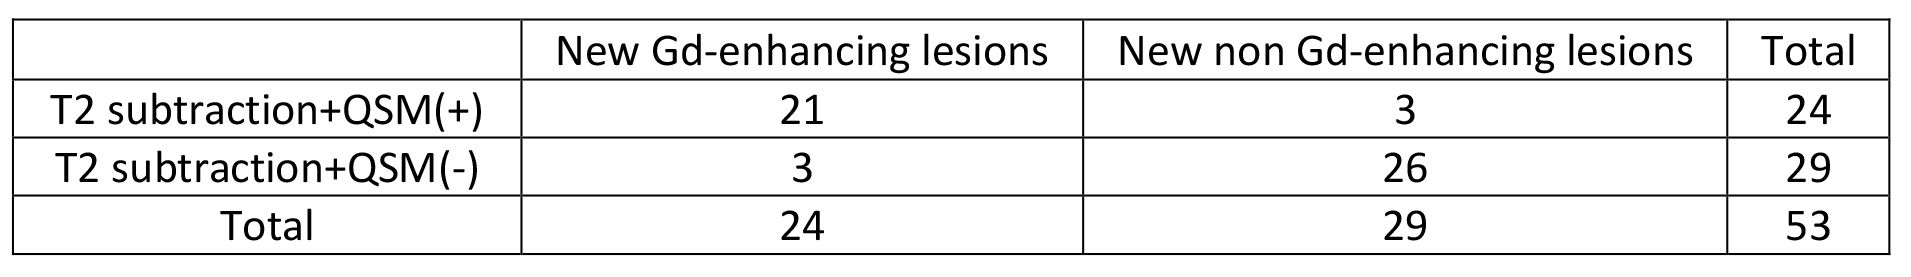
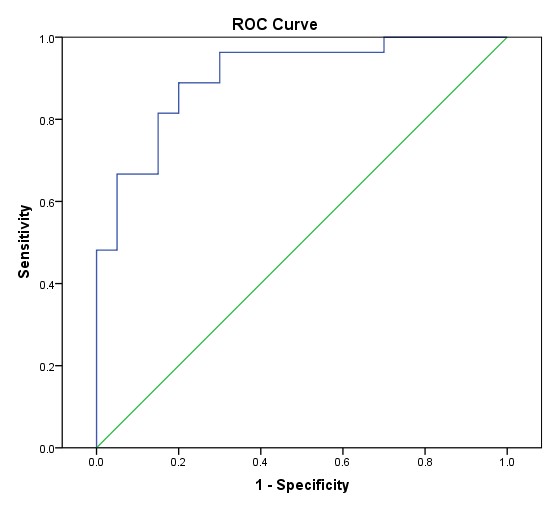
Results: A total of 22 enhancing lesions were identified on the T1w-post Gd images. These 22 lesions are all positive on the T2-subtraction maps (sensitivity 100%), and 20/22 were either isointense or slightly hyperintense on QSM, which is predictive of an enhancing lesion based on QSM signal characteristics. Therefore the sensitivity of T2-subtraction+QSM in predicting enhancing lesions is 90.9%. With the aid of the T2-subtraction+QSM no-Gd protocol, 24 lesions were defined as new enhancing lesions (2 enhancing lesions were missed in retrospect without the aid of the T2 subtraction map), and 29 lesions were defined as new but nonenhancing lesions (Table 1). The sensitivity and specificity of T2subtraction+QSM no-Gd protocol in predicting the new enhancing lesions by neuroradiologists’ judgement was 87.5% (21/24) and 89.7% (26/29), respectively. The area under the curve (AUC) from ROC curve was 0.91, a cutoff value of -4.92 ppb (referenced to CSF) obtained from the maximum Youden index (1.689) had a sensitivity of 88.9% and specificity of 80.0%. (Fig 2)
Discussion and conclusion: Our study showed that T2 subtraction mapping is very sensitive in detecting new lesions, including potentially small subtle enhancing lesions that may be missed by inspection of conventional MRI sequences alone. Further, we showed that T2 subtraction+coregistered QSM is highly accurate in discriminating between enhancing and new but nonenhancing MS lesions. Our results support the notion that T2 subtraction+QSM can form the basis of a no Gd MRI protocol that can be used in the routine surveillance of MS patients without the known and potentially unknown risks of repetitive Gd injections.
Acknowledgements
This work was supported by NIH grant R21EB024366, R21EY027568, R01NS095562, and S10OD021782.References
1. Zhang Y, Gauthier SA, Gupta A, et al. Magnetic Susceptibility from Quantitative Susceptibility Mapping Can Differentiate New Enhancing from Nonenhancing Multiple Sclerosis Lesions without Gadolinium Injection. AJNR Am J Neuroradiol 2016
2. Zhang Y, Gauthier SA, Gupta A, et al. Longitudinal change in magnetic susceptibility of new enhanced multiple sclerosis (MS) lesions measured on serial quantitative susceptibility mapping (QSM). Journal of Magnetic Resonance Imaging 2016;44:426-432
Figures