1984
Reproducibility Study of a Longitudinal Pipeline for Brain Volumetry based on Partial Volume Estimation1Advanced Clinical Imaging Technology, Siemens Healthcare AG, Lausanne, Switzerland, 2Department of Radiology, Centre Hospitalier Universitaire Vaudois (CHUV), Lausanne, Switzerland, 3Signal Processing Laboratory (LTS 5), École Polytechnique Fédérale de Lausanne (EPFL), Lausanne, Switzerland, 4Biogen, Cambridge, MA, United States, 5Cleveland Clinic, Cleveland, OH, United States, 6Johns Hopkins University, Baltimore, MD, United States, 7New York University, New York, NY, United States
Synopsis
A reliable and accurate quantification of brain tissue loss is important to measure progressive atrophy caused by neurological diseases such as multiple sclerosis. However, accuracy and reproducibility of current methods are often limited by partial volume effects, especially at tissue interfaces where subtle atrophy patterns are likely to occur. We propose a longitudinal pipeline for brain tissue segmentation incorporating partial volume estimation to increase longitudinal robustness. Results show an increase in reproducibility of 44% compared to methods not including partial volume effects in volume estimation, suggesting that these effects should be taken into account for longitudinal atrophy measurements.
Introduction
Annualized MR-based brain atrophy quantification has become an important marker for many neurodegenerative diseases. In particular, multiple sclerosis (MS) requires precise longitudinal brain volume estimation to routinely monitor disease severity and progression. Several segmentation methods have been proposed to accurately detect brain volume changes1,2; meeting such performance criteria remains however challenging3. Brain parenchymal fraction (BPF) defined as the ratio between brain volume (BV) and a head-size normalization factor (usually total intracranial volume or brain outer contour), has proven to be a reliable metric for the analysis of brain tissue loss4. Nevertheless, atrophy quantification is prone to errors due to partial volume effects or tissue misclassifications, e.g. scalp or dura mater counted as brain due to skull-stripping errors. This work introduces an automated algorithm for longitudinal brain atrophy quantification incorporating partial volume estimation and compares its performance in a reproducibility study.Materials and Methods
Thirty MS patients from three institutions provided written informed consent for participating in a scan-rescan study. Each patient was scanned four times in two days (two scans per day) within one week. A 3D MPRAGE sequence (TR=2300ms, TI=900ms, matrix size=240x256x176; voxel=1×1×1mm3) was acquired in each session on different 3T scanners (MAGNETOM Verio, Skyra or Prismafit, all Siemens Healthcare, Erlangen, Germany).
First, we applied an affine registration5 to the four MPRAGE images (first scan as reference) followed by N4-bias field correction6 and an in-house skull-stripping algorithm7 providing the normalization factor for the BPF computation. Taking as input the resulting skull-stripped images, we compared the reproducibility of the following algorithms:
a) [MODEL-BASED] 5-class Gaussian mixture model-based algorithm7
b) [PV] partial volume estimation algorithm8
c) [LONG] time-invariant skull-stripped mask generation (see details below) followed by PV
Brain and cerebrospinal fluid (CSF) volumes are estimated by summing up probabilities (a) or concentrations (b and c).
The longitudinal approach (c), consisted in creating a patient-specific time-invariant intracranial mask as the intersection of the four skull-stripped masks followed by an erosion with a spherical kernel (7x7x7 voxels) to mitigate volume variability induced by skull-stripping errors. The resulting eroded region volume was used as BPF normalization factor. The new mask was applied to extract the eroded intracranial region TIVe of each time point. Bias-field correction and partial volume estimation were launched using these TIVe.
Reproducibility was evaluated as absolute difference of the BPF, as well as fuzzy Dice9 for each pairwise comparison according to the following scenarios: same-day, same-scanner (SDSS, N=38); same-day, different-scanner (SDDS, N=12); different-day, same-scanner (DDSS, N=38); different-day, different-scanner (DDDS, N=52).
Results
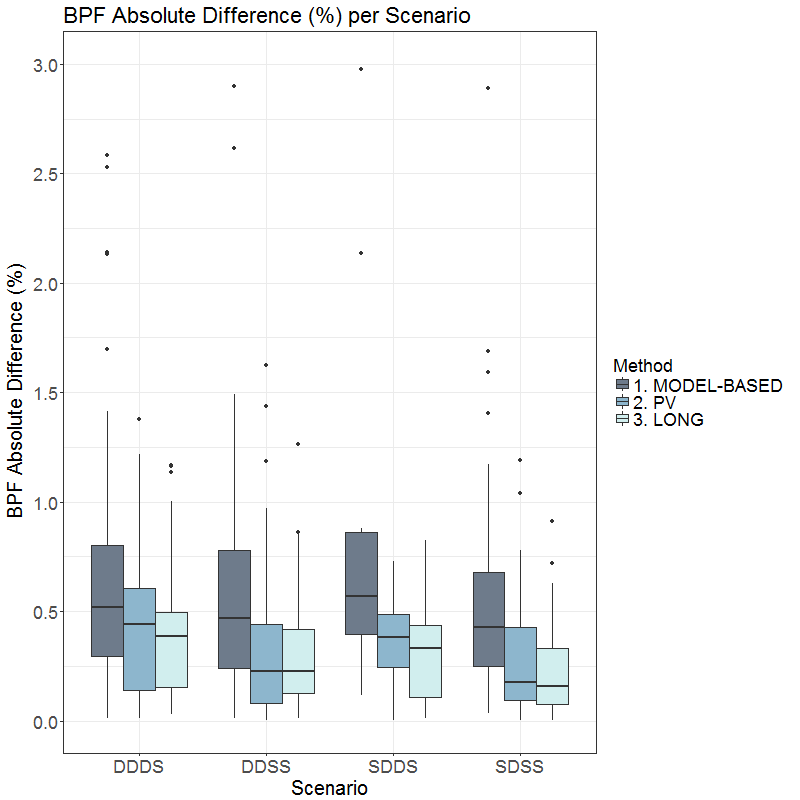
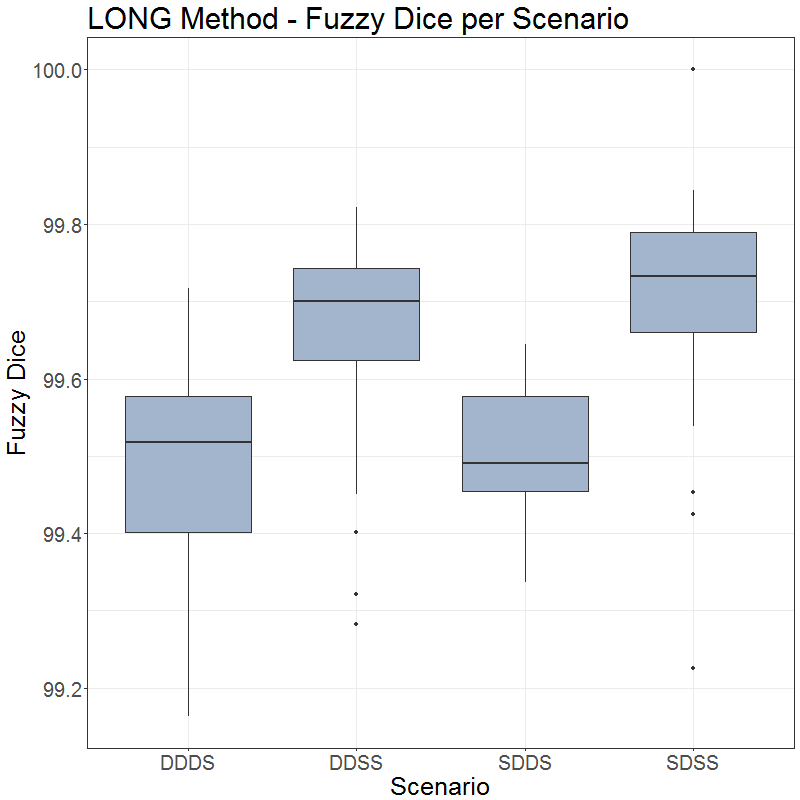
Images from twenty-five subjects were included in the analysis; five cases failed the quality assessment (no distortion corrected images available). The overall variability of the three algorithms is presented in Figure 1. They all show higher variability due to the use of different scanners (DDDS and SDDS) compared to the variability due to temporal changes (DDSS and SDSS). The MODEL-BASED algorithm introduced the highest absolute BPF differences in all scenarios (min. and max. median: 0.43% and 0.57%, respectively). Both methods using partial volume estimation outperformed these results with a significant improvement on DDSS and SDSS. We observed an overall reduction of the spread across all scenarios for PV and LONG methods. LONG algorithm achieved the best results (median DDDS: 0.39%, DDSS: 0.23%, SDDS: 0.33%, SDSS 0.16%) confirmed by fuzzy Dice values higher than 99% (Figure 2).Discussion and Conclusions
Previous studies showed that ignoring partial volume in volume quantification could lead to significant errors10. Our results confirm this observation and indicate that partial volume helps improving volume estimates reproducibility. Volumes are thus consistently estimated over regions susceptible to partial volume effects, particularly at GM/CSF interfaces. Nevertheless, improvements in reproducibility are valuable only if accuracy is not compromised. Ongoing work aims at comparing our algorithm accuracy against other methods.
Moreover, there is an improvement using TIVe for longitudinal analyses. The performance of the skull-stripping methods has a non-negligible effect on brain tissue classification; the erosion helps mitigating the effect of misclassified extracerebral tissue under the assumption that brain tissue loss correlates with an increase in CSF volume, both in the ventricles and cortical areas. This method still needs additional validation, particularly by applying it on longitudinal datasets.
Our results confirm prior reports that the use of different scanner hardware has a considerable impact on the longitudinal variability11 (see SDDS and DDDS values) which may suggest the need for additional calibration strategies to account for these hardware effects12. This would further help translating measurement of brain atrophy to clinical routine at the individual patient level.
Acknowledgements
No acknowledgement found.References
[1] Zivadinov, R., Jakimovski, D., Gandhi, et al. Clinical relevance of brain atrophy assessment in multiple sclerosis. Implications for its use in a clinical routine. Expert Review of Neurotherapeutics. 2016; 16(7), 777–793. https://doi.org/10.1080/14737175.2016.1181543
[2] Reuter, M., Schmansky, N. J., Rosas, H. D., & Fischl, B. Within-subject template estimation for unbiased longitudinal image analysis. Neuroimage. 2012; 61(4), 1402–1418. https://doi.org/10.1016/j.neuroimage.2012.02.084
[3] Sastre-Garriga, J., Pareto, D., & Rovira, À. Brain Atrophy in Multiple Sclerosis: Clinical Relevance and Technical Aspects. Neuroimaging Clinics of North America. 2017; 27(2), 289–300. https://doi.org/https://doi.org/10.1016/j.nic.2017.01.002
[4] Vågberg, M., Granåsen, G., & Svenningsson, A. Brain Parenchymal Fraction in Healthy Adults—A Systematic Review of the Literature. P. Lundberg, Ed., PLoS ONE. 2017. San Francisco, CA USA. https://doi.org/10.1371/journal.pone.0170018
[5] Klein, S., Staring, M., Murphy, et al. elastix: a toolbox for intensity-based medical image registration. IEEE Transactions on Medical Imaging. 2010; 29(1), 196–205. https://doi.org/10.1109/TMI.2009.2035616
[6] Tustison, N. J., Avants, B. B., Cook, P. A., et al. N4ITK: Improved N3 Bias Correction. IEEE Transactions on Medical Imaging. 2010; 29(6), 1310–1320. https://doi.org/10.1109/TMI.2010.2046908
[7] Schmitter D, Roche A, Maréchal B, et al. An evaluation of volume-based morphometry for prediction of mild cognitive impairment and Alzheimer’s disease. NeuroImage : Clinical. 2015;7:7-17. doi:10.1016/j.nicl.2014.11.001.
[8] Roche, A. and F. Forbes, Partial volume estimation in brain MRI revisited Medical Image Computing and Computer-Assisted Intervention–MICCAI 2014. 2014, Springer. p. 771-778.
[9] Roche, A., Ribes, D., Bach-Cuadra, M., & Kruger, G. On the convergence of EM-like algorithms for image segmentation using Markov random fields. 2011. Medical Image Analysis; 15(6), 830–839. https://doi.org/10.1016/j.media.2011.05.002
[10] Tohka, J. Partial volume effect modeling for segmentation and tissue classification of brain magnetic resonance images: A review. 2014. World Journal of Radiology; 6(11), 855–864. Retrieved from http://www.ncbi.nlm.nih.gov/pmc/articles/PMC4241492/
[11] Kruggel, F., Turner, J., Muftuler, L. T., & Initiative, T. A. D. N. Impact of scanner hardware and imaging protocol on image quality and compartment volume precision in the ADNI cohort. NeuroImage. 2010; 49(3), 2123–2133. https://doi.org/10.1016/j.neuroimage.2009.11.006
[12] Amann, M., Falkovskiy, P., Thoeni, A., et al. The impact of data analysis method, scanner type and scan session on volume measurements of brain structures. In ISMRM, 24th Annual Meeting. 2016.
Figures