1983
Integration of Probabilistic Atlas and Graph Cuts for Automated Segmentation of Multiple Sclerosis lesions1Univ Rennes, Inria, CNRS, IRISA UMR 6074, VISAGES ERL U-1228, F-35000, Rennes, France
Synopsis
We propose a framework for automated segmentation of Multiple Sclerosis (MS) lesions from MR brain images. It integrates a priori tissues and MS lesions information into a Graph-Cuts algorithm for improved segmentation results. We formulate the energy terms to include a priori information as well as the information derived directly from the MR images. We validate our method on a dataset of 37 MS subjects with a broad range of lesion loads. Results indicate that integrating a priori information with the information derived from the images can improve the segmentation outcome.
Introduction
We propose a framework for
automated segmentation of Multiple Sclerosis (MS) lesions from MR brain images.
It integrates a priori tissues and MS lesions information into a Graph-Cuts
algorithm for improved segmentation results.METHOD
Pre-processing. The method requires three MR sequences per subject: T1-w, T2-w and FLAIR. MR images are first denoised1, rigidly registered towards the T1-w image2, skull-stripped3 and bias corrected4. Then, their intensities are normalized by applying the decile normalization method proposed by Nyul et al.5,6.
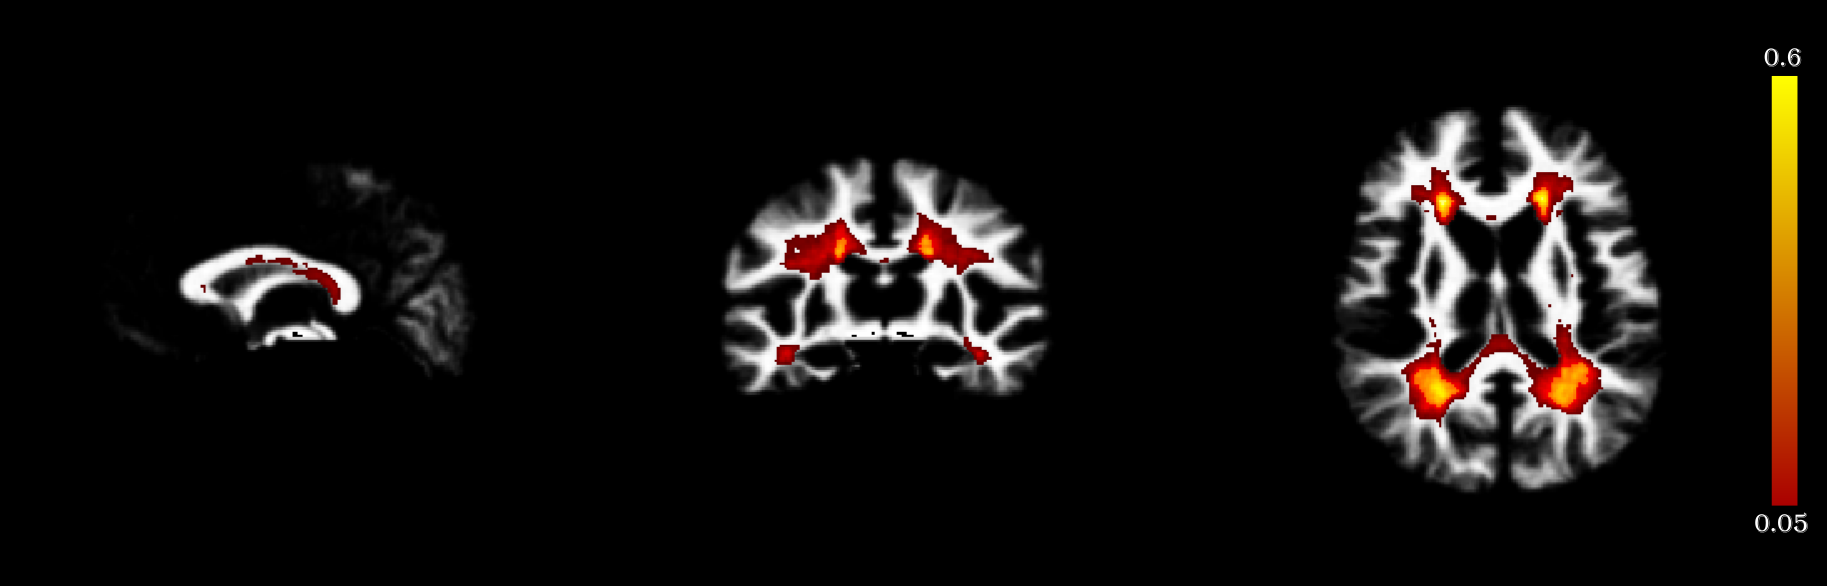
A probabilistic atlas (i.e. CSF, WM, GM and MS lesion probability maps intensity normalized for the four classes, Figure 1) is registered into the subject space. The T1-w template image is registered to the T1-w subject image using a linear registration, based on a block-matching2, followed by a dense non-linear registration7,8.
Segmentation method. We adopt a Graph-Cuts segmentation approach, where the two terminal nodes, source and sink, respectively represent the MS lesions or object class and the Normal Appearing Brain Tissues (NABT) or background class8. Given the set of nodes I and the set of connections N between two nodes {i, j}, the GC algorithm minimizes an energy function E(V), where V is the object segmentation:
$$E(V)=\sum_{\left\{i,j\right\}\epsilon N}B_{\left\{i,j\right\}}+\alpha\sum_{i\epsilon N}R_i(V_i)$$
The boundary term B{i,j} reflects the similarity of neighbour voxels {i,j}, and the regional term Ri(.) refers to the probability for i to fit into the object and background models. We compute the boundary weights using the spectral gradient8 and the object and background weights as described below.
We model the NABT with a 3-class Gaussian Mixture Model. We estimate the NABT GMM using tissue probability maps initializing a robust EM9, which optimizes a trimmed likelihood to be robust to the presence of outliers (e.g. lesions). Then, we evaluate the Mahalanobis distance Z2 between each voxel i and each tissue class m. Assuming that Z2 follows a χ2 distribution, the p-value for a voxel i is obtained as
$$p_{im}=1-F_{\chi^2}(Z^2) $$
pim represents the probability that the voxel i does not fit into a class m of the NABT GMM. Voxels that fit into the NABT GMM must have a high background weight WiB. We formulate the equation for computing WiB to include both pim and a priori MS lesion information PiMS as
$$W_{iB}=\beta(1–min(p_{im}))+(1-\beta)(1-P_{iMS})$$
, where the parameter β controls the amount of information from the Mahalanobis distance and the prior. min(pim) is the lowest p-value among the m classes for a voxel i. The parameter β was set to 70%.
We formulate the object weights to include information from the MS lesion prior, the Mahalanobis distance and the hyper-intensities on T2-w and FLAIR images:
$$W_{iO}=min(P_{iO},W_{T2},W_{FLAIR})$$
, where
$$P_{iO}=\beta min(p_{im})+(1-\beta)P_{iMS}$$
and WT2,WFLAIR are fuzzy weights derived from the T2-w and FLAIR hyper-intensities8.
Post-processing. A candidate lesion is discarded if one of the following conditions is verified: i) it is not sufficiently located within the WM, ii) it touches the brain mask border, iii) its size is lower than 3mm3.
RESULTS
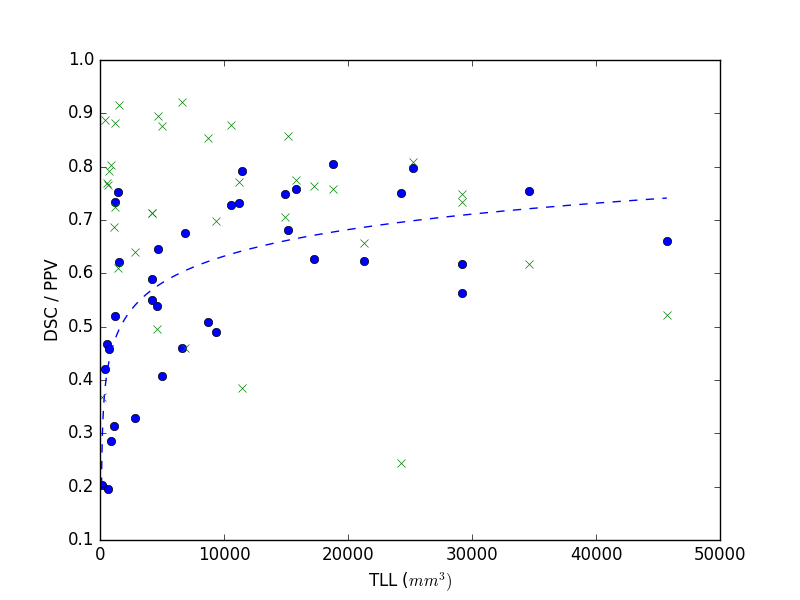
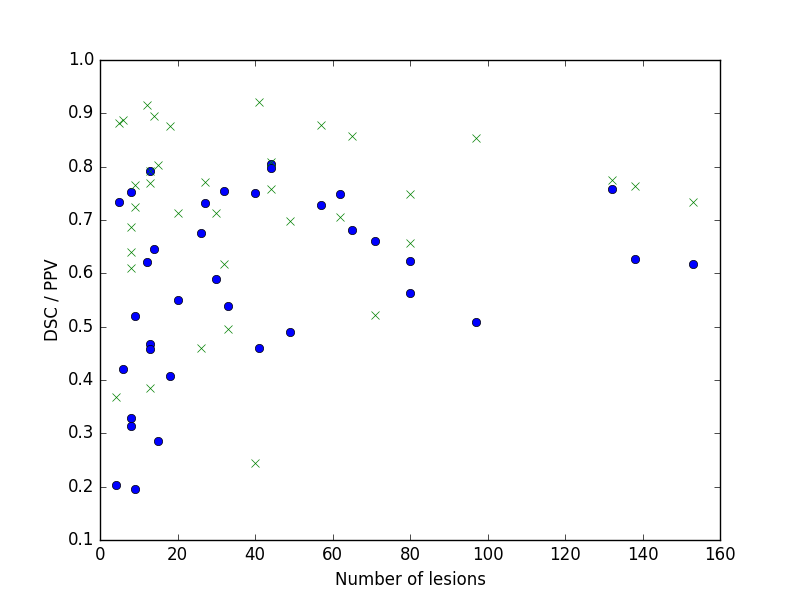
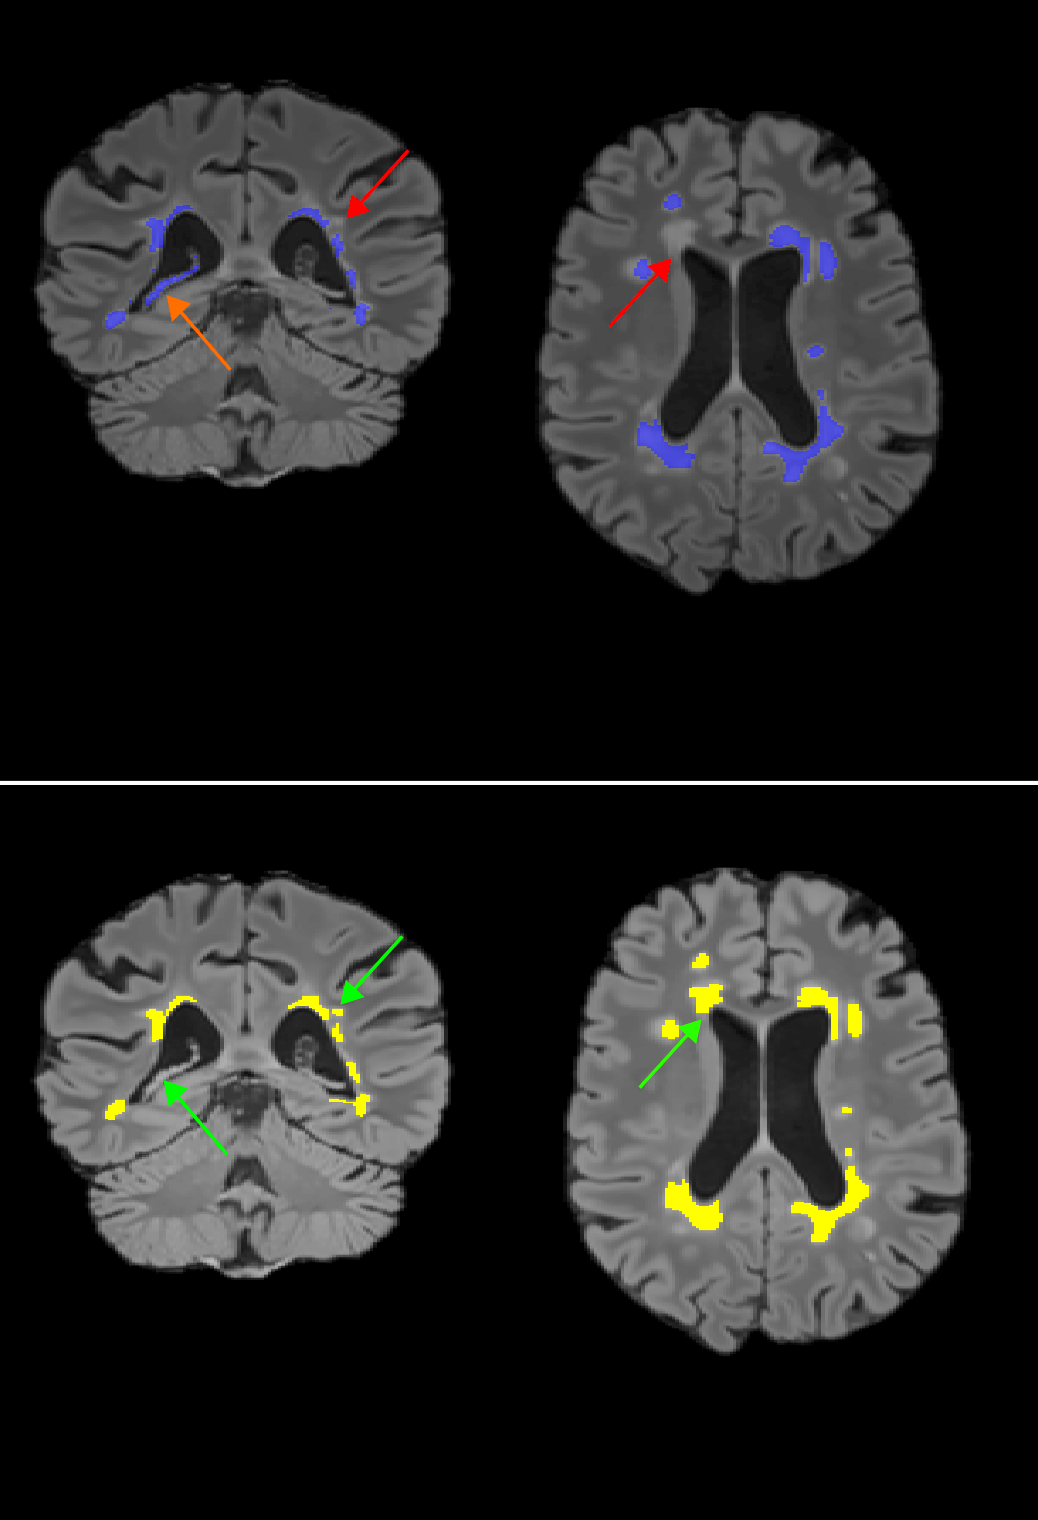
We evaluated the method on 37 MS subjects. Each subject included T1-w, T2-w and FLAIR images. The ground truth was computed using LOP STAPLE12 on six independent manual segmentations per patient. Results are illustrated in Figure 2 and Figure 3. The average Dice Similarity Coefficient (DSC) was 0.578, the average Positive Predictive Value (PPV) was 0.711. An example of segmentation result (without and with priors) is illustrated in Figure 4. The computation time to process a subject on a laptop with an Intel Core i7 CPU 2.40GHz (8 cores) was approximately 10 minutes.DISCUSSION
Results indicate good performance of the proposed method. Three of the MS subjects with low lesion load and low number of lesions obtained a DSC lower than 0.3. This can be partially explained by the low experts’ agreement, which becomes more relevant for a small lesion load. When compared to a Graph-Cuts approach that does not include knowledge from MS lesion priors, our approach shows generally improved performance (average DSC=0.480 on the same dataset).CONCLUSION
We proposed a framework that incorporates tissues and MS lesions probability maps into a Graph-Cuts approach for MS lesions segmentation. Results indicate that integrating a priori information with the information derived from the images can improve the segmentation outcome. The performance of the proposed method relies on the accuracy of the probabilistic atlas and parameters that must be accurately tuned on a training dataset. The method can be easily adapted to be used with different MR sequences (e.g. PD images).Acknowledgements
We are thankful to our colleague Florent Leray (French Life Imaging, Inria, Rennes) who provided technical expertise that greatly assisted the research.References
1. Coupe, P. et al. An optimized blockwise nonlocal means denoising filter for 3-D magnetic resonance images. IEEE Trans. Med. Imaging 27, 425–441 (2008).
2. Commowick, O., Wiest-Daesslé, N. & Prima, S. Block-matching strategies for rigid registration of multimodal medical images. in 2012 9th IEEE International Symposium on Biomedical Imaging (ISBI) 700–703 (2012). doi:10.1109/ISBI.2012.6235644
3. Manjón, J. V. & Coupé, P. volBrain: An Online MRI Brain Volumetry System. Front. Neuroinformatics 10, (2016).
4. Tustison, N. J. et al. N4ITK: improved N3 bias correction. IEEE Trans. Med. Imaging 29, 1310–1320 (2010).
5. Nyul, L. G., Udupa, J. K. & Zhang, X. New variants of a method of MRI scale standardization. IEEE Trans. Med. Imaging 19, 143–150 (2000).
6. Shah, M. et al. Evaluating intensity normalization on MRIs of human brain with multiple sclerosis. Med. Image Anal. 15, 267–282 (2011).
7. Commowick, O., Wiest-Daesslé, N. & Prima, S. Automated diffeomorphic registration of anatomical structures with rigid parts: application to dynamic cervical MRI. Med. Image Comput. Comput.-Assist. Interv. MICCAI Int. Conf. Med. Image Comput. Comput.-Assist. Interv. 15, 163–170 (2012).
8. Anima-Public: Open source software for medical image processing from the VISAGES team. (Inria Visages research team, 2017).
9. García-Lorenzo, D., Lecoeur, J., Arnold, D. L., Collins, D. L. & Barillot, C. Multiple sclerosis lesion segmentation using an automatic multimodal graph cuts. Med. Image Comput. Comput.-Assist. Interv. MICCAI Int. Conf. Med. Image Comput. Comput.-Assist. Interv. 12, 584–591 (2009).
10. García-Lorenzo, D., Prima, S., Arnold, D. L., Collins, D. L. & Barillot, C. Trimmed-likelihood estimation for focal lesions and tissue segmentation in multisequence MRI for multiple sclerosis. IEEE Trans. Med. Imaging 30, 1455–1467 (2011).
11. A Logarithmic Opinion Pool Based STAPLE Algorithm for the Fusion of Segmentations With Associated Reliability Weights - IEEE Journals & Magazine. Available at: http://ieeexplore.ieee.org/document/6832625/. (Accessed: 5th November 2017)
12. Commowick, O., Cervenansky, F. & Ameli, R. MSSEG Challenge Proceedings: Multiple Sclerosis Lesions Segmentation Challenge Using a Data Management and Processing Infrastructure. (2016).
13. Guimond, A., Meunier, J. & Thirion, J.-P. Average Brain Models. Comput Vis Image Underst 77, 192–210 (2000).
Figures