1982
Evolution of functional and structural connectivity of motor network during 2 years of fingolimod therapy for multiple sclerosis1Imaging Institute, Cleveland Clnic, Cleveland, OH, United States, 2Radiology, Cleveland Clinic Lerner College of Medicine, Cleveland, OH, United States, 3Neurological Institute, Cleveland Clnic, Cleveland, OH, United States, 4Quantitative Health Sciences, Cleveland Clnic, Cleveland, OH, United States
Synopsis
Evolution of resting state functional connectivity (fcMRI) between right and left primary motor cortices, and structural connectivity along corticospinal tract (CST) during 2 years of Filgolimod therapy of patients with multiple sclerosis were investigated. MS patients were scanned at baseline (just prior to start of treatment), 6, 12, 18 and 24 months after the start of treatment. Using echoplanar imaging for fcMRI and high angular resolution diffusion imaging for assessing normal appearing white matter integrity along CST, it was found that both functional and structural connectivity damage of motor network stabilized after one year of fingolimod treatment.
Introduction
Reduction in the rate of relapses for patients with relapsing-remitting multiple sclerosis (RRMS) under neuromodulatory oral drug fingolimod has been reported1. However, disease progression may occur despite effective control of inflammation2. Functional imbalance in and between brain networks3, as well as reduced right- and left-hemisphere primary motor cortices (M1) resting state functional connectivity (fcMRI) has been reported in MS4. Diffusion tensor imaging (DTI) provides quantitative measures of tissue integrity (structural connectivity) in Normal Appearing White Matter (NAWM), and has revealed increased transverse diffusivity (TD), associated with impaired NAWM integrity, with worsening of upper limb motor performance in MS5. In a longitudinal study of the effect of fingolimod on the above-mentioned imaging metrics, we detected evolution of (i) fcMRI between left and right M1 and (ii) white matter injury in corticospinal tract (CST) in order to investigate changes in motor network during 2 years of fingolimod treatment.. In addition, we also followed upper limb motor performance, as measured by 9 hole peg test (9HPT), over the same time period.Methods
Twenty five subjects (age: 42.0±8.6, 10 male) with MS were scanned under an IRB-approved protocol at 3T prior to, 6, 12, 18 and 24 months after initiation of fingolimod treatment. During he study, the whole body Siemens scanner was upgraded from Tim Trio to Prisma (Siemens Healthineers, Erlangen, Germany), which was associated with a change of receive coil from a 12 channel head coil to a 20 channel (16 head + 4 spine) coil. A bite bar was used to minimize subject motion, and the subjects were instructed to lie still in the scanner with eyes closed during the fcMRI scan. fcMRI scan parameters were: TR/TE=2800/29 ms, 31 slices, slice thickness 4 mm, no gap, 128×128 matrix, 256 mm×256 mm FOV, bandwidth 1954 Hz/pixel, 6/8 partial Fourier, 137 repetitions. Cardiac and respiratory fluctuations were monitored using a pulse oximeter and respiratory bellows, respectively. DTI was acquired using a high angular resolution diffusion imaging (HARDI) protocol with scan parameters 2mm isotropic, 71 diffusion-weighting gradients with b=1000sec/mm2 and 8 b=0 volumes, NEX=4. 9HPT data were collected by measuring time taken by patients to place 9 pegs into 9 holes of a block by both the dominant and non-dominant hands. fcMRI data were corrected for motion, and physiologic noise, detrended, and low-pass filtered.6, 7 Nine-voxel in-plane seeds at right and left M1 were placed using a previously described procedure,8 a whole brain correlation map was created with the left M1 seed and the mean correlation within the right M1 seed was computed. Diffusion tensor images were calculated after motion correction.9 The left and right CST was mapped in each subject by probabilistic tractography10 between M1 and ipsilateral cerebral peduncle, resulting in a track density map. Patterns of change of 9HPT over 24 months on fingolimod were determined using a random effects mixed model in GLIMMIX that examined the time/visit effect while considering correlation within the same patient.11 Due to the scanner upgrade, analyses of fcMRI and TD change across time were performed using multilevel models in the GLIMMIX procedure.11 Several contrast structures were set in the analyses to estimate the overall change (test for trend), change from baseline to 12-month and from 12-month to 24-month visits. All analyses were performed using SAS version 9.4 (SAS Institute, Cary, NC). Two-sided p-values were presented, p<0.05 was considered to be statistically significant.Results and Discussion
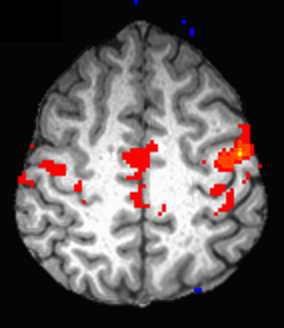
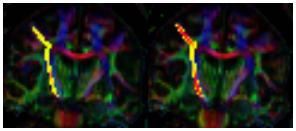
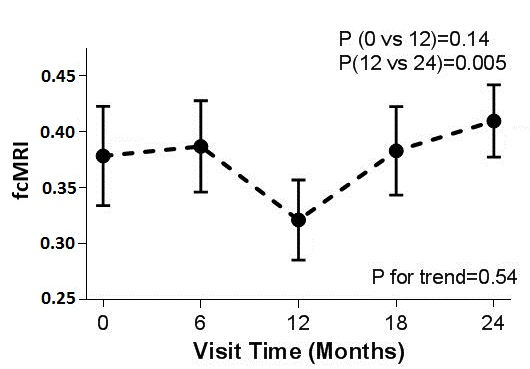
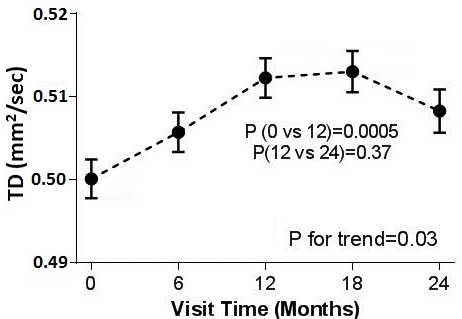
Representative images of fcMRI map and CST tracking are shown in Fig. 1 and Fig. 2 respectively. No difference in TD between left and right hemispheres was observed and hence the mean TD was used in the analysis. Although no significant trend of change in fcMRI was observed over 24 months, connectivity showed a slight decrease (albeit not statistically significant) in the 1st year and significant increase in the 2nd year of treatment (Fig. 3). A significant increase in TD was observed over 24 months, although the TD stabilized after the 1st year (Fig. 4). Both these observations suggest that fingolimod treatment stabilized damage of structural and functional connectivity of motor network sometime around/after the 1st year of treatment. The 9HPT scores did not show any change with the treatment suggesting that imaging metrics may be preceding clinical measures in detecting disease progression.Conclusion
Functional and structural connectivity impairment of motor network as measured by DTI and fcMRI stabilized after one year of fingolimod treatment in MS.Acknowledgements
We are grateful to Novartis for funding this project. We thank Thorsten Feiweier of Siemens
Healthineers for developing the DTI pulse sequence and the monopolar+
functionality that was used in this study.
References
1. Sanford M. Fingolimod: a review of its use in relapsing-remitting multiple sclerosis. Drugs. 2014;74(12):1411-1433.
2. https://www.novartis.com/news/media-releases/novartis-provides-update-fingolimod-phase-iii-trial-primary-progressive-ms-ppms.
3. Filippi M, Agosta F, Spinelli EG, Rocca MA. Imaging resting state brain function in multiple sclerosis. J Neurol. 2013;260(7):1709-1713.
4. Lowe MJ, Phillips MD, Lurito JT, Mattson D, Dzemidzic M, Mathews VP. Multiple sclerosis: low-frequency temporal blood oxygen level-dependent fluctuations indicate reduced functional connectivity initial results. Radiology. 2002;224(1):184-192.
5. Lowe MJ, Horenstein C, Hirsch JG, Marrie RA, Stone L, Bhattacharyya PK, Gass A, Phillips MD. Functional pathway-defined MRI diffusion measures reveal increased transverse diffusivity of water in multiple sclerosis. Neuroimage. 2006;32(3):1127-1133.
6. Beall EB, Lowe MJ. SimPACE: generating simulated motion corrupted BOLD data with synthetic-navigated acquisition for the development and evaluation of SLOMOCO: a new, highly effective slicewise motion correction. Neuroimage. 2014;101:21-34.
7. Glover GH, Li TQ, Ress D. Image-based method for retrospective correction of physiological motion effects in fMRI: RETROICOR. Magn Reson Med. 2000;44(1):162-167.
8. Lowe MJ, Koenig KA, Beall EB, Sakaie KA, Stone L, Bermel R, Phillips MD. Anatomic connectivity assessed using pathway radial diffusivity is related to functional connectivity in monosynaptic pathways. Brain Connect. 2014;4(7):558-565.
9. Sakaie KE, Lowe MJ. Quantitative assessment of motion correction for high angular resolution diffusion imaging. Magn Reson Imaging. 2010;28(2):290-296.
10. Lowe MJ, Beall EB, Sakaie KE, Koenig KA, Stone L, Marrie RA, Phillips MD. Resting state sensorimotor functional connectivity in multiple sclerosis inversely correlates with transcallosal motor pathway transverse diffusivity. Hum Brain Mapp. 2008;29(7):818-827.
11. Brown H, Prescott R. Applied Mixed Models in Medicine. Norwood, MA: Artech Hhouse; 1999.
Figures