1981
Biophysically meaningful MRI features for accurate classification of multiple sclerosis phenotypes1Queen Square MS Centre, Department of Neuroinflammation, UCL Institute of Neurology, Faculty of Brain Sciences, University College London, London, United Kingdom, 2Department of Medical Physics and Biomedical Engineering, University College London, London, United Kingdom, 3Centre for Medical Image Computing, Department of Computer Science, University College London, London, United Kingdom, 4Translational Imaging Group, Centre for Medical Image Computing, Medical Physics and Biomedical Engineering, University College London, London, United Kingdom, 5National Hospital of Neurology and Neurosurgery, London, United Kingdom, 6Department of Brain and Behavioral Sciences, University of Pavia, Pavia, Italy, 7Brain MRI 3T Research Centre, C. Mondino National Neurological Institute, Pavia, Italy
Synopsis
Quantitative MRI can provide maps of biophysically meaningful features (BMFs) that can be exploited using machine learning techniques to better correlate MR alterations with multiple sclerosis (MS) severity, and improve our understanding of the disease. In this study, a random forest classifier was trained over a rich multi-modal quantitative MRI dataset of healthy controls and MS patients with different phenotypes, to find the BMFs that best characterise disease course. Inflammation and atrophy were the most significant BMFs in distinguishing between controls and patients, with microstructural alterations arising particularly when comparing subjects who only experienced a clinically isolated syndrome with patients and controls.
Introduction
Conventional MRI readouts, such as T2-weighted hyperintense lesion count/volume, are routinely used for multiple sclerosis (MS) diagnosis. However, these are only sensitive to macroscopic alterations, and do not detect early microscopic damage1. On the other hand, biophysically meaningful features (BMFs) from quantitative MRI (qMRI) can be exploited by machine learning techniques to detect early microstructural abnormalities and better correlate MRI changes to disease severity, potentially leading to more accurate prognosis and treatment monitoring2. In this study, we analysed with machine learning a unique set of qMRI multi-modal features extracted from a cohort of healthy controls (HC) and patients with relapse-onset MS followed up after 15 years from the time of clinically isolated syndrome (CIS). The analysis, which uses a random forest classifier, aimed to find the features that best distinguish among MS phenotypes.Methods
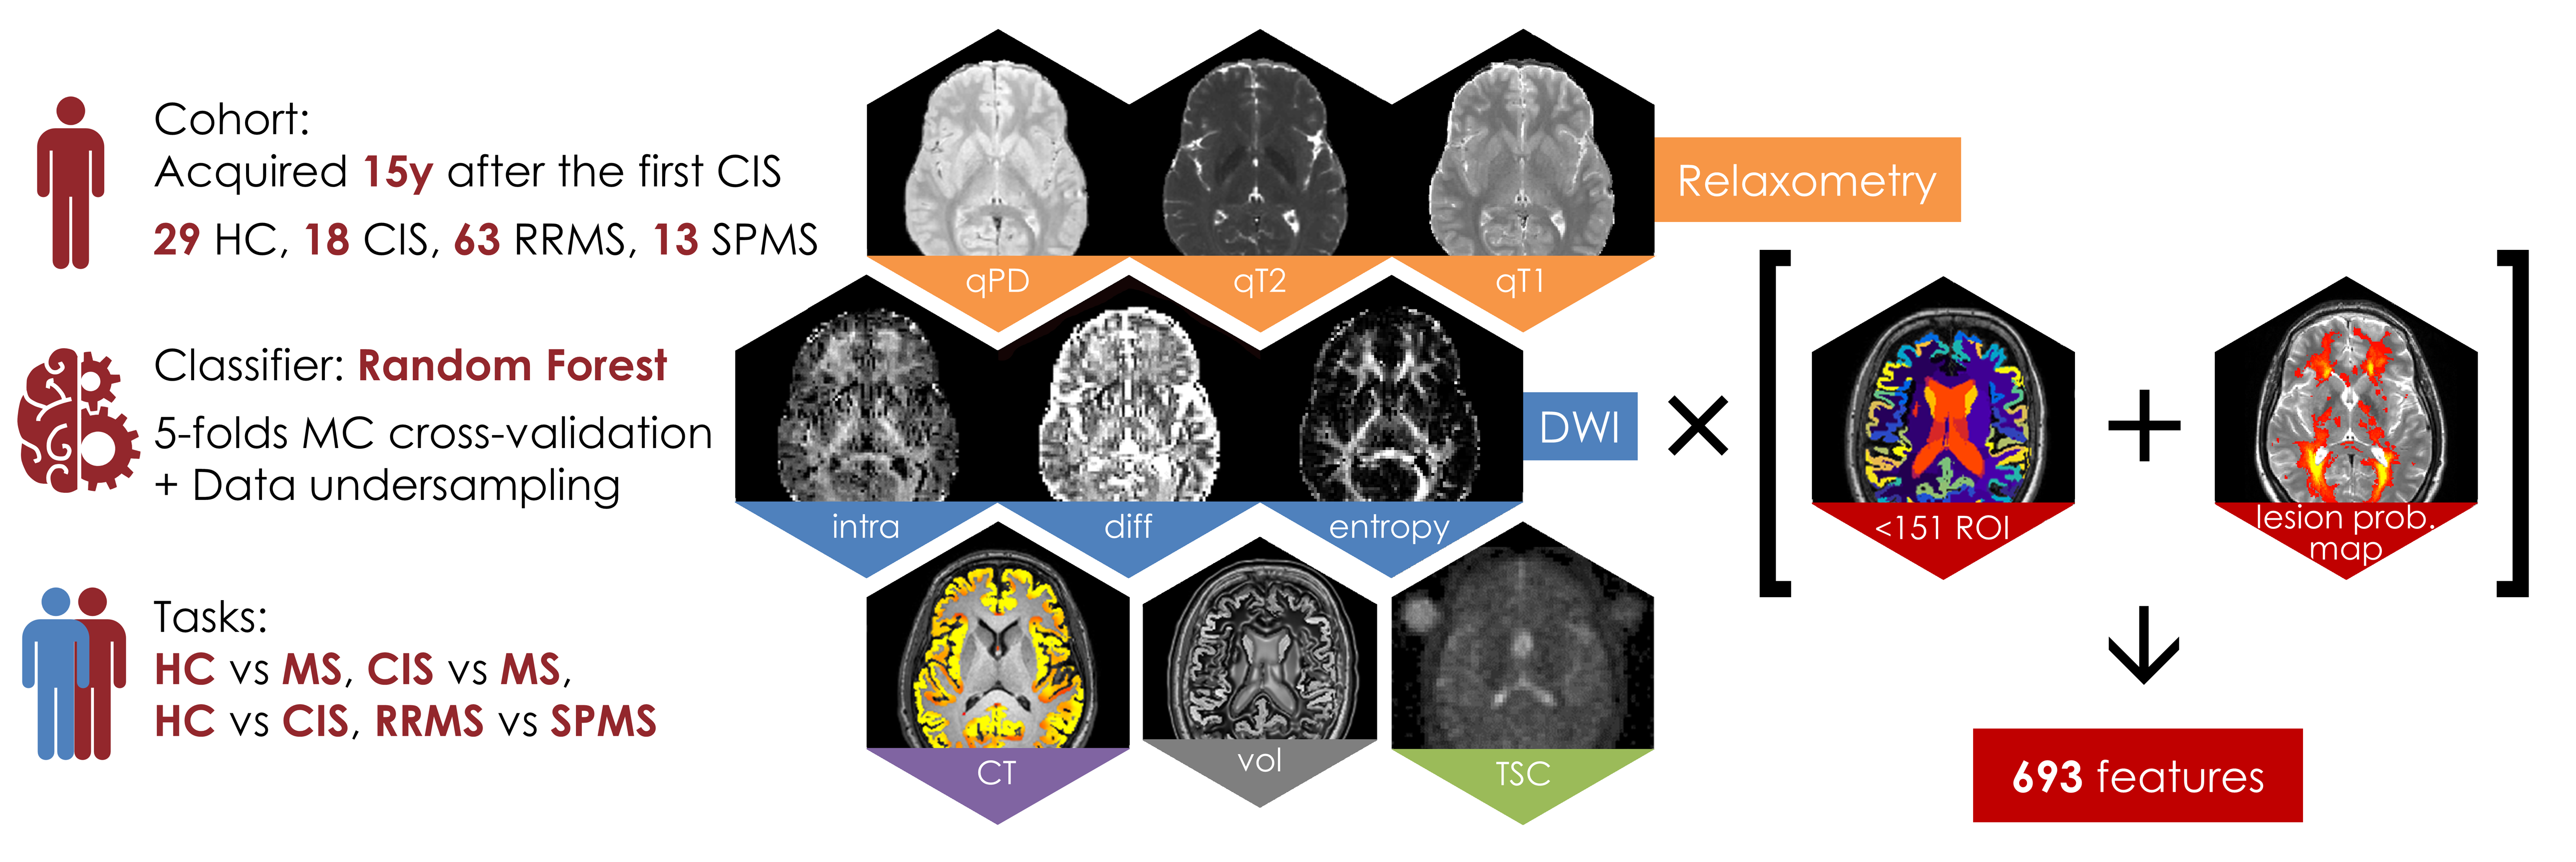
Cohort: The cohort consisted of a total of 123 subjects: 29 HC, 18 CIS, 63 relapsing-remitting MS (RRMS) and 13 secondary progressive MS (SPMS) patients with same disease duration, who were scanned on a 3T Philips Achieva MR system(Fig.1).
BMFs extraction: The extracted MRI BMFs were: relaxometry measurements, specifically quantitative proton density (qPD), T2 (qT2) and T1 (qT1); diffusion-derived measurements, namely intra-neurite volume fraction (intra), intrinsic diffusivity (diff) and neurite orientation dispersion entropy from the Spherical Mean Technique3; cortical thickness (CT), region-of-interest (ROI) volume (vol) and quantitative total sodium concentration (TSC)4(Fig.1). Relaxometry maps were extracted from clinical PD/T2 and T1 weighted turbo spin-echo images5,6. ROIs were generated using GIF parcellation7 after lesion filling8. The mean value of each metric over each ROI was computed and averaged between left and right regions. The weighted mean of relaxometry, diffusion and sodium features over a probabilistic lesion map and normal appearing white matter were also added, for a total of 693 features. The probabilistic lesion map was computed by averaging patients’ lesion maps on a halfway space, and then transforming it back onto each subject’s native space. The weighted mean of each BMF over the probabilistic lesion map was then calculated.
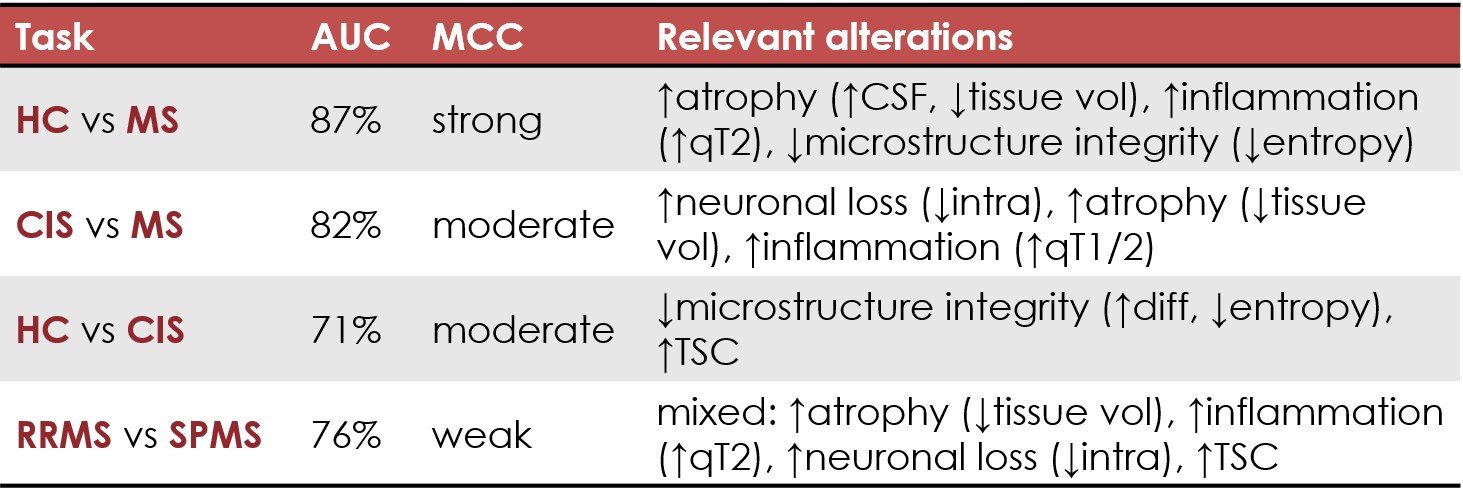
Machine learning analysis: Classification using random forest was carried over multiple tasks: HC vs MS patients, HC vs CIS, CIS vs MS patients, and RRMS vs SPMS. Receiver operating characteristic (ROC) area under the curve (AUC) and Matthew’s correlation coefficient (MCC)9 were calculated to assess classification performances. Finally, variable importance was evaluated to quantify the contribution of each feature to the classification tasks.
Results
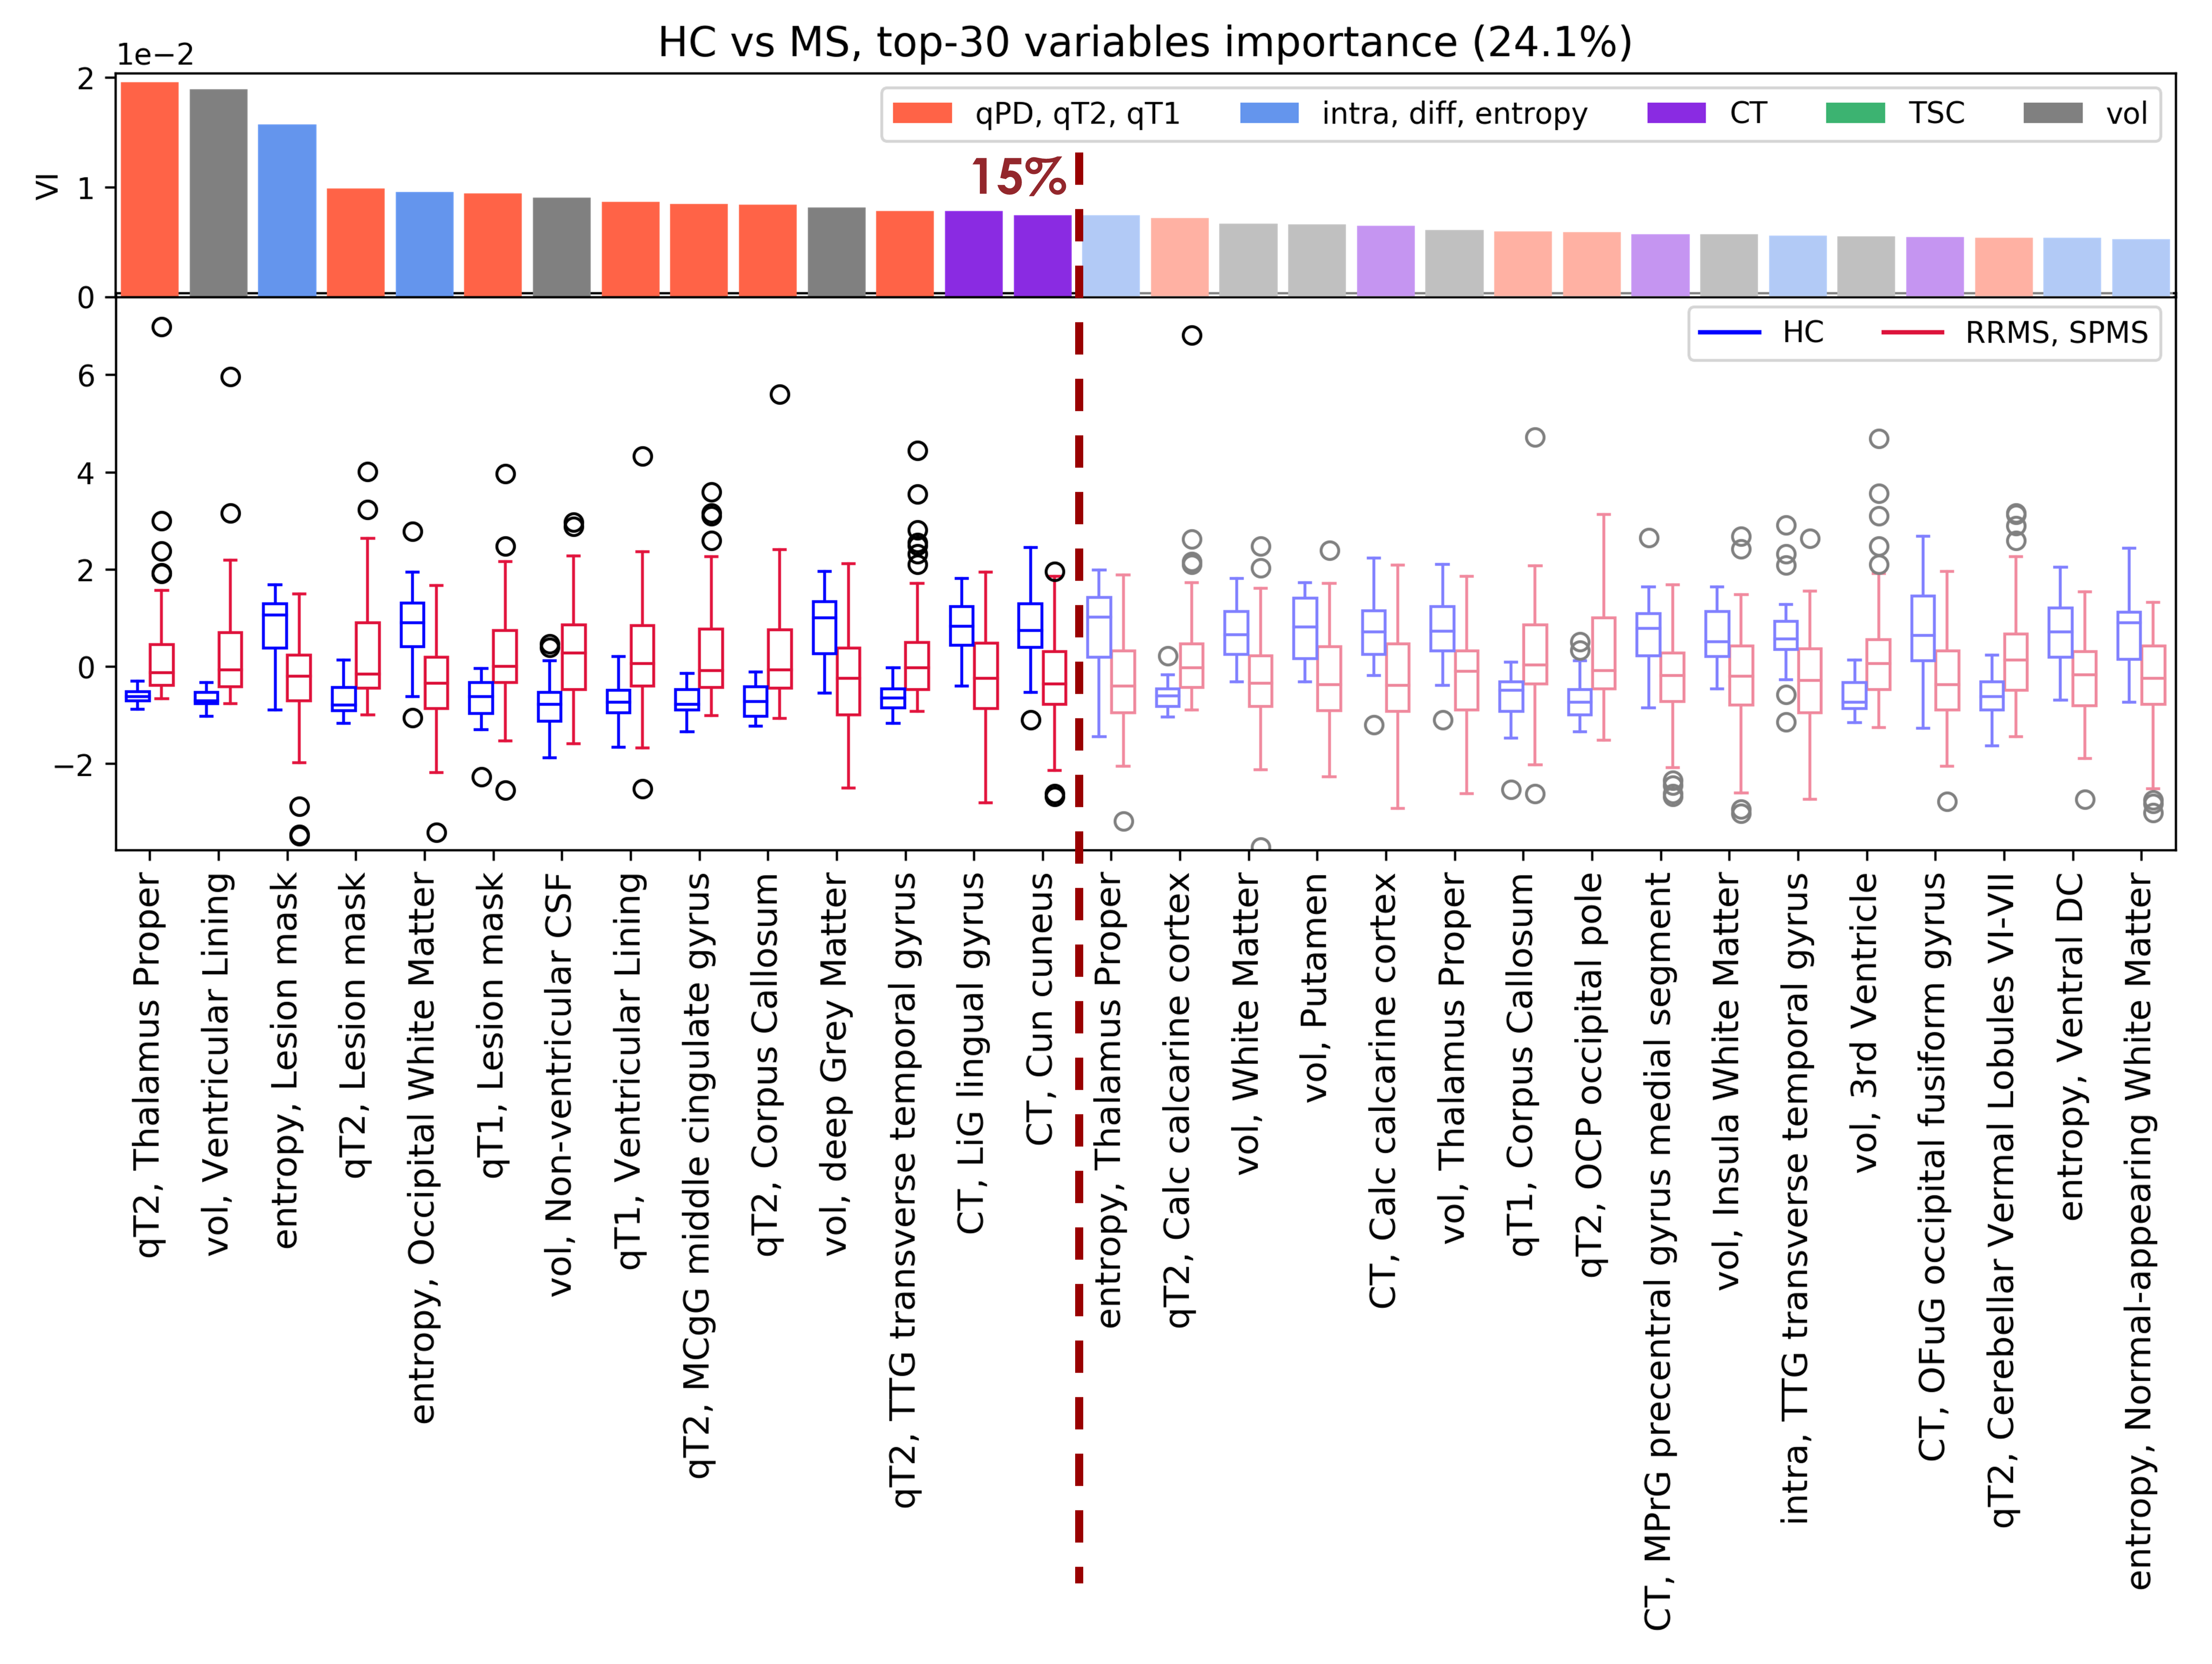
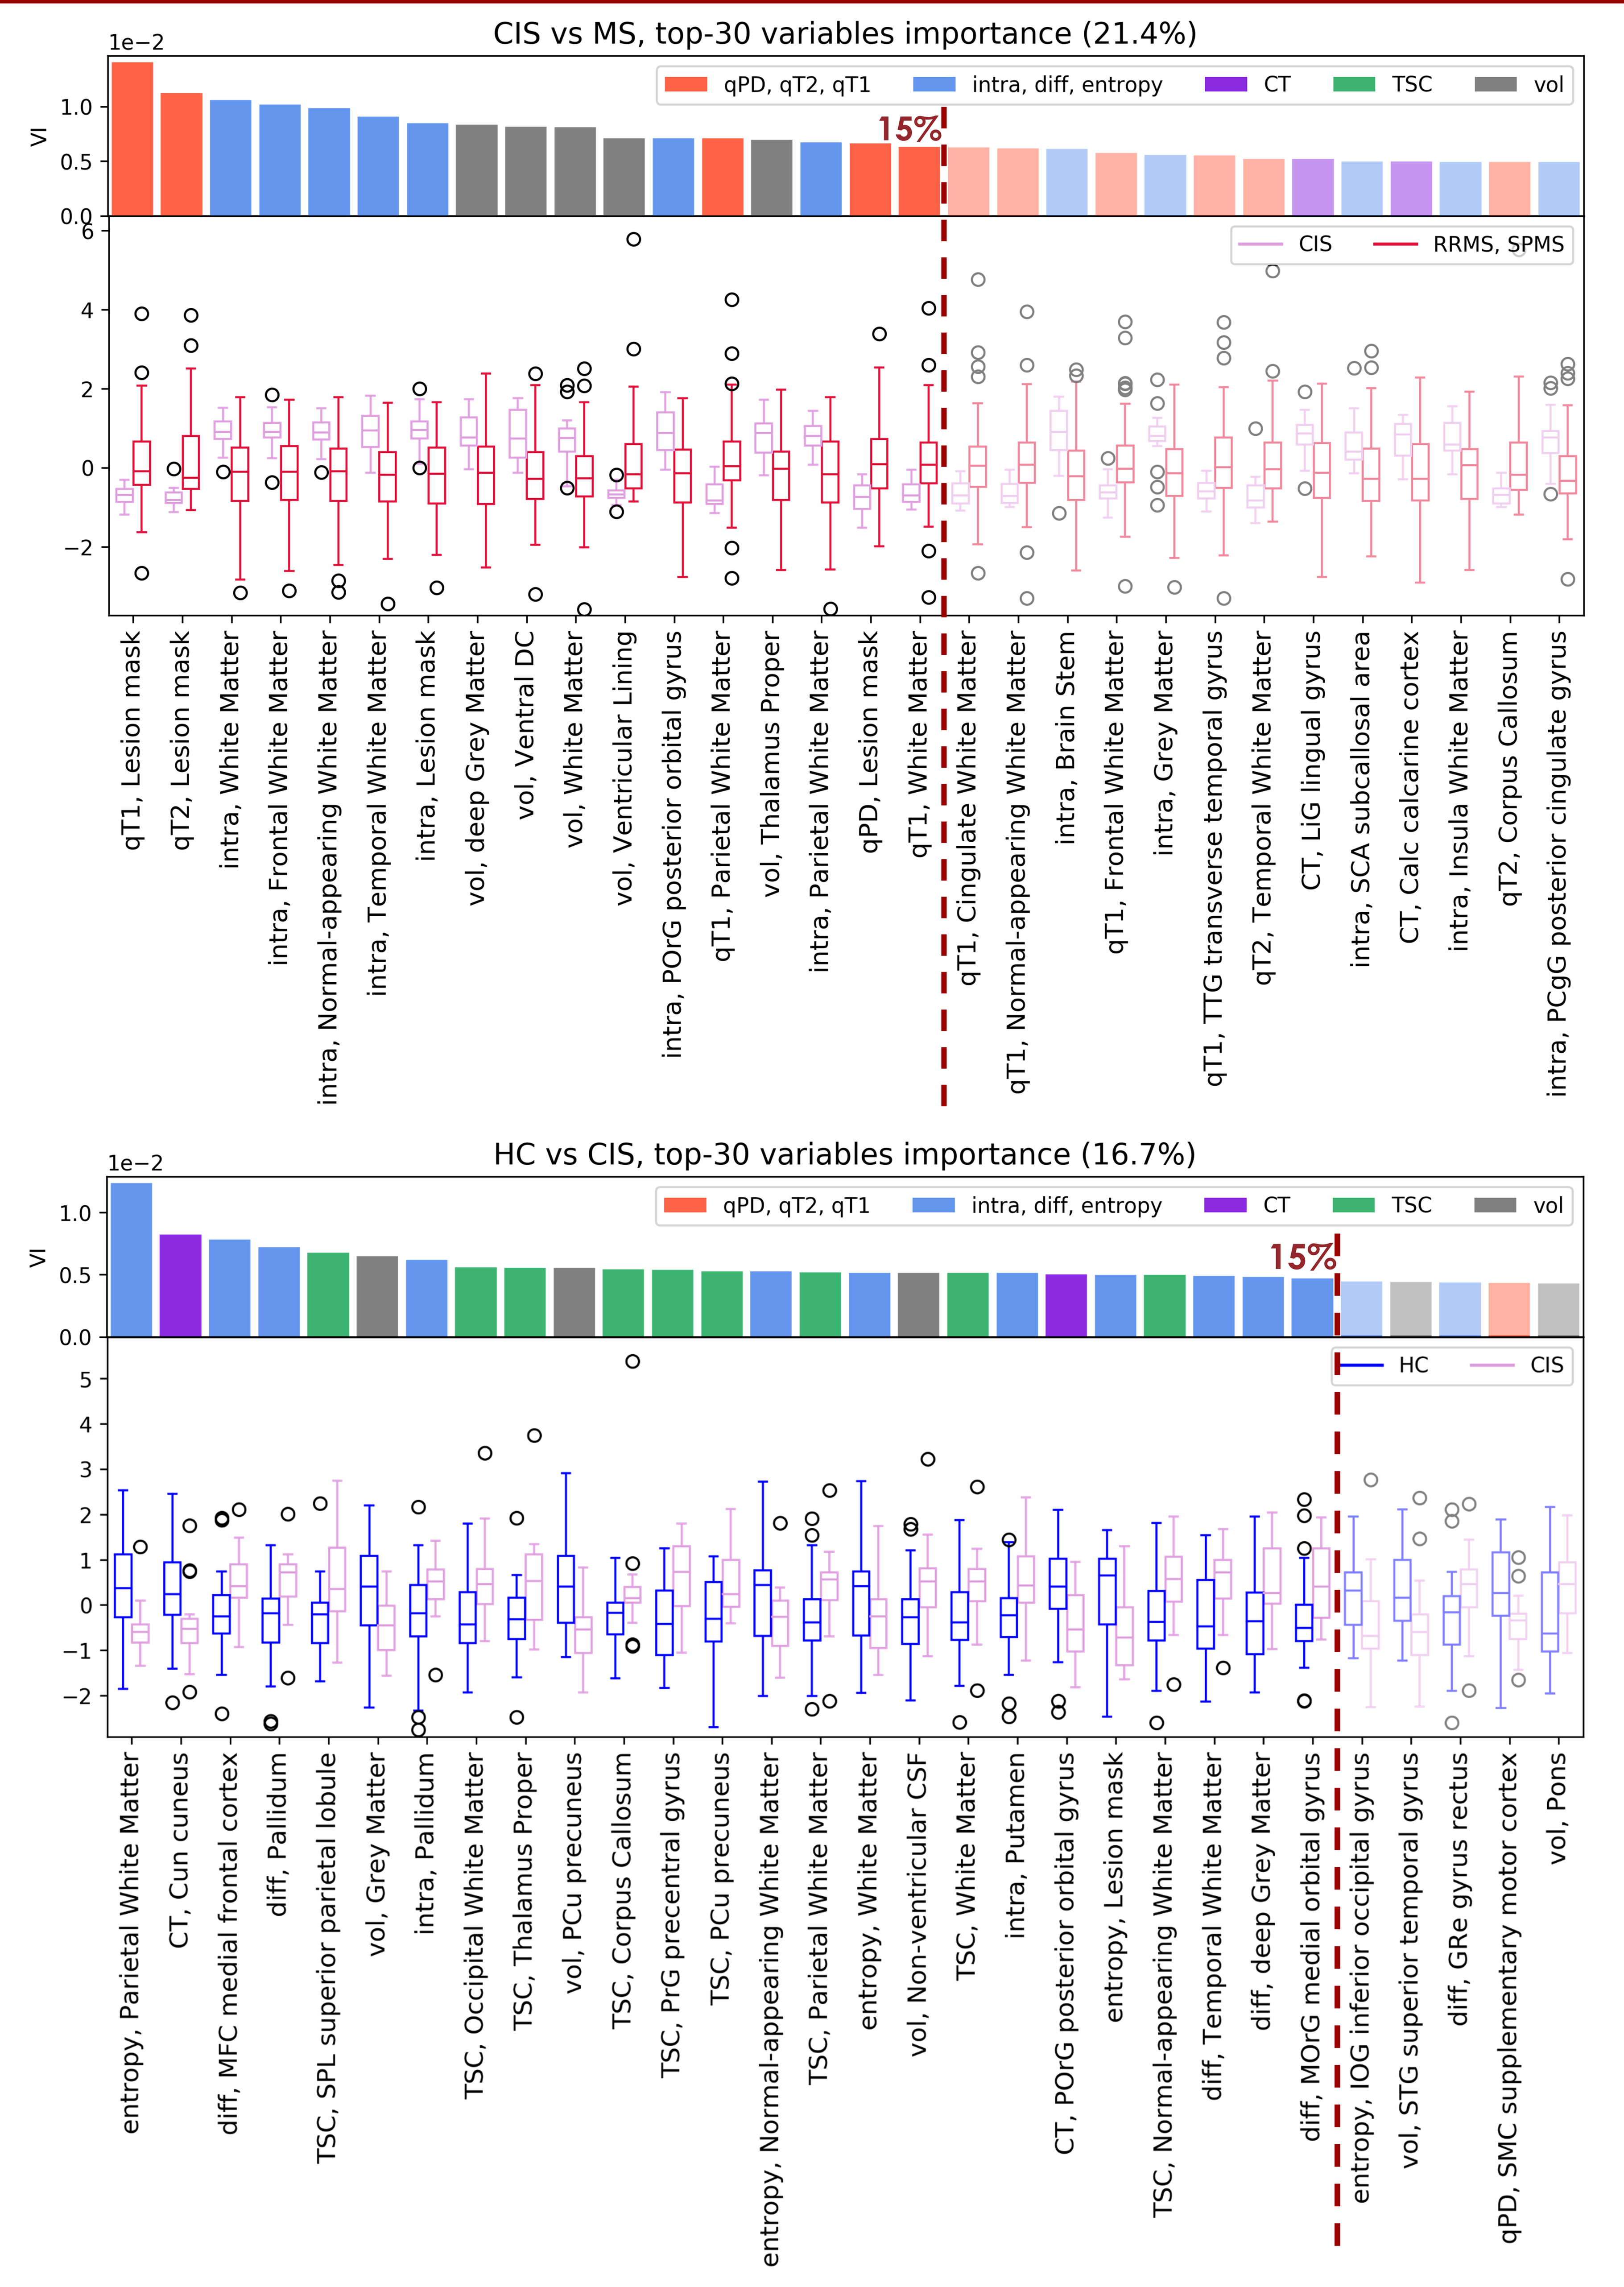
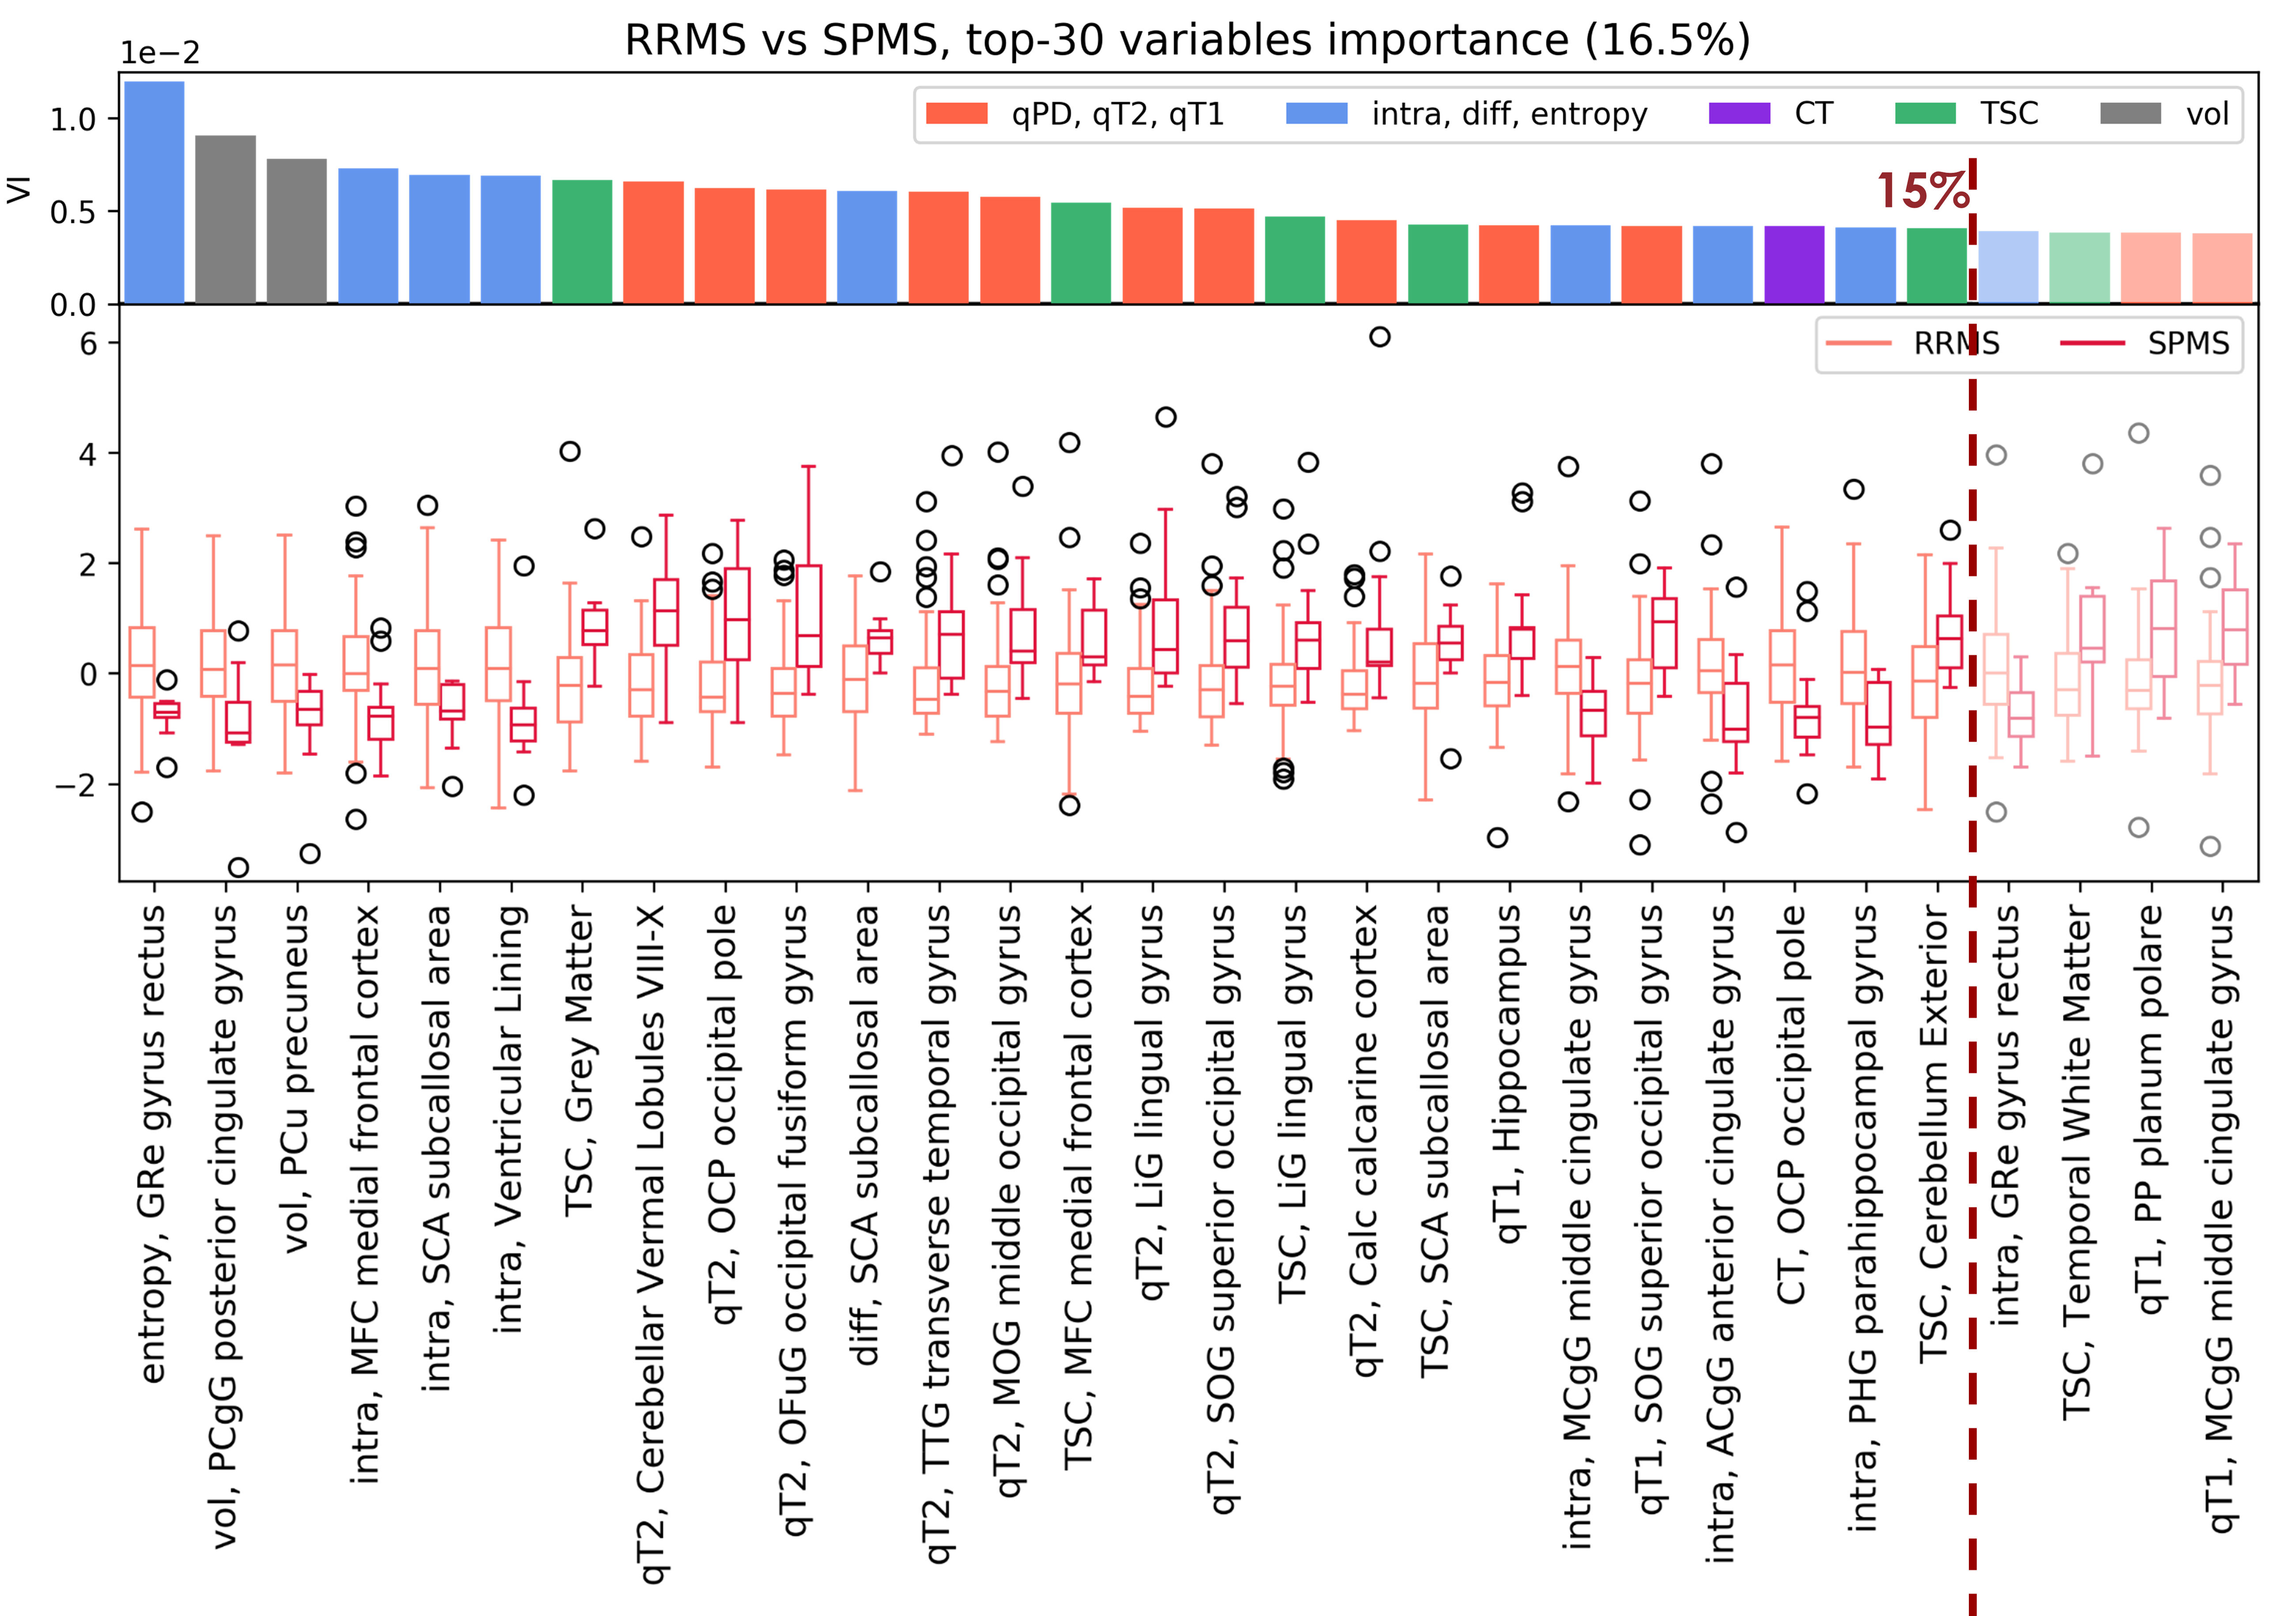
AUC and MCC scores are reported in Fig.2. Distinct features appeared to be relevant for each classification task. Within the top 15th percentile of variable importance, widespread qT2, volume and orientation dispersion entropy were the most relevant features for the classification of HC vs MS patients(Fig.3). Diffusion-derived microstructural BMFs acquired more importance when CIS was introduced in the classification. Together with qT1, qT2 and volume, intra appeared to be important for CIS vs MS, while diff and TSC emerged when distinguishing HC vs CIS(Fig.4). A combination of features, including qT2, intra, volume and TSC characterised the RRMS vs SPMS classification(Fig.5).Discussion
This study assessed the potential of multi-modal qMRI and machine learning for accurate MS subtype characterisation, using a unique data-set of HC and MS patients. Compared to HC, MS patients presented a significantly higher degree of tissue derangement, inflammation and atrophy, highlighted by qT2 and volume alterations, for example in thalamus, which agrees with known disease course10, together with a reduction of axon orientation coherence, given by the lower orientation dispersion entropy. In addition to inflammation and atrophy, neuronal disruption in white matter, indicated by lower intra, was observed in patients with MS at 15 years compared to patients who remained CIS. Changes in microstructural diffusion-based BMFs could therefore represent an important factor in the development of MS in CIS patients. CIS patients showed a reduction of tissue microstructure integrity compared to HC, as suggested by the increase of neurite orientation entropy and reduction of diff, together with an increase in TSC. These alterations might be a long term consequence of the first clinical episode, which cannot be detected with gross macroscopic MRI measurements. Finally, the low performance and mixed top-rank feature pattern characterising the RRMS vs SPMS classification task suggest that the two groups are more similar from a BMF point of view than expected, therefore such phenotype categorisation might need the support of clinical assessment.Conclusion
We conclude that multi-modal qMRI provides unique microstructural features that are highly informative for distinguishing among MS subtypes. They convey complementary information to conventional macroscopic readouts, characterising disease heterogeneity at a level that may more closely reflect MS histopathology.Acknowledgements
This work is supported by the Engineering and Physical Sciences Research Council (EPSRC: EP/M020533/1); the Horizon2020-EU.3.1 (634541) grant; the UK Multiple Sclerosis Society (892/08) and the Department of Health’s National Institute for Health Research Biomedical Research Centres (BRC R&D03/10/RAG0449).References
[1] Barkhof, F. (2002). The clinico-radiological paradox in multiple sclerosis revisited. Current Opinion in Neurology; 15, 239-245
[2] Bakshi, R., Thompson, A. J., Rocca, M. A., Pelletier, D., Dousset, V., Barkhof, F., … Filippi, M. (2008). MRI in multiple sclerosis: current status and future prospects. The Lancet Neurology; 7(7), 615-625. 10.1016/S1474-4422(08)70137-6
[3] Kaden, E., Kelm, N. D., Carson, R. P., Does, M. D., and Alexander, D. C. (2016). Multi-compartment microscopic diffusion imaging. NeuroImage; 139, 346–359. 10.1016/j.neuroimage.2016.06.002
[4] Prados, F., Solanky, B. S., Alves Da Mota, P., Cardoso, M. J., Brownlee, W. J., Riemer, F., Miller, DH., Golay, X., Wheeler-Kingshott, C. A. M., Ourselin, S. (2016). Automatic sodium maps reconstruction using PatchMatch algorithm for phantom detection. In Annual Meeting ISMRM-ESMRM.
[5] Volz, S., Nöth, U., Jurcoane, A., Ziemann, U., Hattingen, E., and Deichmann, R. (2012). Quantitative proton density mapping: correcting the receiver sensitivity bias via pseudo proton densities. Neuroimage; 63(1), 540-52. 10.1016/j.neuroimage.2012.06.076
[6] Anderson, S. W., Sakai, O., Soto, J. A. and Jara, H. (2013), Improved T2 mapping accuracy with dual-echo turbo spin echo: Effect of phase encoding profile orders. Magn Reson Med, 69: 137–143. doi:10.1002/mrm.24213
[7] Cardoso, M. J., Wolz, R., Modat, M., Fox, N. C., Rueckert, D., and Ourselin, S. (2015). LNCS 7511 - Geodesic Information Flows. IEEE Trans Med Imaging; 34(9): 1976–1988. 10.1109/TMI.2015.2418298
[8] Prados F, Cardoso MJ, Kanber B, Ciccarelli O, Kapoor R, Gandini Wheeler-Kingshott CAM, Ourselin S. (2016). A multi-time-point modality-agnostic patch-based method for lesion filling in multiple sclerosis. Neuroimage, 139, 376-384.
[9] Powers, D. M. W. (2011). Evaluation: from precision, recall and F-measure to ROC, informedness, markedness and correlation. Journal of Machine Learning Technologies, 2(1), 37-63.
[10] Lassmann, H., van Horssen, J., and Mahad, D. (2012). Progressive multiple sclerosis: pathology and pathogenesis. Nature Reviews Neurology; 8: 647–656. 10.1038/nrneurol.2012.168
Figures