1980
Sufficient Gradient Sampling for Diffusion Tensor Imaging in Clinical Trials1Imaging Institute, The Cleveland Clinic, Cleveland, OH, United States, 2Keller Center for Imaging Innovation, Barrow Neurological Institute, Phoenix, AZ, United States, 3Neurological Institute, The Cleveland Clinic, Cleveland, OH, United States
Synopsis
Although many diffusion-weighting gradients are desirable for diffusion MRI, implementation may be difficult in a multicenter trial for practical reasons. This study retrospectively examines the adequacy of using as few as 6 directions, the minimum required for calculating the diffusion tensor, for tissue microstructure measurements.
Introduction
he ideal number of diffusion-weighting gradient directions for diffusion tensor imaging (DTI) has been discussed extensively. More directions are desirable for reliable tractography (1) and concordance of tensor measures (2). However, in a clinical trial, maximizing the number of sites may take priority over implementing optimal imaging. At many sites, it can be difficult or impossible to implement more than 6 or 12 directions. To determine minimal criteria for DTI in a multicenter trial, we retrospectively examine diffusion tensor measures from data acquired from the SPRINT-MS trial (3).Methods
Under an IRB-approved protocol, subjects were scanned at 27 sites at 3 tesla with a HARDI acquisition featuring 2.5 mm isotropic voxels, 64 diffusion-weighting gradients (b=700mm2/sec) and 8 b=0 acquisitions (3). Probabilistic tractography identified corticospinal tract, and mean microstructure parameters (mean diffusivity (MD), fractional anisotropy (FA), axial diffusivity (AD), radial diffusivity (RD)), weighted by track density were calculated (4). Baseline data from 221 subjects was used. For each subject, microstructure parameters were recalculated using 100 different subsets each with 6 or 12 of the 64 directions and one b=0 acquisition. Each of the 100 subsets were evenly spaced across the sphere (5), and the b=0 acquisition was chosen at random.Results
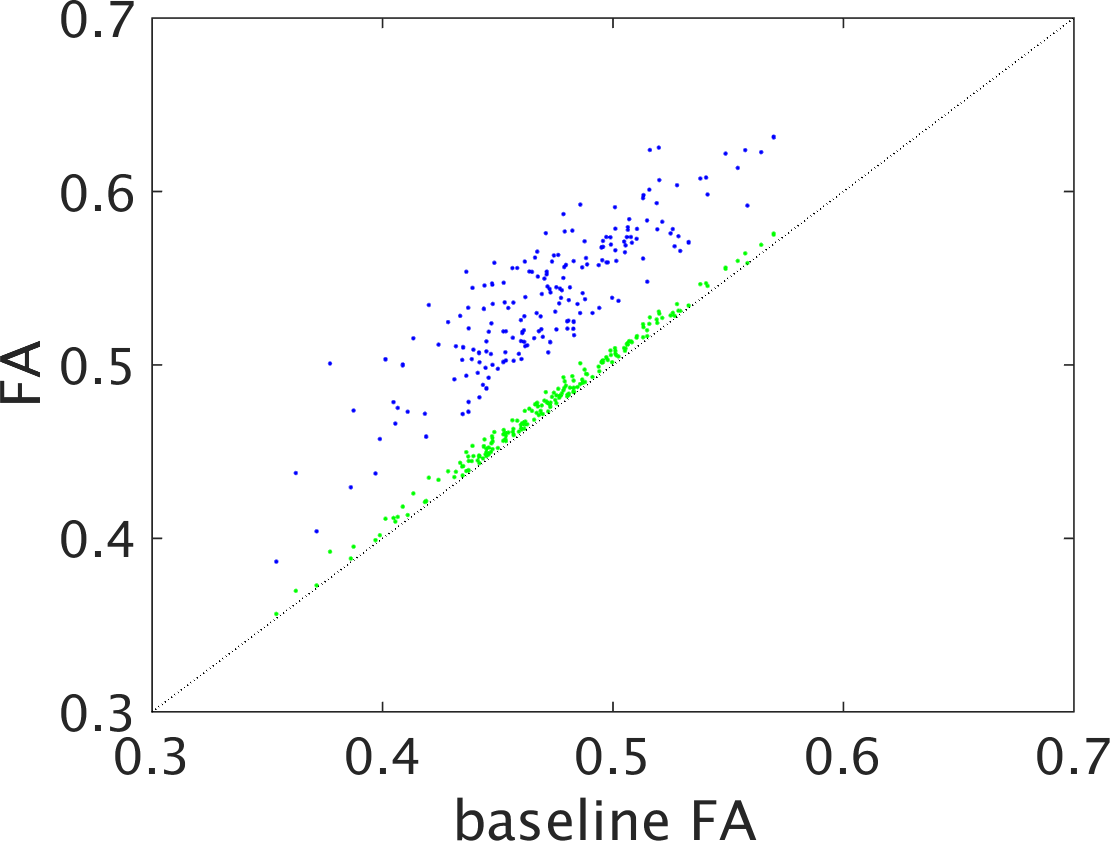
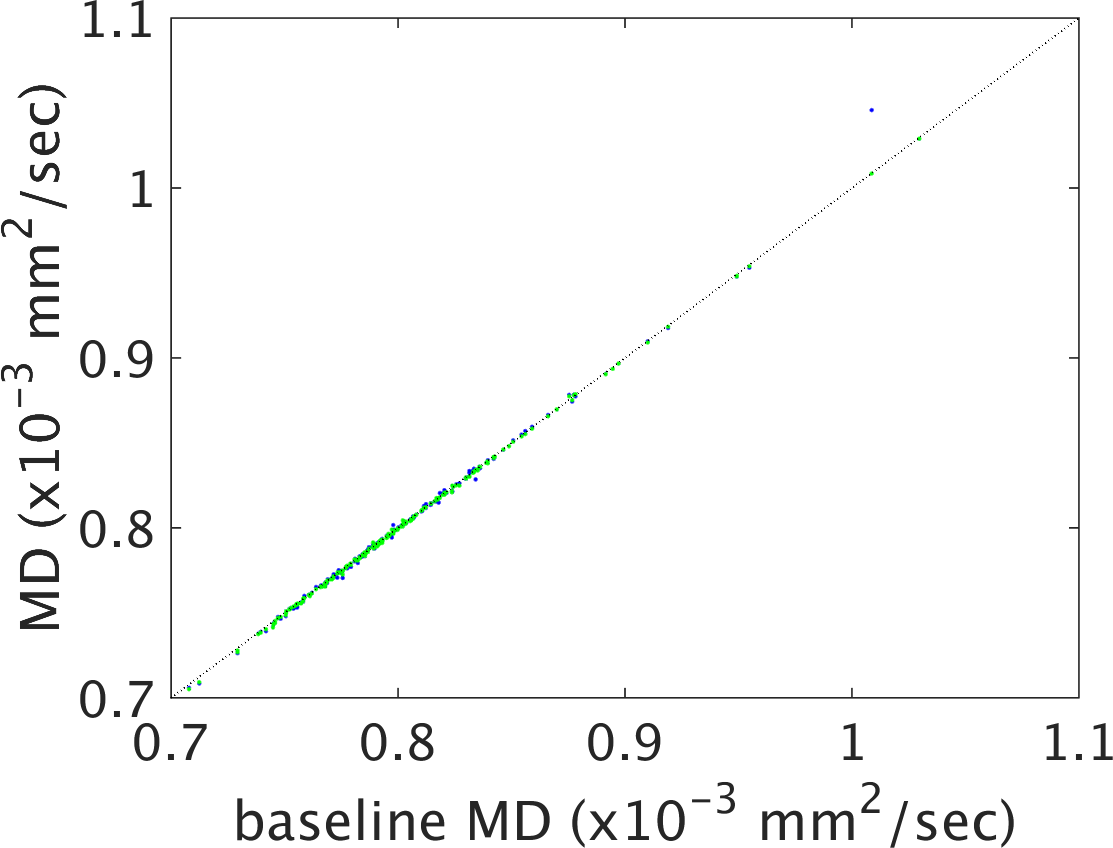
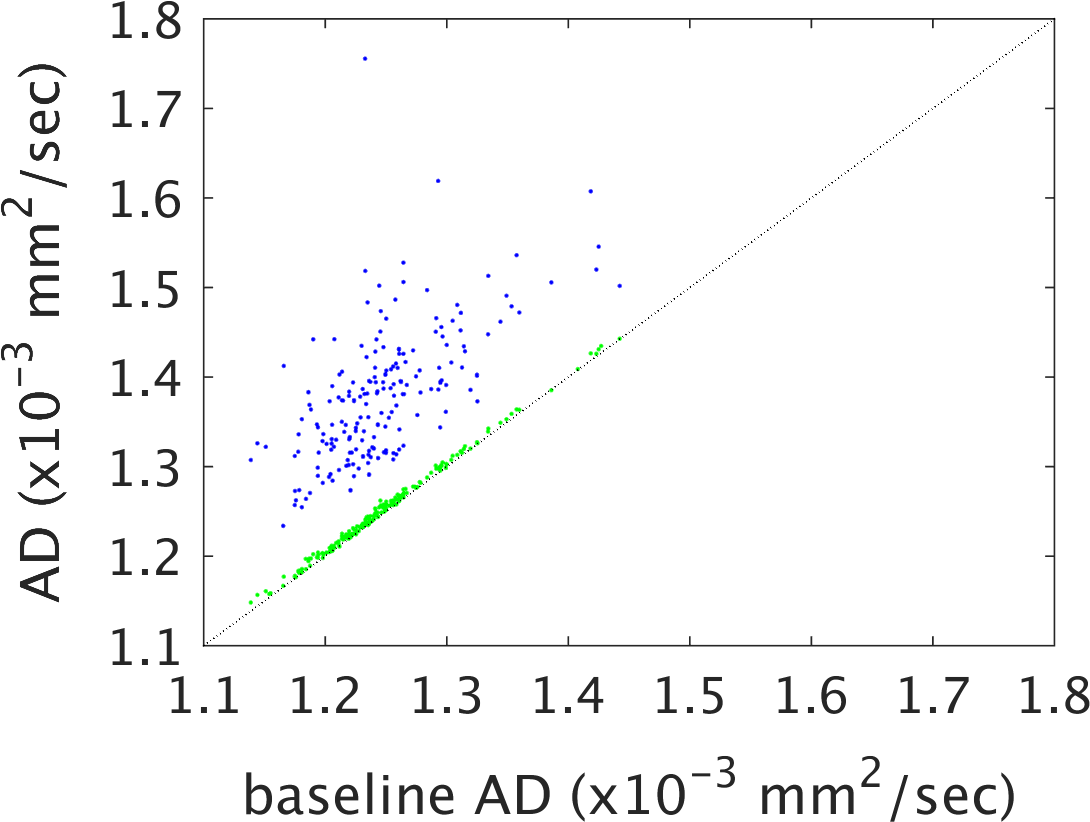
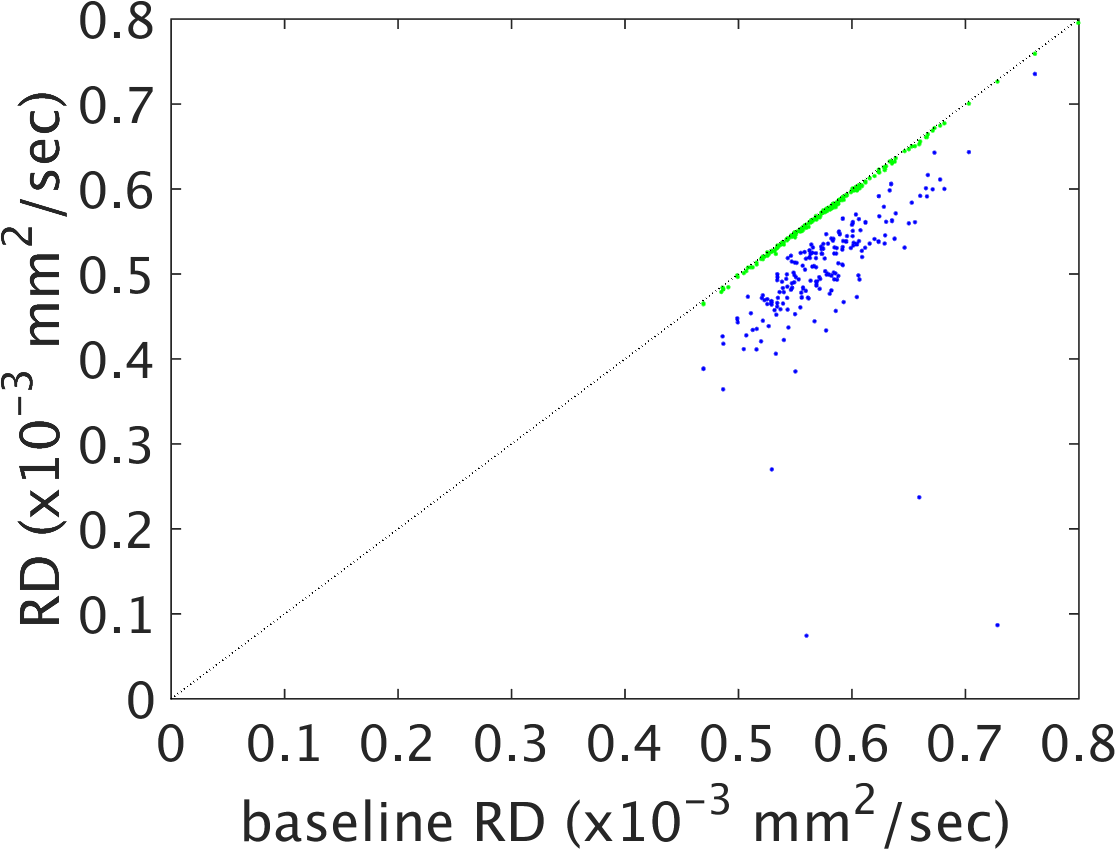
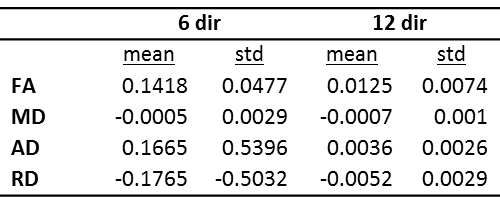
Figures 1-4 show plots of tissue microstructure parameters derived from the full dataset against the mean of 100 subsets of 6 directions (blue) and 12 directions (green), compared to the original estimation. Values derived using 6 directions show substantial systematic differences from those derived from the full dataset for FA, AD and RD but less so for MD. Values using 12 directions are largely consistent with those derived with the full dataset. Outliers were seen in FA, AD and RD, but not MD, for parameters derived using 6 directions that do not appear with parameters derived using 12 directions (data not shown). Values calculated using 12 directions differ from those from the full dataset by approximately one percent (Figure 5).Discussion
While more diffusion gradients are better in many respects, practical implementation of more than 6 or 12 gradients may be difficult to implement in a clinical trial. Implementation of acquisitions with many gradients may require licenses or a research key that can be costly. Participants are also likely to move during a scan, thereby corrupting the images. Short duration scans using few diffusion gradients may therefore prove advantageous. The results of this study suggest that as few as 12 directions may be sufficient from the standpoint of calculating diffusion tensor-based measures of tissue microstructure. Future work will focus on minimal datasets required for accurate estimation of other diffusion-based metrics and tractography.Acknowledgements
This work was supported by the National Institutes of Health [grant number 1U01NS082329-01A1]. We gratefully acknowledge support from the SPRINT-MS network (https://www.neuronext.org/nn102-sprint-ms) and from John Kirsch and Johan Tondeur of Siemens Healthineers.References
1. Farquharson S, Tournier JD, Calamante F, Fabinyi G, Schneider-Kolsky M, Jackson GD, Connelly A. White matter fiber tractography: why we need to move beyond DTI. Journal of neurosurgery. 2013;118(6):1367-77. doi: 10.3171/2013.2.JNS121294. PubMed PMID: 23540269.
2. Fox RJ, Sakaie K, Lee JC, Debbins JP, Liu Y, Arnold DL, Melhem ER, Smith CH, Philips MD, Lowe M, Fisher E. A validation study of multicenter diffusion tensor imaging: reliability of fractional anisotropy and diffusivity values. AJNR Am J Neuroradiol. 2012;33(4):695-700. PubMed PMID: 22173748.
3. Fox RJ, Coffey CS, Cudkowicz ME, Gleason T, Goodman A, Klawiter EC, Matsuda K, McGovern M, Conwit R, Naismith R, Ashokkumar A, Bermel R, Ecklund D, Koepp M, Long J, Natarajan S, Ramachandran S, Skaramagas T, Thornell B, Yankey J, Agius M, Bashir K, Cohen B, Coyle P, Delgado S, Dewitt D, Flores A, Giesser B, Goldman M, Jubelt B, Lava N, Lynch S, Miravalle A, Moses H, Ontaneda D, Perumal J, Racke M, Repovic P, Riley C, Severson C, Shinnar S, Suski V, Weinstock-Gutman B, Yadav V, Zabeti A. Design, rationale, and baseline characteristics of the randomized double-blind phase II clinical trial of ibudilast in progressive multiple sclerosis. Contemp Clin Trials. 2016;50:166-77. doi: 10.1016/j.cct.2016.08.009. PubMed PMID: 27521810; PMCID: PMC5035622.
4. Lowe MJ, Beall EB, Sakaie KE, Koenig KA, Stone L, Marrie RA, Phillips MD. Resting state sensorimotor functional connectivity in multiple sclerosis inversely correlates with transcallosal motor pathway transverse diffusivity. Hum Brain Mapp. 2008;29(7):818-27. Epub 2008/04/29. doi: 10.1002/hbm.20576. PubMed PMID: 18438889.
5. Jones DK, Horsfield MA, Simmons A. Optimal strategies for measuring diffusion in anisotropic systems by magnetic resonance imaging. Magn Reson Med. 1999;42(3):515-25. PubMed PMID: 10467296.
Figures