1979
An individual radiomics nomogram for differential diagnosis between multiple sclerosis and neuromyelitis optica spectrum disorder1Department of Radiology, Beijing Tiantan Hospital, Capital Medical University, Beijing, China, 2CAS Key Laboratory of Molecular Imaging, Institute of Automation, Chinese Academy of Sciences, Beijing, China, 3Department of Radiology, Xuanwu Hospital, Capital Medical University, Beijing, China
Synopsis
Clinically distinguishing the multiple sclerosis (MS) and neuromyelitis optica spectrum disorder (NMOSD) is critical, since the prognosis and treatment of these disorders differ. We extracted nine radiomics features from 485 radiomics features combining with clinical measurements to build the model for differentiating MS and NMOSD. The area under receiver operating characteristic curve (AUC) of the model was 0.8808 and 0.7115 in the primary and validation cohort. The model demonstrated good calibration. The current study revealed the different radiomics features between MS and NMOSD, and developed and validated an individual model to differentiate the two diseases.
Introduction
Multiple sclerosis (MS) and neuromyelitis optica spectrum disorder (NMOSD) are two main inflammatory demyelinating diseases of the central nervous system1, 2. Despite the existence of diagnostic criteria 3, 4, the differential diagnosis of the two diseases is difficult. Therefore it is crucial to identify new efficient biomarkers to quantify the pathological alterations and accurately differentiate the two diseases. Radiomics is the process of the conversion of medical images into high-dimensional, mineable data via high-throughput extraction of quantitative features, followed by subsequent data analysis for decision support5-7.It can capture important lesion information and has great potential to provide valuable information for revealing the pathophysiology, helping differential diagnosis, and guiding personalized therapy. This study aims to investigate the radiomics features of spinal cord lesion in MS and NMOSD, and develop and validate a nomogram that incorporated both the radiomics signature and clinical variables for individual differential diagnosis of the two diseases.Methods
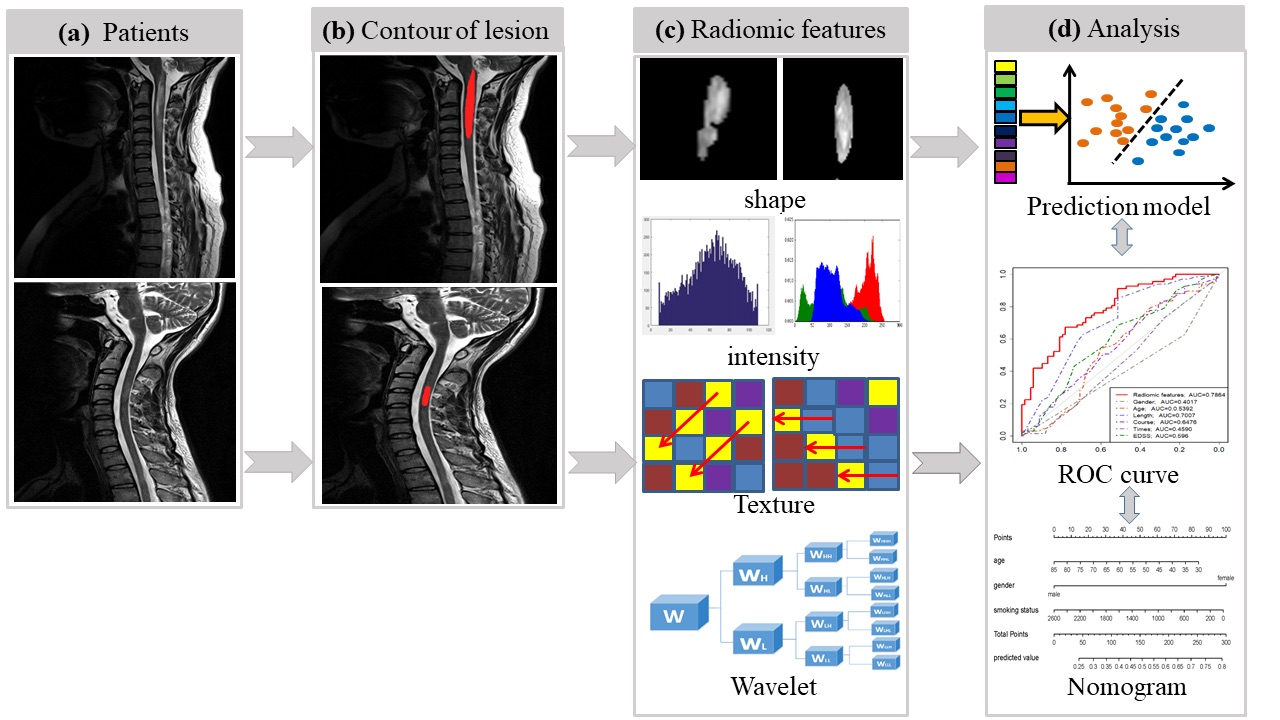
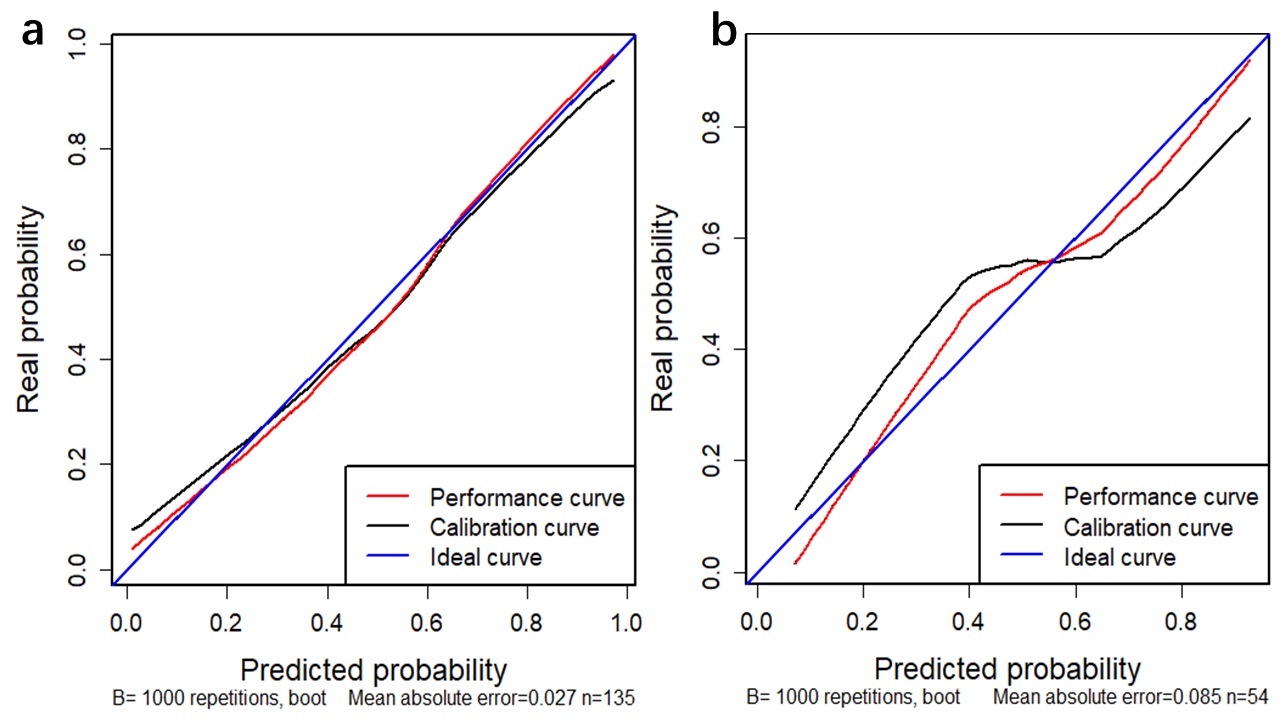
189 patients (95 MS and 94 NMOSD) with spinal cord lesions were recruited from Xuanwu Hospital, Capital Medical University including 135 patients in the primary cohort and 54 patients in the validation cohort. The main demographic and clinical characteristics of the patients were shown in Figure1. All spinal cord MRI scans were performed on a 3.0 Tesla MR system (Siemens Magnetom Trio Tim system, Germany). Marking the hyperintense cord lesions as ROIs on sagittal T2-weighted images was performed by an experienced neuroradiologist (Y.D) using MRIcro software (http://www.mccauslandcenter.sc.edu/mricro/mricro/mricro.html). In our study, we applied the emerging method of radiomics to discriminate the MS and NMOSD (Figure 2). The process mainly included following steps:(1) Feature extraction: we described regions of interest (ROIs) of the spinal cord lesions by extracting four radiomics features group8: a: shape and size features, b: grey intensity features, c: textural features and d: wavelet features. (2) Feature selection: we used least absolute shrinkage and selection operator (LASSO) method to select features and built a logistic regression model. We built the prediction model for differentiate MS and NMOSD by the radiomics features combining with several clinical variables, and the receiver operating characteristic (ROC) curve was plotted to show the performance of the model. An individual radiomics nomogram was developed using multivariable logistic regression on the basis of discriminative predictors in the primary cohort. In order to assess the performance of the nomogram, we plotted the calibration curve and calculated the Harrell’s C-index to quantify the discrimination of radiomics nomogram.Results
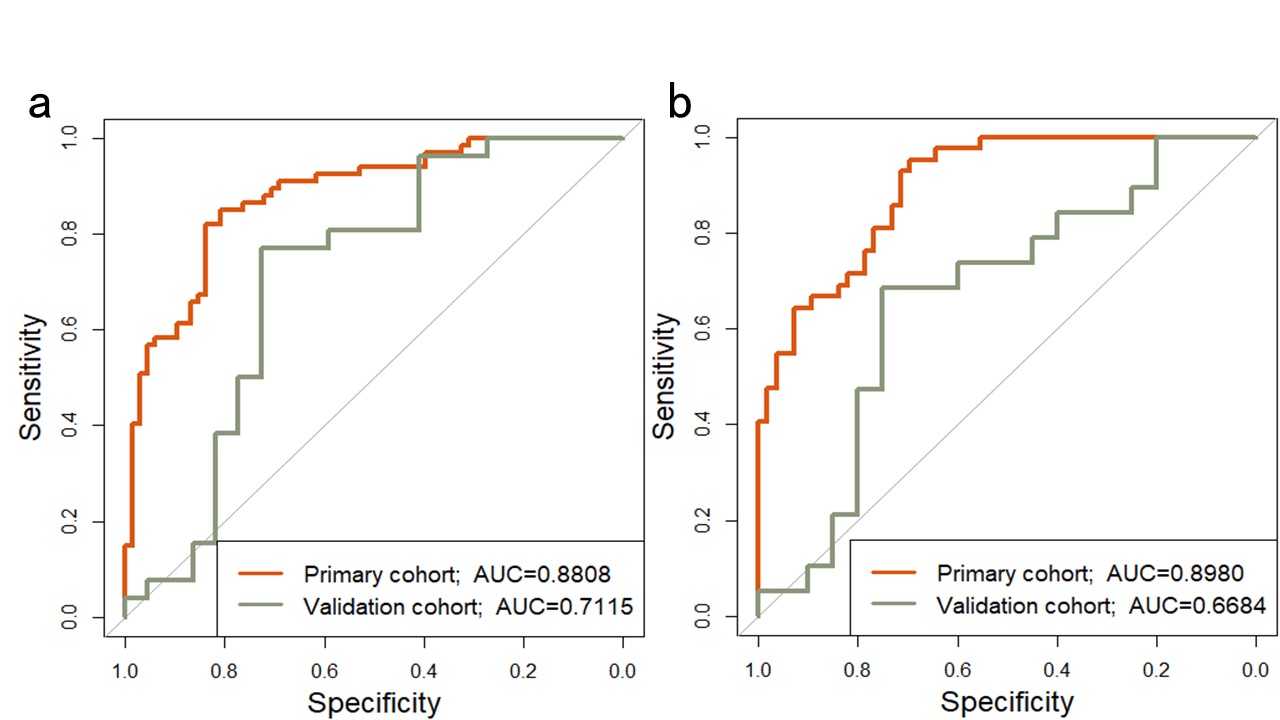
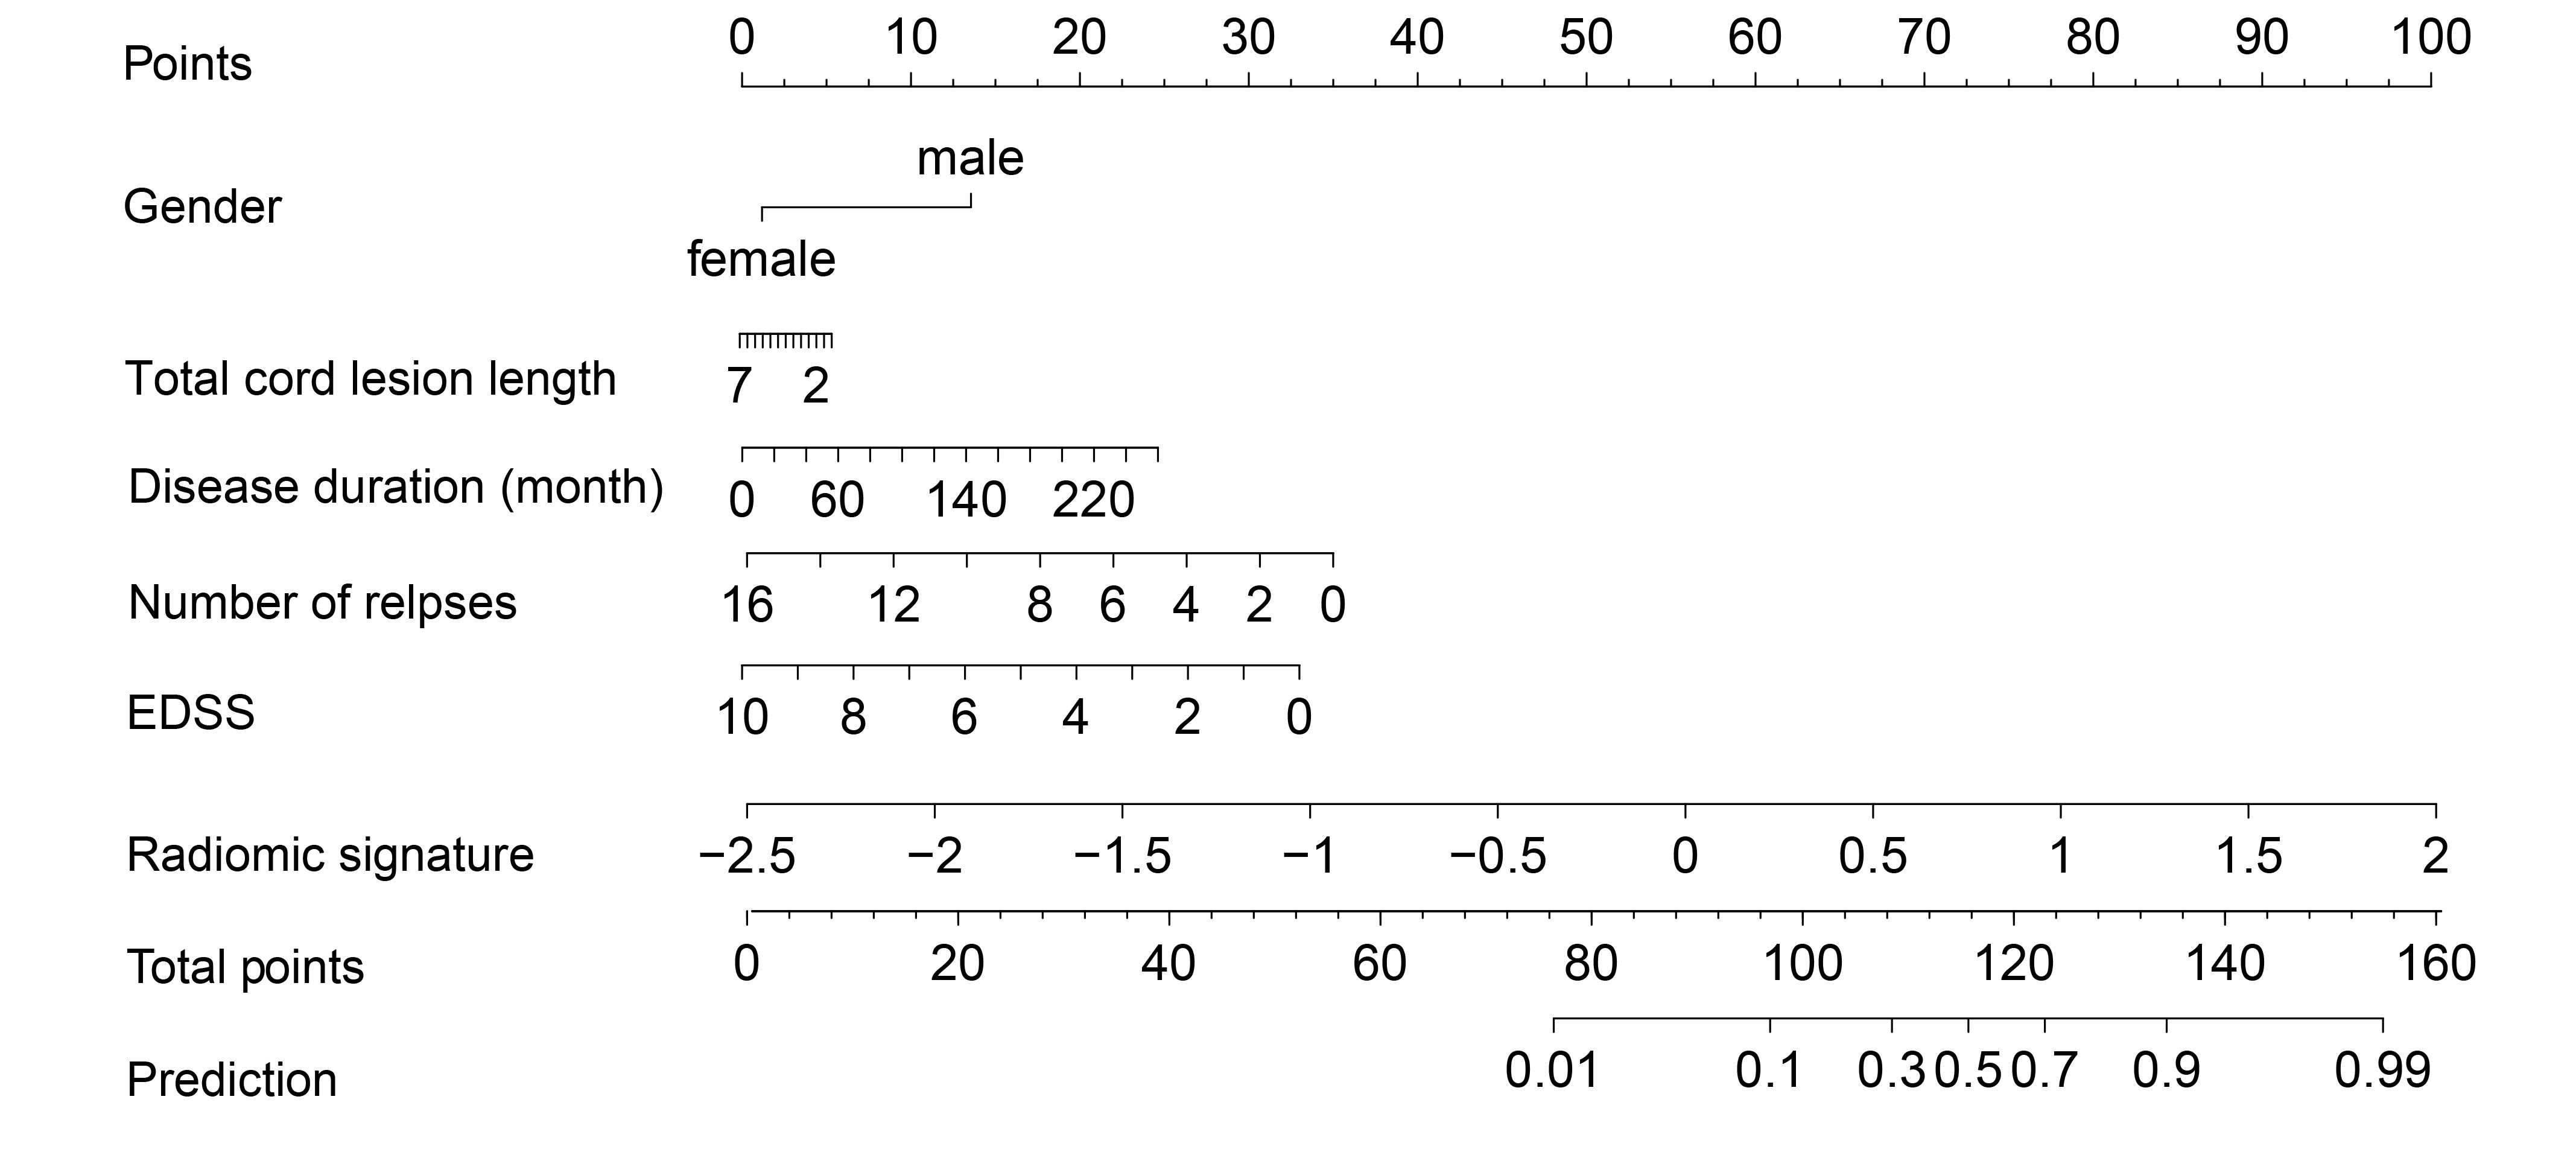
After feature selection, 485 radiomics features were reduced to 9 potential features and 7 clinical and routine MRI characteristics were reduced to 3 potential variables, which were implemented to develop the LASSO logistic regression model, including WLLH_GLCM_cluster_tendency (P=0.027), WLHL_GLCM_difference_entropy(P=0.20), WHLL_GLCM_cluster_shade (P=0.098), GLRLM_SRE (P=3.5×10⁻⁵), WLHL_GLRLM_LRE (P=0.077), WLHL_GLRLM_LRLGLE (P=0.077), WHLL_GLRLM_LRHGLE (P=1.2×10⁻⁴), WHLH_GLRLM_LRE(P=5.6×10⁻⁵), WHLH_GLRLM_LRLGLE (P=5.6×10⁻⁵), gender (P=0.011), length (P=4.6×10⁻⁵) and EDSS(P =0.05). The area under ROC curve (AUC) was 0.8808 and 0.7115 in the primary and validation cohorts, and 0.898 and 0.6684 in the female primary and validation cohort respectively (Figure 3). The individualized prediction model for discrimating MS and NMO was developed by the multivariate logistic regression analysis and visualized by the nomogram (Figure 4). The C-index for the nomogram was 0.8902 (95% CI, 0.851 to 0.932) (Figure 5).Discussion
In this study, we demonstrated the different radiomics features of spinal cord lesions in MS and NMOSD, developed and validated an individual radimoics nomogram combining with clinical variables to differentiate the two diseases. The main radiomics features differentiate the two diseases (MS vs NMOSD) is the heterogeneity of the lesion signal, which is consistent with pathological studies showing more severe demyelination, axonal loss in NMOSD than MS, and NMOSD lesion can present necrotic and cystic changes with extensive tissue destruction1, 9, 10. These features can be captured and quantified by radiomics and help understand the pathophysiology of the disease and performed better than clinical measures and other lesion appearance such as lesion length to discriminating the two diseases. The radiomics features of cord lesions dominated the nomogram in terms of relative contribution to total points and differential diagnosis between the two diseases, highlighting the clinical importance of radiomics features.Conclusion
A validated nomogram that incorporates the radiomics signature combining with spinal cord lesions, cord lesion length, gender, and EDSS can well differential MS and NMOSD based on routine MRI data. Further study from different parameters from various scanners in multicenter setting is required to validate our current findings and confirm its generalizability.Acknowledgements
This work was supported by the ECTRIMS-MAGNMIS Fellowship from ECTRIMS (Y.L), the National Science Foundation of China (Nos. 81101038, 81227901, 81771924, 81501616, 61231004, 81401377, 81471221 and 81230028), the National Basic Research Program of China (2013CB966900), National Key R&D Program of China (2017YFA0205200, 2017YFC1308700, 2017YFC1308701), the Beijing Natural Science fund (No.7133244), the Beijing Nova Programme (xx2013045), Beijing Municipal Administration of Hospital Clinical Medicine Development of Special Funding Support (code:ZYLX201609) , the Science and Technology Service Network Initiative of the Chinese Academy of Sciences (KFJ-SW-STS-160), and Key Projects in the National Science & Technology Pillar Program during the Twelfth Five-year Plan Period(2012BAI10B04)References
1. Wingerchuk DM, Lennon VA, Lucchinetti CF, Pittock SJ, Weinshenker BG. The spectrum of neuromyelitis optica. Lancet Neurol 2007;6:805-815.
2. Noseworthy JH, Lucchinetti C, Rodriguez M, Weinshenker BG. Multiple sclerosis. N Engl J Med 2000;343:938-952.
3. Polman CH, Reingold SC, Banwell B, et al. Diagnostic criteria for multiple sclerosis: 2010 revisions to the McDonald criteria. Ann Neurol 2011;69:292-302.
4. Wingerchuk DM, Lennon VA, Pittock SJ, Lucchinetti CF, Weinshenker BG. Revised diagnostic criteria for neuromyelitis optica. Neurology 2006;66:1485-1489.
5. Lambin P, Rios-Velazquez E, Leijenaar R, et al. Radiomics: extracting more information from medical images using advanced feature analysis. Eur J Cancer 2012;48:441-446.
6. Gillies RJ, Kinahan PE, Hricak H. Radiomics: Images Are More than Pictures, They Are Data. Radiology 2016;278:563-577.
7. Yip SS, Aerts HJ. Applications and limitations of radiomics. Phys Med Biol 2016;61:R150-166.
8. Aerts HJ, Velazquez ER, Leijenaar RT, et al. Decoding tumour phenotype by noninvasive imaging using a quantitative radiomics approach. Nat Commun 2014;5:4006.
9. Kawachi I, Lassmann H. Neurodegeneration in multiple sclerosis and neuromyelitis optica. J Neurol Neurosurg Psychiatry 2017;88:137-145.
10. Filippi M, Rocca MA, Barkhof F, et al. Association between pathological and MRI findings in multiple sclerosis. Lancet Neurol 2012;11:349-360.
Figures
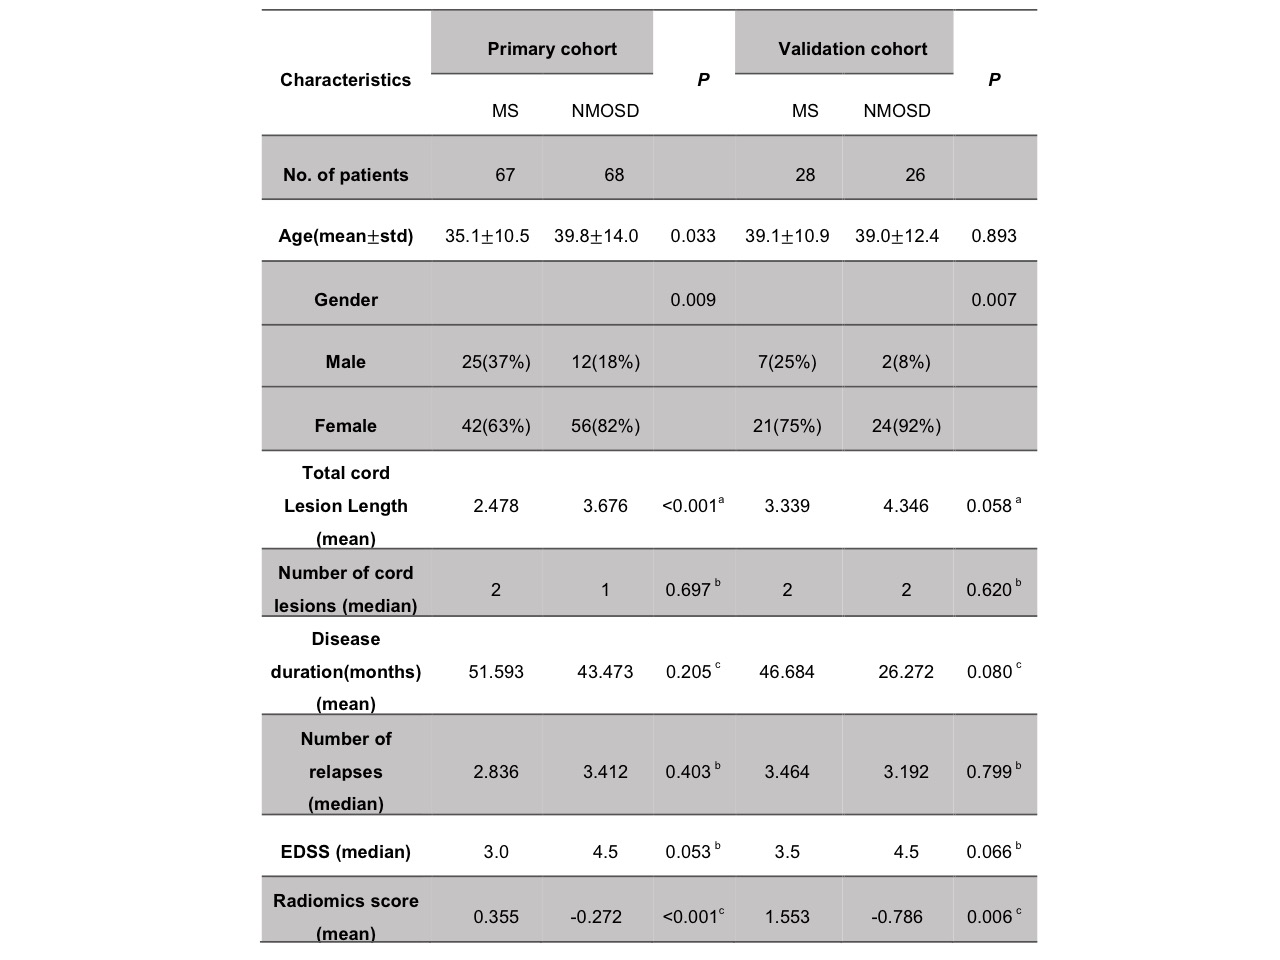
Figure 1. Characteristics of patients in the primary and validation cohorts
Data are presented as mean ± standard or median depending on the normality (Lilliefors test). EDSS = Expanded Disability Status Scale; F, female; HC = healthy control; M, male; MMSE = Mini-Mental State Examination; NA, not available; NMOSD = neuromyelitis optica spectrum disorder aP-value obtained using two-tail Pearson chi-square test. bP-values obtained using two-tail Wilcoxon rank sum tests. cP-values obtained using two-sample two-tail t tests. Radiomics score revealed that the reliability of prediction for each patient.