1976
19F MR characterization of teriflunomide, a fluorinated drug indicated in Multiple Sclerosis1Berlin Ultrahigh Field Facility, Max Delbrueck Center for Molecular Medicine in the Helmholtz Association, Berlin, Germany, 2Experimental and Clinical Research Center, a joint cooperation between the Charité Medical Faculty and the Max Delbrueck Center for Molecular Medicine in the Helmholtz Association, Berlin, Germany
Synopsis
Teriflunomide is an anti-inflammatory drug indicated for the treatment of Multiple Sclerosis (MS). This disease presents with a wide spectrum of symptoms and available drugs have different effects, thereby posing a major treatment challenge. Due to its three fluorine atoms, teriflunomide can be detected non-invasively by fluorine-19 (19F) magnetic resonance. The objective of this work is to characterize the 19F MR properties of teriflunomide in order to adapt MR sequences for in vivo measurements. Here, we studied the relaxation times of teriflunomide and their modifications as a result of concentration, pH and temperature changes.
Introduction
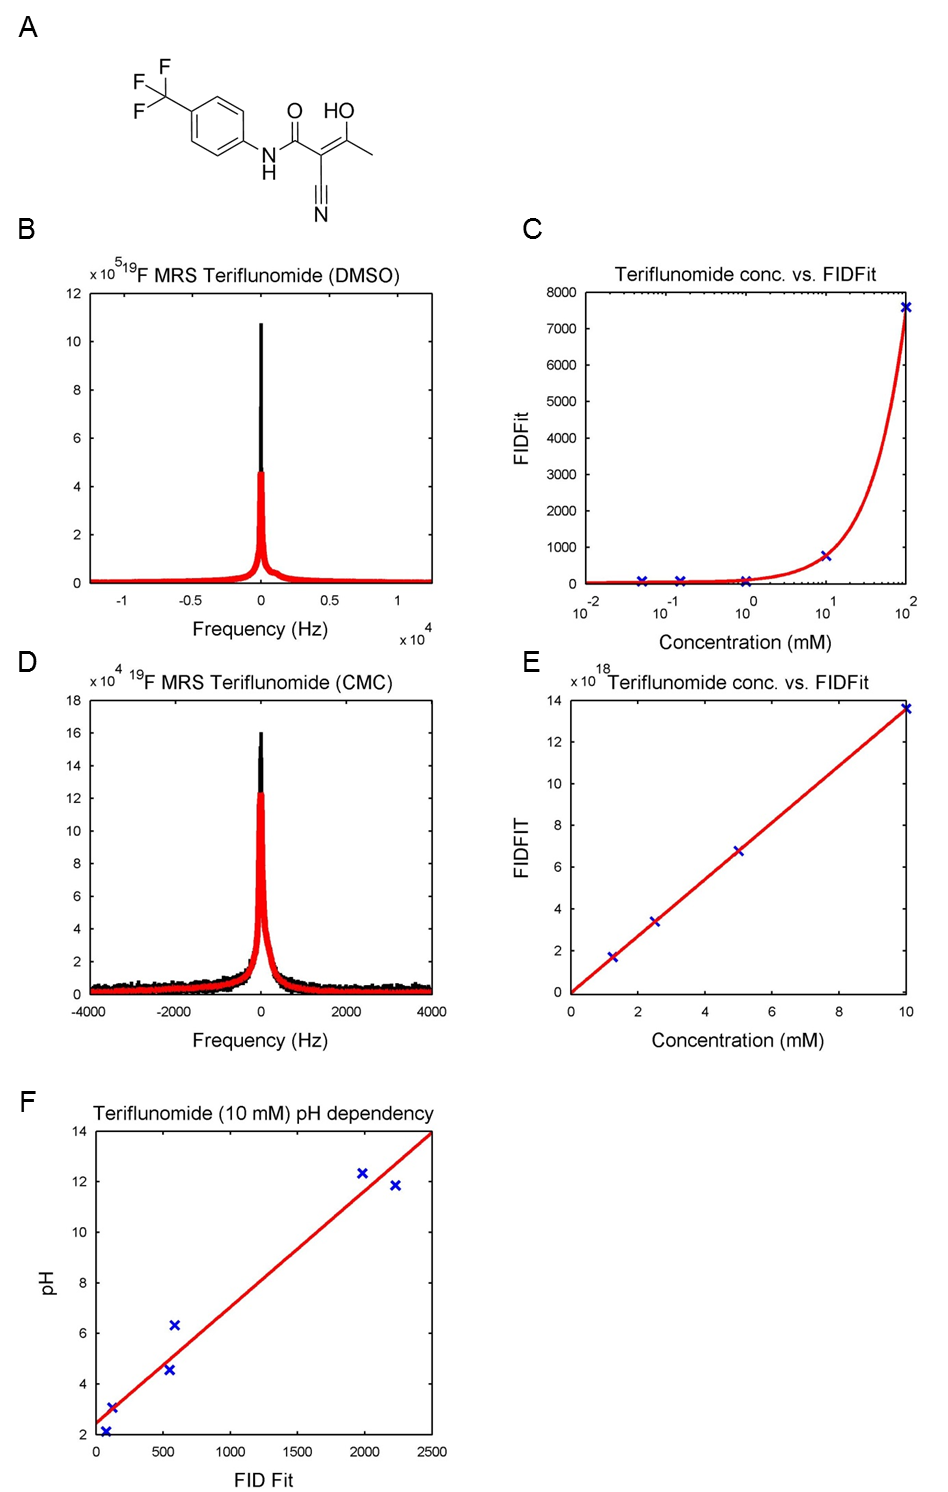
Teriflunomide is an anti-inflammatory drug used to treat Multiple Sclerosis (MS), an autoimmune disease of the central nervous system 1. A high variability in the efficacy and toxicity of MS drugs makes the treatment a challenge with only limited possibility of prediction on the outcome 2,3. Teriflunomide is a tri-fluorinated compound (Fig.1A) that could potentially be detected by fluorine-19 (19F) MRI and MRS techniques 4. To overcome the hurdle of detecting fluorine at very low concentrations, a thorough characterization of the 19F-MR properties of teriflunomide was performed to achieve a highest possible SNR for studying the biodistribution of teriflunomide in vivo.Methods
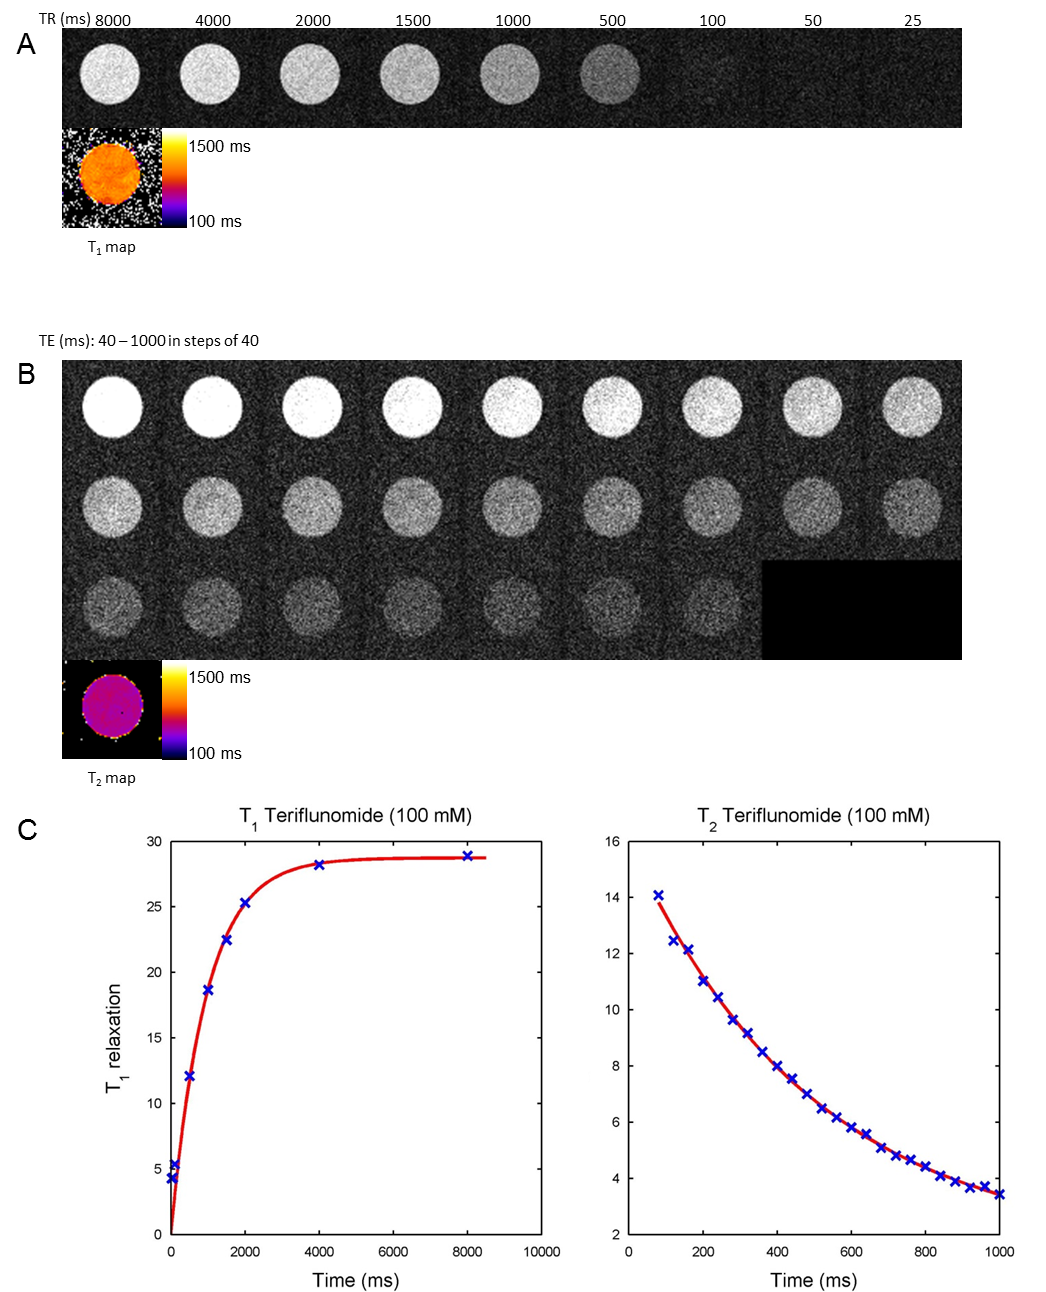
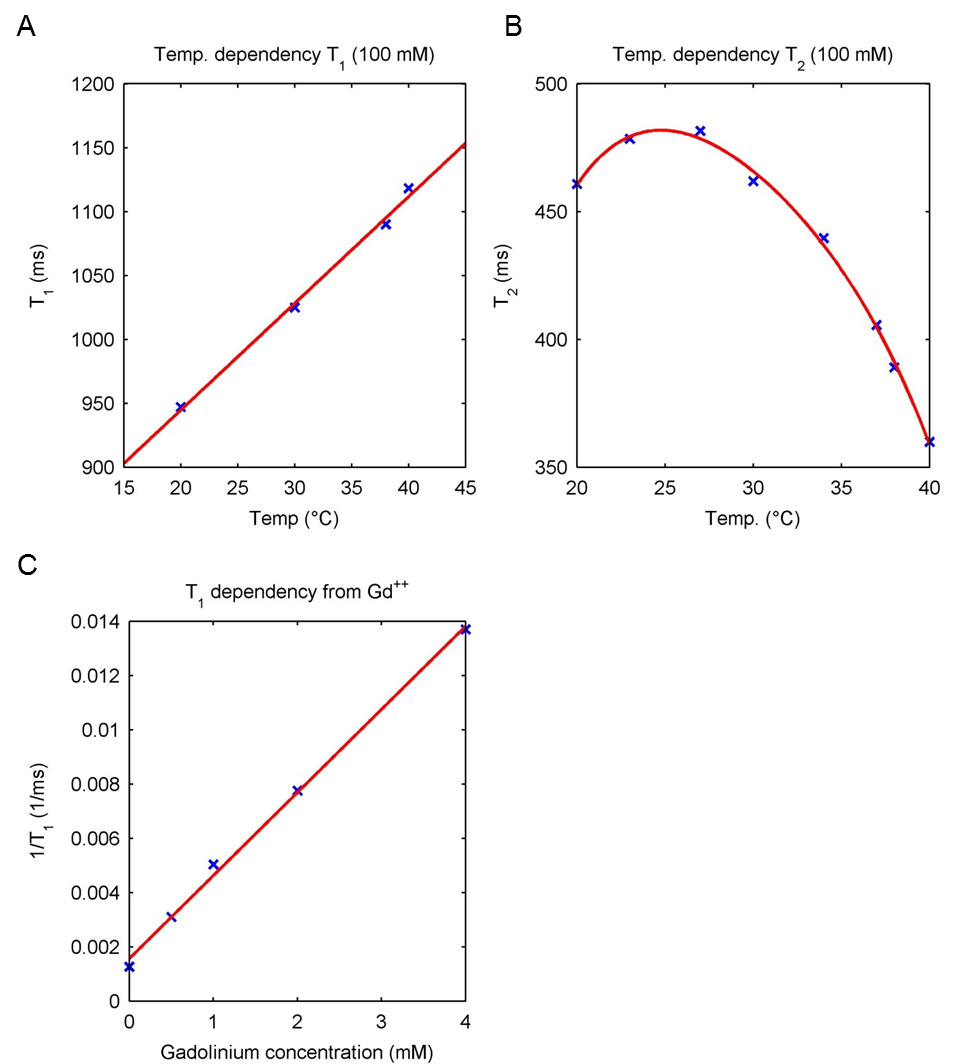
All MR experiments were performed on a 9.4T MR scanner (Bruker Biospec, Ettlingen, Germany) using a dual-tunable 19F/1H mouse head coil 5. A non-selective single-pulse global 19F-MRS was used to detect the 19F signal and to make frequency adjustments. T1-mapping was performed using RARE with 9 different repetition times; T2-mapping was performed using a multi-slice multi-echo (MSME) technique with 25 echo times. Analysis of data was performed in Matlab. Image analysis was performed using ImageJ. Phantoms were prepared in 2.5ml syringes and NMR tubes. Teriflunomide was dissolved in DMSO at a concentration of 100mM and serially diluted to 50, 25, 10, 5, 2.5, 1, 0.15 and 0.05mM in 1ml each. For in vivo administration, the drug was formulated in 0.6% carboxymethylcellulose (CMC) with 0.5% Tween80. The pH was adjusted with HCl or NaOH. For measuring the influence of gadolinium (Gd++) on T1, phantoms with 100mM teriflunomide were prepared in NMR tubes containing different doses of Gd++ (Magnevist). The temperature of the sample was adjusted by water circulation at water bath temperatures calibrated to the sample temperature.Results
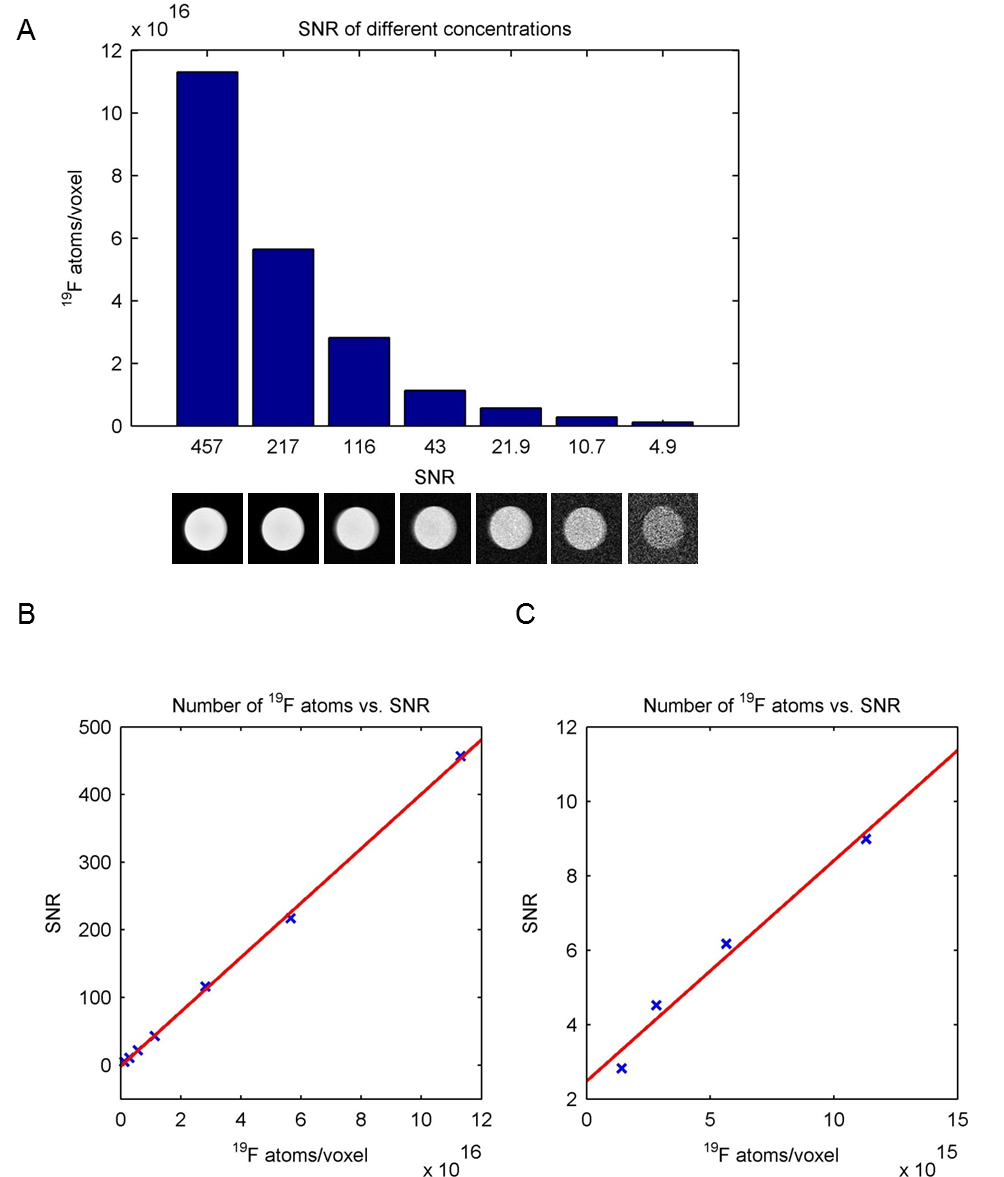
19F‑MR spectroscopy of teriflunomide in DMSO revealed a single peak at a frequency of 376.642 MHz at 9.4T (Fig.1B). A linear correlation was demonstrated between 19F signal intensity (FID) and teriflunomide concentration (Fig.1C). When prepared at concentrations of 1.25mM to 10mM in CMC (Fig.1D), a linear correlation between signal intensity and teriflunomide concentration was also demonstrated (Fig.1E). Further, a linear correlation between the pH and the signal intensity was revealed (Fig.1F). Parametric mapping of teriflunomide was performed at 100mM (in DMSO). A T1 of 947ms and a T2 of 461ms was calculated (Fig.2). No significant differences were observed when decreasing teriflunomide concentrations to 10mM (T1=950ms) and 5mM (T1=952ms). T1 and T2-mapping were also performed at different temperatures. At 100mM a linear correlation was found between temperature and T1 (Fig.3A) and an influence of the temperature on T2 (Fig.3B). In a further attempt to increase the 19F SNR of teriflunomide per unit time, we studied the influence of the contrast agent Gd++ on T1 shortening. Increasing Gd++ concentrations resulted in T1 shortening of teriflunomide and T1-values of 322ms, 198ms, 129ms and 73ms (Fig.3C). A RARE sequence for 19F-MRI was used to measure different concentrations of teriflunomide (Fig.4A). This revealed a correlation between 19F amount and 19F signal intensity. Based on linear fittings of SNR and 19F atoms/voxel, assuming a minimum required SNR of 3.5, the minimum detectable concentrations of teriflunomide were calculated: 1.19*1015 19F-atoms/voxel (1.1mM) in DMSO (Fig.4B) and 1.71*1015 19F-atoms/voxel (1.52mM) in CMC (Fig.4C).Discussion
The study of the 19F-MR properties of teriflunomide provides valuable information to optimize the MR method for its detection in in vivo experiments. With this, current limitations in signal sensitivity start to be overcome and lower detection limits may be achieved at feasible scan times. Especially in tissues where concentrations of teriflunimide are expected to be low (e.g. the CNS), a rough estimate of the 19F signal by MRS will be vital prior to MR data acquisition 6. To increase signal detection, T1 and T2 values and their dependencies on factors such as temperature and pH need to be considered prior to a determination of the correct MR parameters. A shortening of T1 by Gd++ to reduce the scan time might be another solution to increase the SNR of teriflunomide per unit time. For this, the use of a cryogenically cooled 19F coil might be considered, as well 7.Conclusion
By characterizing the 19F-MR properties of teriflunomide we can adjust MR protocols for in vivo experiments, for example when administering teriflunomide to animals with experimental autoimmune encephalomyelitis as model of MS. Tracking teriflunomide with a non-invasive method provides insight in drug distribution especially during pathology and will serve as a starting point for developing personalized treatment strategies and methods for therapeutic guidance in clinical practice.Acknowledgements
References
1 Dendrou, C. A., Fugger, L. & Friese, M. A. Immunopathology of multiple sclerosis. Nature reviews. Immunology 15, 545-558, doi:10.1038/nri3871 (2015).
2 Wiese, M. D., Rowland, A., Polasek, T. M., Sorich, M. J. & O'Doherty, C. Pharmacokinetic evaluation of teriflunomide for the treatment of multiple sclerosis. Expert Opin Drug Metab Toxicol 9, 1025-1035 (2013).
3 Grossman, I. et al. Pharmacogenomics strategies to optimize treatments for multiple sclerosis: Insights from clinical research. Progress in neurobiology 152, 114-130, doi:10.1016/j.pneurobio.2016.02.001 (2017).
4 Niendorf, T., Ji, Y. & Waiczies, S. in Fluorine Magnetic Resonance Imaging 311-344 (Pan Stanford Publishing, 2016).
5 Waiczies, H. et al. Visualizing brain inflammation with a shingled-leg radio-frequency head probe for 19F/1H MRI. Scientific reports 3, 1280, doi:10.1038/srep01280 (2013).
6 Kaplan, J., Cavalier, S. & Turpault, S. Biodistribution of Teriflunomide in Naïve Rats vs Rats With Experimental Autoimmune Encephalomyelitis. Poster presented at: 31st Congress of the European Committee for Treatment and Research in Multiple Sclerosis (ECTRIMS), October 7–10, 2015, Barcelona, Spain (2015).
7 Waiczies, S. et al. Enhanced Fluorine-19 MRI Sensitivity using a Cryogenic Radiofrequency Probe: Technical Developments and Ex Vivo Demonstration in a Mouse Model of Neuroinflammation. Scientific reports 7, 9808, doi:10.1038/s41598-017-09622-2 (2017).
Figures