1975
Cortical metabolic changes and glial cell activation in multiple sclerosis: An in vivo 11C-PBR28 MR-PET and magnetic resonance spectroscopy study.1Radiology, Athinoula A. Martinos Center for Biomedical Imaging, Massachusetts General Hospital, Boston, MA, United States, 2Harvard Medical School, Boston, MA, United States, 3Neurology, Beth Israel Deaconess Medical Center, Boston, MA, United States, 4Neurology, Massachusetts General Hospital, Boston, MA, United States
Synopsis
We combined 11C-PBR28 imaging on a high resolution, integrated human MR-PET system with magnetic resonance spectroscopy to investigate brain metabolites abnormalities and microglia activation in the motor cortex of multiple sclerosis subjects relative to healthy controls. Our study provided increase of microglia activation and decrease of N-acetylaspartate, the latter indicating neuronal injury and/or loss, in multiple sclerosis compared to controls. None of the other metabolites (choline, myoinositol, glutamine, glutamate, phosphocholine) showed significant differences between the two groups. Also, we did not find a correlation between 11C-PBR28 binding and the metabolites concentration, suggesting that the two measures reflect distinct pathological aspects.
Purpose
Cortical diffuse degeneration is thought to play a major role in determining disease progression in multiple sclerosis (MS) 1,2. Histopathological investigations implicated neuroinflammation through microglia and/or macrophages activation in the pathogenesis of cortical diffuse damage 3. Currently, the best characterized imaging biomarker for assessing in vivo neuroinflammation is based on the upregulation of the translocator protein 18 kDa (TSPO). Activated microglia and macrophages upregulate the TSPO expression, which can be detected in vivo by positron emission tomography (PET) imaging 4. While current MRI methods lack sensitivity and are not specific to inflammatory processes or microglial activation, a number of metabolites that are readily quantifiable with clinical 1H MR spectroscopy have been proposed as markers of glial activation associated with neuroinflammation. Additionally, changes in myoinositol (mI), glutamate (Glu) and glutamine (Gln) (Glx, Glu+Gln), choline (tCho) containing compounds (glycerophosphocholine (GPC) and phosphocholine (PCho)), have been reported in response to neuroinflammation in MS 5 but how they relate to microglial activation in the cortex is not completely understood. A previous study has shown a correlation between mI and 11C-PBR28 uptake in white matter lesions in MS patients with higher inflammatory load 6. Here, in a heterogenous MS cohort, we combined 11C-PBR28 imaging on a high resolution, integrated human MR-PET system with magnetic resonance spectroscopy to investigate i) abnormalities in the expression of metabolites including creatine (Cr), phosphocreatine PCr, Glx (Gln+Glu), tCho (GPC+PCho), mI, tNAA (N-acetylaspartate + N-acetylaspartyglutammate, NAGG), and 11C-PBR28 binding in the motor cortex of MS subjects relative to healthy controls (HC), ii) the relationship between cortical metabolite concentrations and 11C-PBR28 binding in MS.Methods
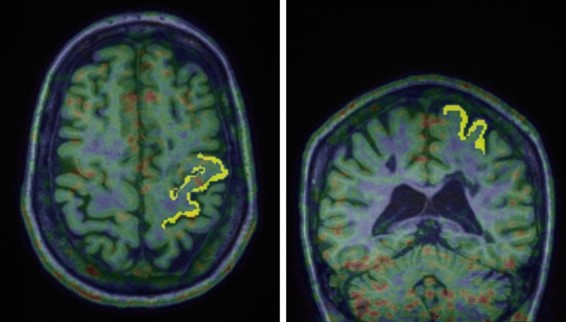
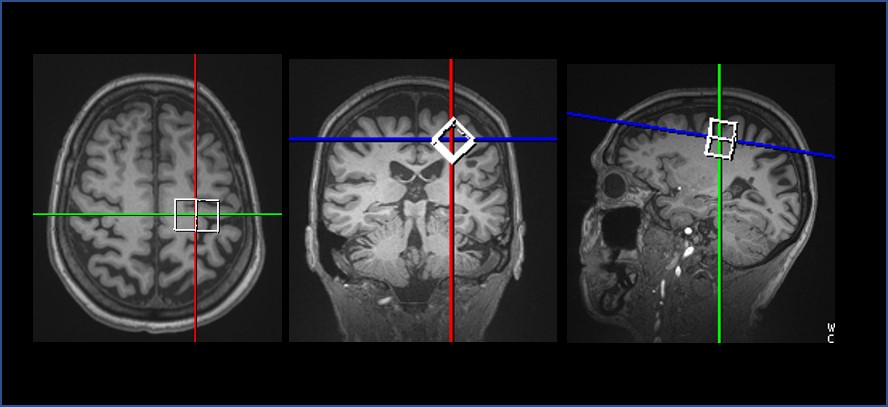
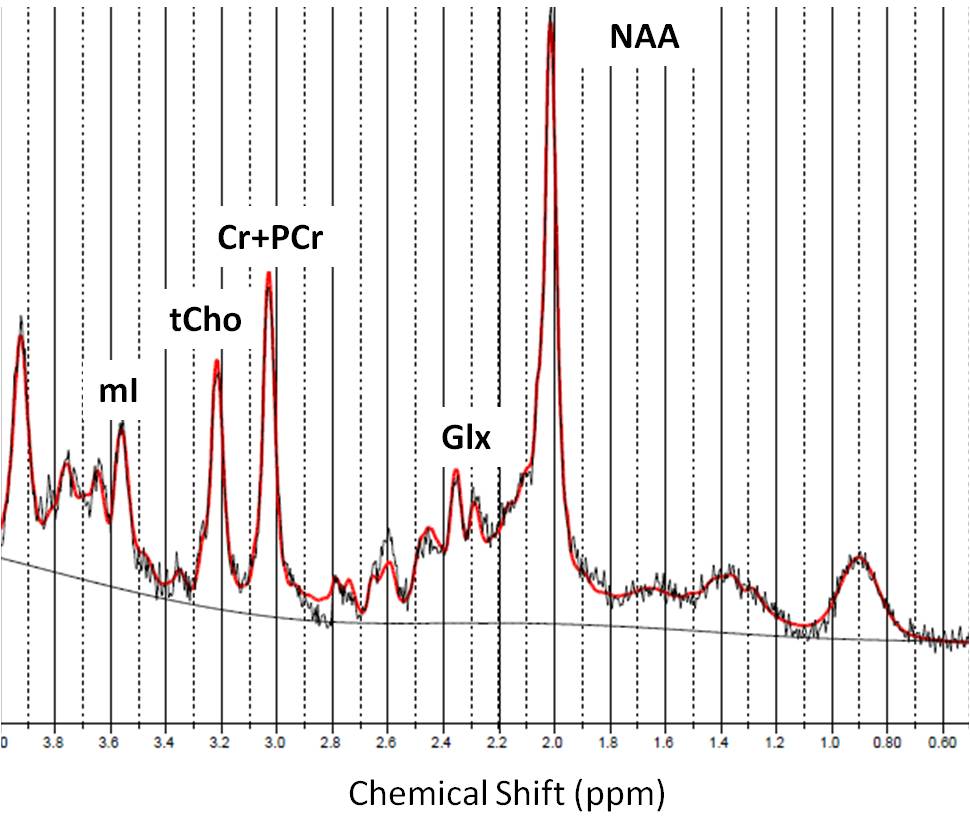
Eleven MS subjects (6 secondary progressive MS, SPMS, and 5 relapsing remitting MS, RRMS; mean±SD age=49±11 years) and 10 age- and TSPO affinity binding (as assessed by the Ala147Thr TSPO polymorphism5) matched healthy controls (HC) underwent 90-minutes of 11C-PBR28 MR-PET (Siemens BrainPET). Conventional anatomical 3T MR scans were simultaneously acquired for: a) cortical surface reconstruction, using FreeSurfer b) precentral gyrus segmentation c) MR-PET image registration. Standardized uptake value (SUV) maps were created for 60-90-minute PET frame (1.25 mm isotropic voxels) and normalized (SUVR), to take into account global differences across subjects, by a pseudo-reference region with SUV levels similar in HC and MS (Figure 1). Single voxel MR spectroscopy was acquired in the same session in all MS subjects and in 5 HC using a STEAM sequence (TR/TE/NS=1700/30/128) The spectroscopy voxel was positioned in the motor cortex (voxel of interest 2x2x2 cm3) (Figure 2). Metabolite quantification was performed with LCModel (version6.3) for the following metabolites: Cr, PCr, Gln, Glu, tCho (GPC+PCho), mI, tNAA (NAA+NAAG) (Figure 3). Total creatine concentration (tCr, Cr+PCr) was used for normalization of signals from other metabolites from the same voxel. Linear regression models were used to i) compare metabolic and 11C-PBR28 changes, in MS vs HC, ii) assess in MS the relationship between 11C-PBR28 SUVRs and metabolite concentration. Age, gender, TSPO affinity and intracranial volume were included as regressors when appropriate with a significant threshold of p<0.05.Results
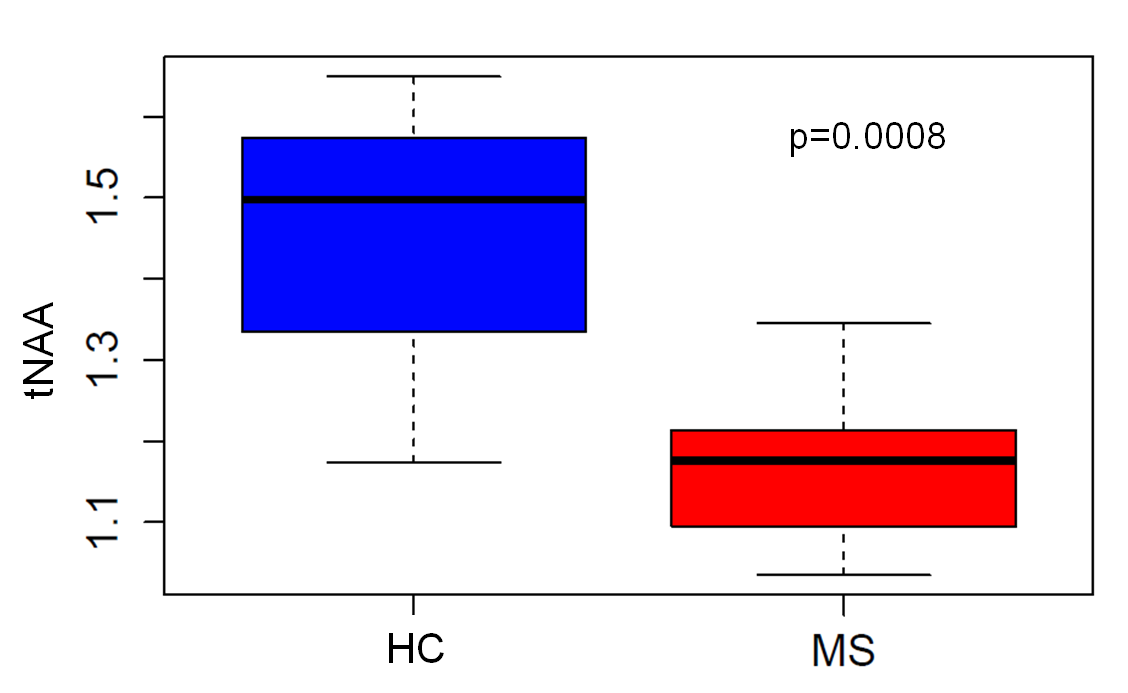
11C-PBR28 tracer uptake was increased by 15% in the whole MS group relative to HC, however the increase reached statistical significance only when comparing SPMS to HC. N-acetylaspartate (tNAA) was decreased (~18%) in people with MS compared to HC (p=0.0008), indicating neuronal injury and/or loss in the precentral gyrus (Figure 4). Neither choline containing components (tCho), nor myo-Inositol (mI) or Glx components showed significant differences between the two groups. The concentrations of mI, Glx, tCho and tNAA in the spectroscopy voxel (expressed as either an absolute concentration or as a ratio to total tissue creatine) were not significantly correlated to the TSPO binding measure of 11C-PBR28 in the precentral gyrus of MS people.Discussion and Conclusion
We found evidence of neuroinflammation and neurodegeneration in the motor cortex of MS subjects. None of the MRS markers was associated with PET tracer uptake suggesting that the two measures reflect distinct pathological aspects. Given the small sample size, future studies are needed to confirm our observations and to explore metabolic inflammatory correlation in different disease stages.Acknowledgements
This study was supported by Clafin Award; NMSS RG 4729A2/1, US Army W81XWH-13-1-0112. EH is supported by an NMSS fellowship (FG-1507-05459).References
1. Kutzelnigg A, Lucchinetti CF, Stadelmann C, et al. Cortical demyelination and diffuse white matter injury in multiple sclerosis. Brain. 2005; 128: 2705-12.
2. Kutzelnigg A, Lassmann H, et al. Cortical demyelination and diffuse in multiple sclerosis: a susbstrate for cognitive deficits?. J Neurol Sci. 2006; 245:123-6. 3. Lassmann H, Mechanism of inflammation induced tissue injury in multiple sclerosis. 2008 J. Neurol.Sci. 274:45-4.
3. Brown AK, Fujita M, Fujimura Y et al. Radiation dosimetry and biodistribution in monkey and man of 11C-PBR28: a PET radioligand to image inflammation. J Nucl Med. 2007; 48: 2072-2079
4. Owen DR, Gunn RN, Rabiner EA etal. Mixed-affinity binding in humans with 18-kDa translocator protein ligands. JNuclMed. 2011; 52:24-32
5. Narayana P.A Magnetic Resonance Spectroscopy in the Monitoring of Mulctiple Sclerosis J Neuroimaging, 2005: 15 (4 Suppl); 46S-57S
6. Datta G, Violante IR et al Translocator positron emission tomography and magnetic resonance spectroscopic imaging of brain glial cell activation in multiple sclerosis
Figures