1973
Microglia activation in multiple sclerosis lesions drives structural changes over time and correlates with clinical progression1Brain and Spine Institute - ICM, Paris, France, 2King's College London, London, United Kingdom, 3University of Siena, Siena, Italy
Synopsis
In this study we develop a new method to generate individual maps of activated microglia from 18F-DPA-714 positron emission tomography images and we use it to reproduce in-vivo the histopathological classification of multiple sclerosis white matter lesions. This method allowed us to identify chronically active lesions which are not detectable with standard MRI. These lesions were found to be the most structurally dynamic over time, having a higher chance of enlarging or shrinking after one year. Furthermore, a higher number of active lesions was associated with a more severe clinical progression.
Introduction
Evidence from neuropathological studies suggests that activated microglia, the resident brain innate immune response cells, plays a key role in the pathogenesis of multiple sclerosis (MS), particularly in its progressive form1. Microglial activation can be measured in-vivo using a second generation positron emission tomography (PET) radiotracer binding to the 18-kDa translocator protein (TSPO), the 18F-DPA-7142.
The objective of this study was to: (i) identify individual profiles of microglial activation in patients with MS using 18F-DPA-714 PET; (ii) classify lesions according to their histopathological profile; and (iii) correlate lesions classes with their structural changes over time and with clinical progression.
Methods
38 patients with MS (11 relapsing-remitting, 15 secondary progressive, 12 primary progressive), and 19 healthy controls (HC), underwent 90 min 18F-DPA-714 PET exam and 3T MRI at baseline. Twenty-nine patients underwent a second MRI scan after one year. MRI protocol included a 3D-T1 MPRAGE (1x1x1.1 mm), a T2-TSE (0.9x0.9x3 mm) and a T1 SE pre- and post-gadolinium injection (1x1x3mm).
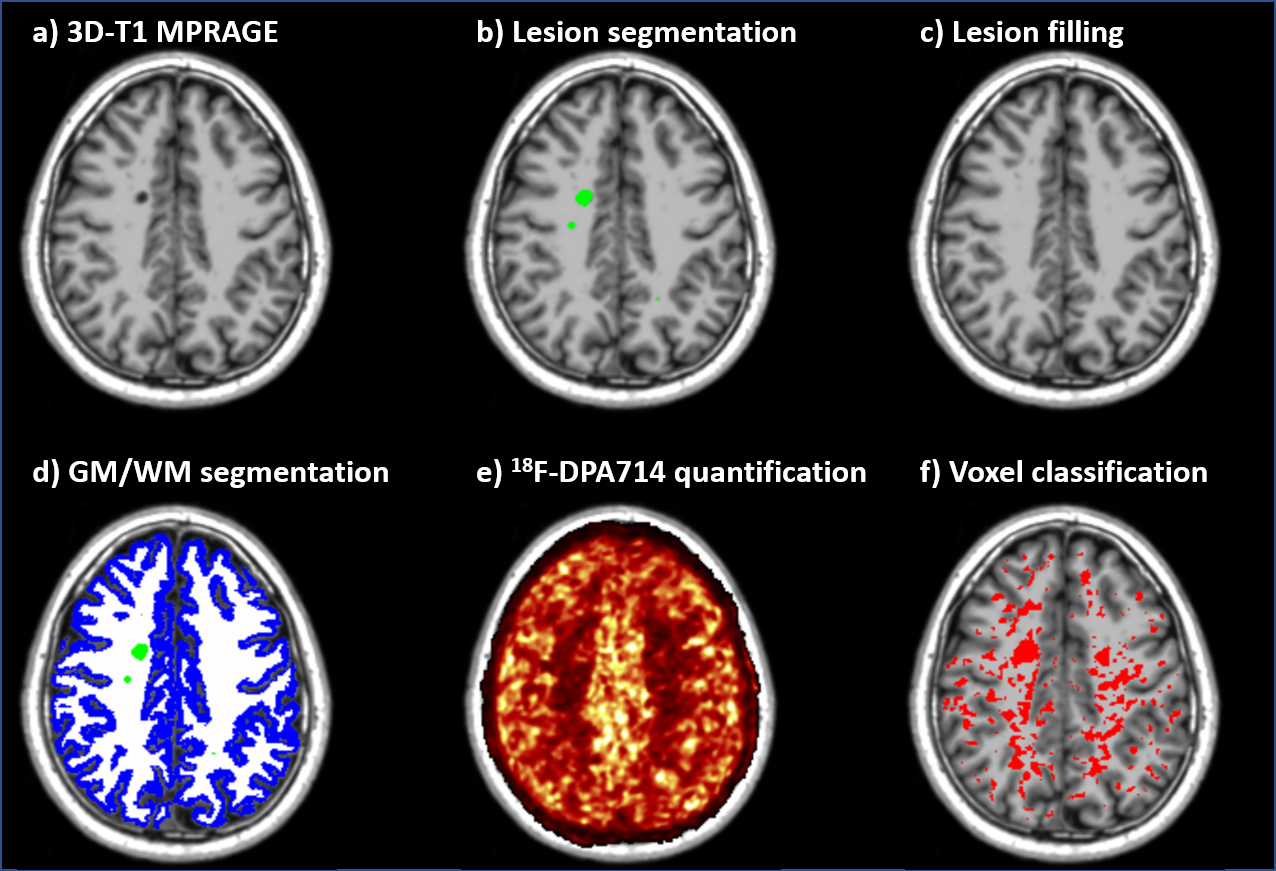
T2 hyperintense lesions were manually segmented at baseline and lesion volume change at follow-up was measured from T2 subtraction maps3. T1 images were corrected for bias field inhomogeneities4 and lesions were filled as previously described5. T1 images were segmented and normalized to MNI using FreeSurfer and ANTs respectively (Fig 1a-d).
PET images were motion corrected and quantified with Logan graphical analysis6 based on reference region extracted using a supervised clustering algorithm7. The resulting parametric maps of distribution volume ratio (DVR) were coregistered to the T1 and normalized to MNI (Fig 1e).
Voxel-wise permutation-based analysis, adjusted for age, gender and TSPO gene polymorphism, was performed to identify regions of significant difference in DVR between patients and controls. The percentage difference of DVR between groups in those regions was calculated and used as a threshold to classify each voxel of each subject as activated or not. Each voxel was classified as active if the percentage difference between its DVR value and the mean DVR values of the corresponding voxels in HC, was greater than the previously calculated threshold. This allowed to generate an individual map of activated microglia for each subject (Fig. 1f).
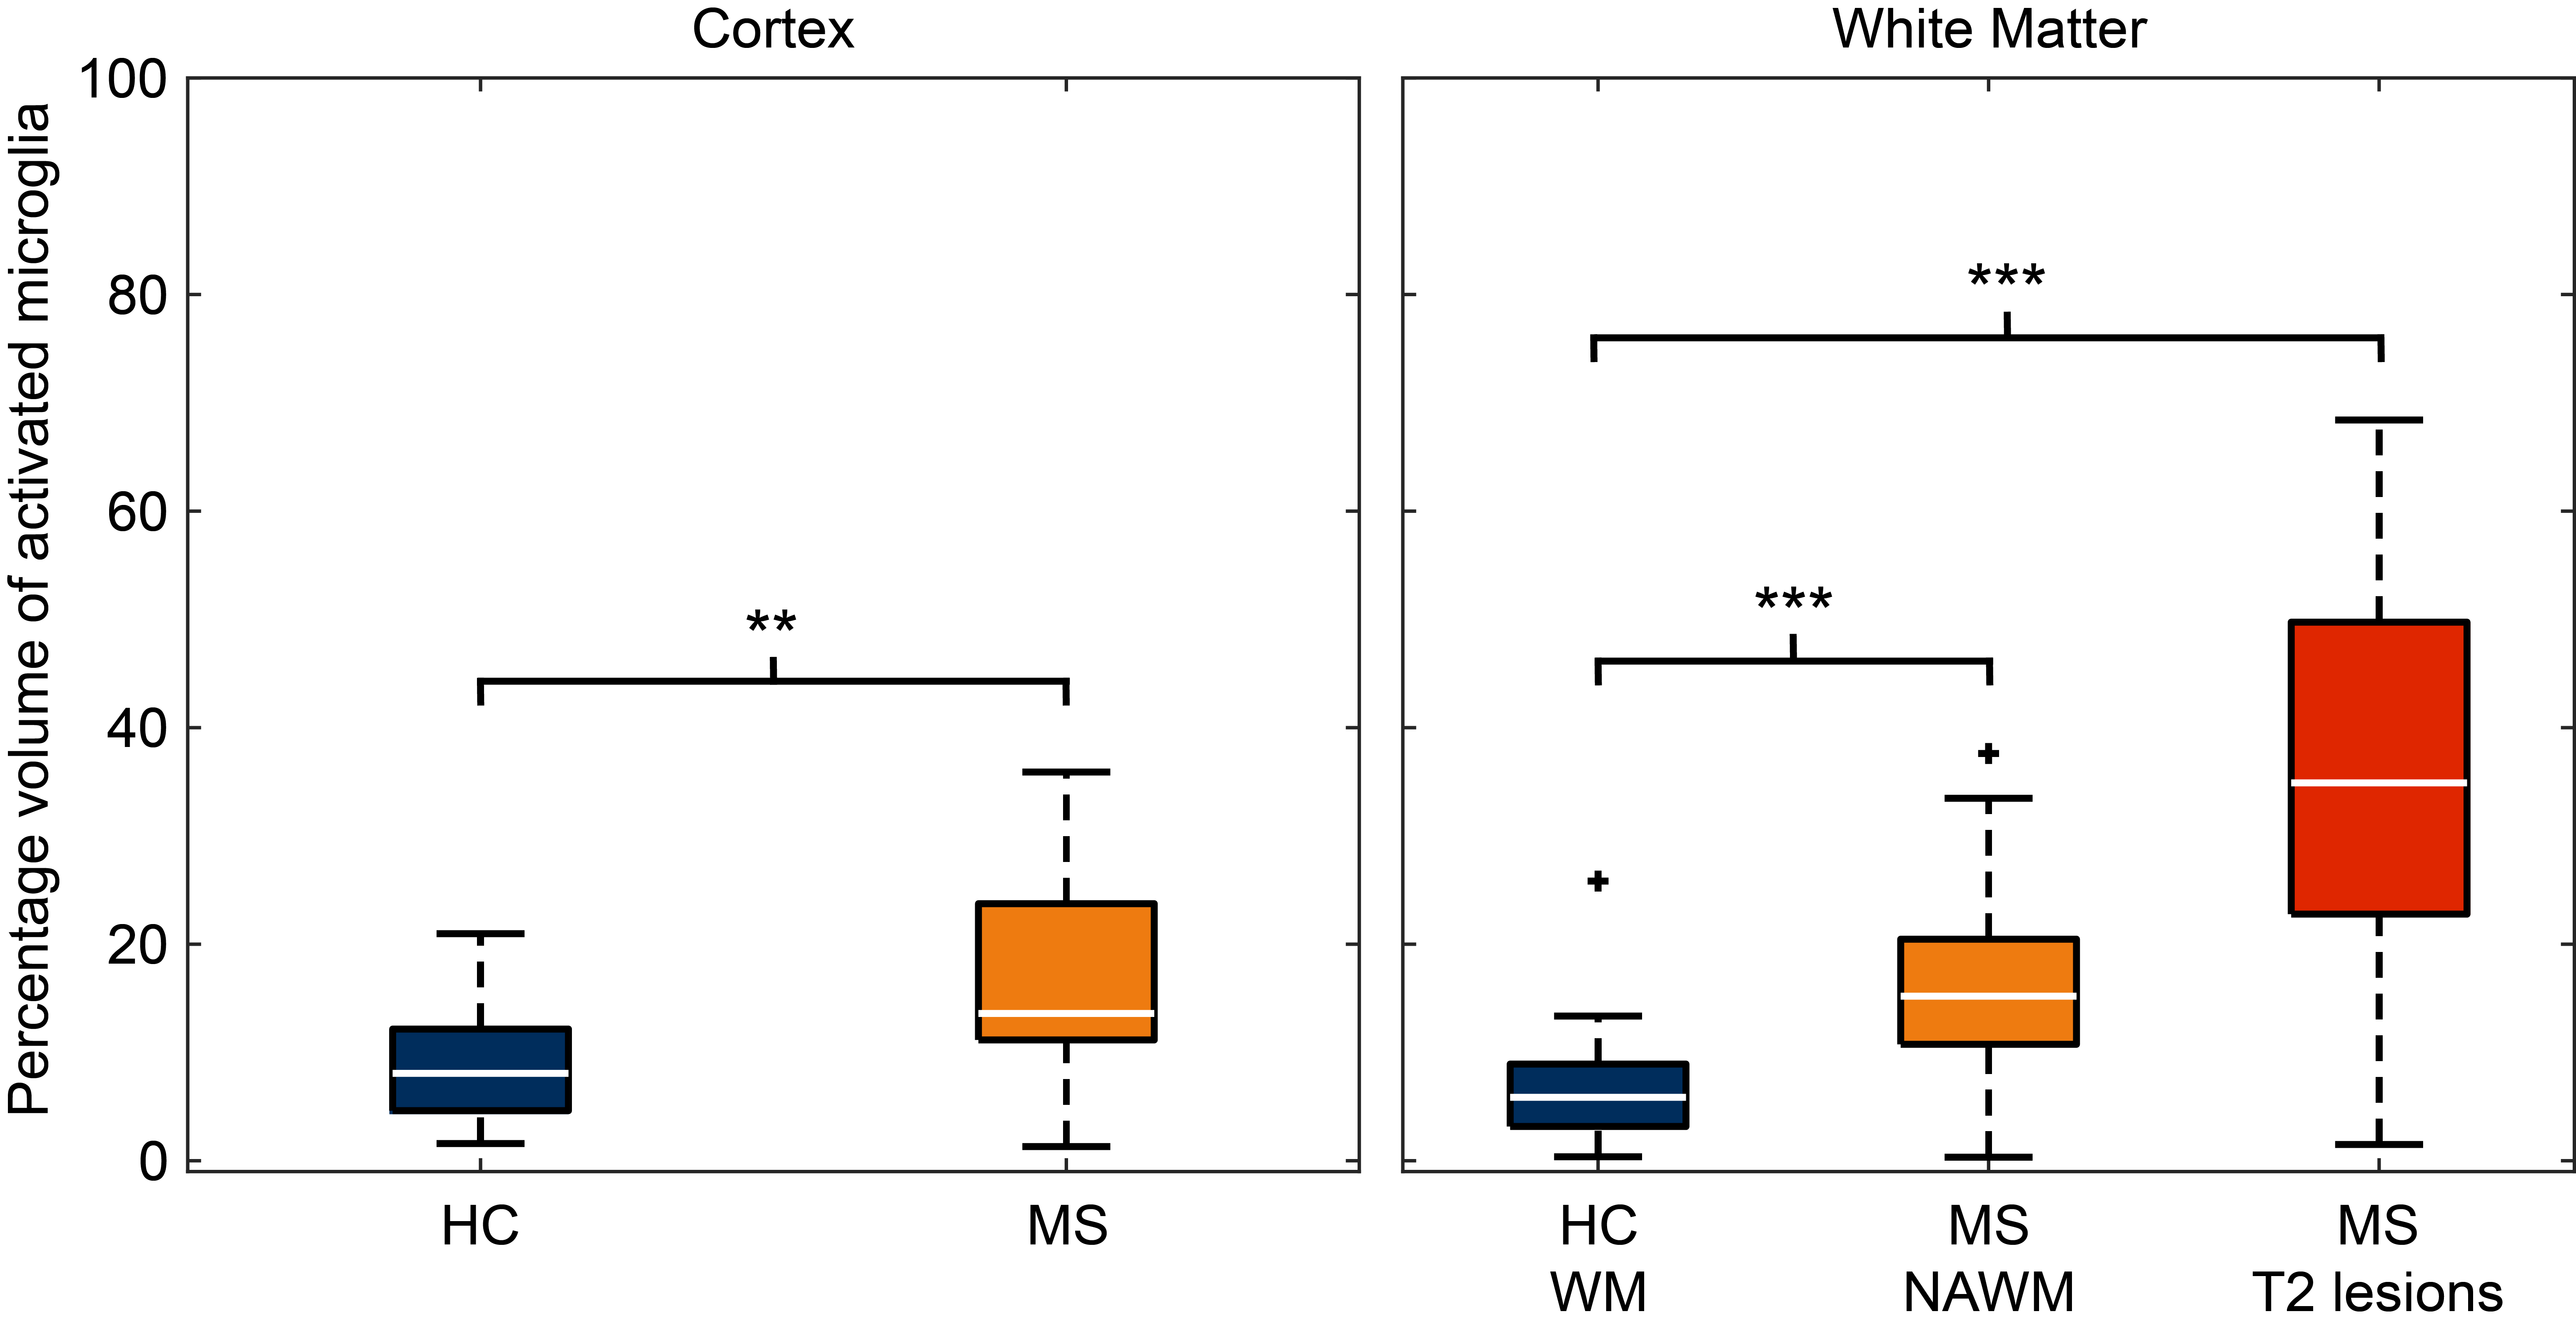
In each patient, the percent volume of activated microglia (PVAM) over total T2-w lesions, normal-appearing white matter (NAWM) and cortical volume, was calculated. In HC, the PVAM was calculated over WM and grey matter (GM) volume. Multiple linear regressions adjusted for age and gender were used to compare the PVAM in the different regions between patients and HC.
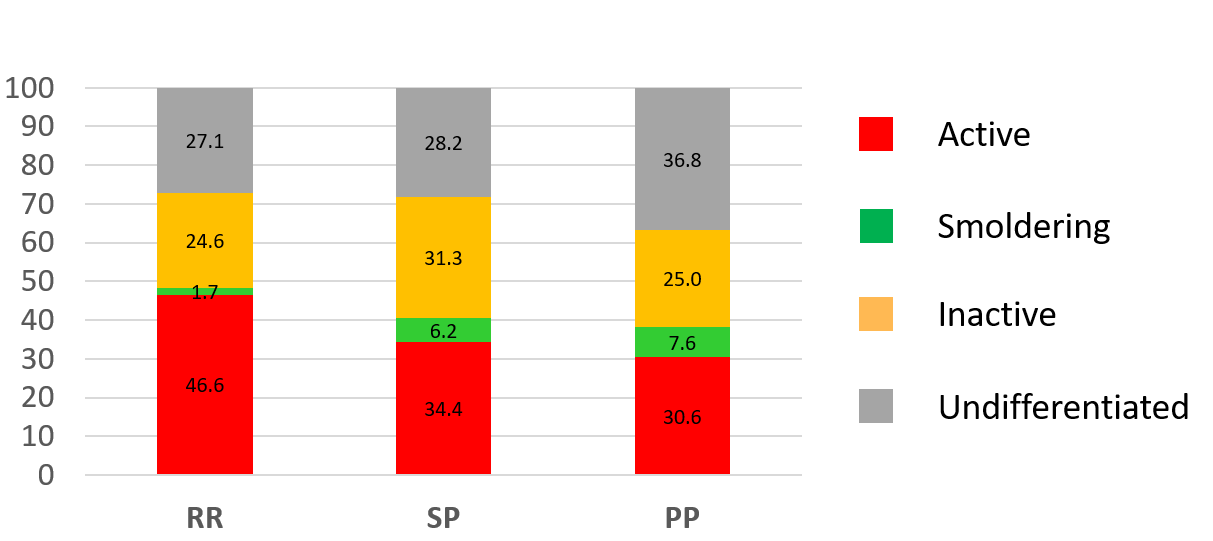
Each lesion was then classified as active (more than 50% of activated voxel), inactive (less than 10% in the lesion and less than 20% in the perilesional area), or smoldering (less than 10% in the lesion but more than 20% in the perilesional area), based on the extent and localization of activated microglia.
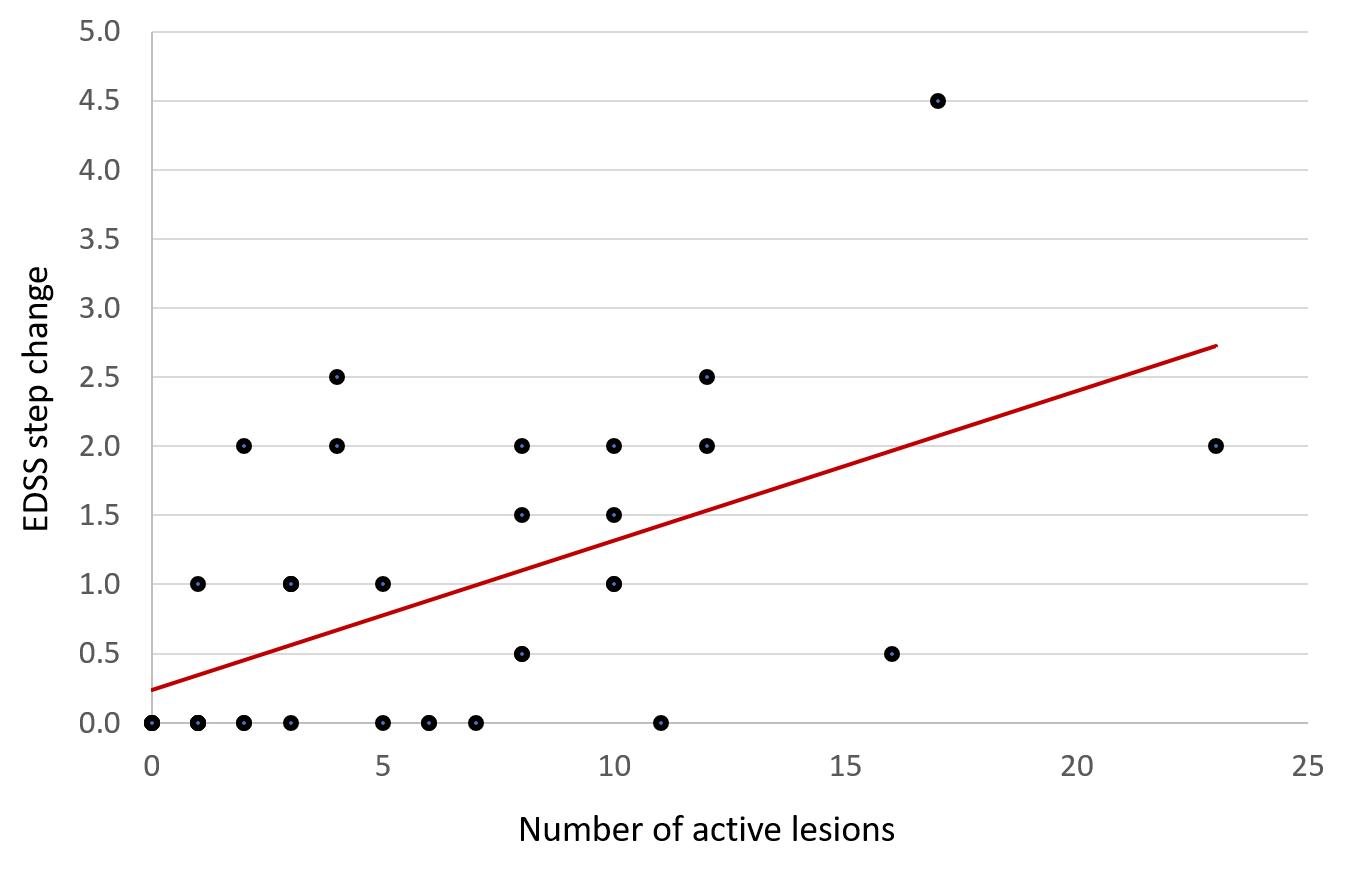
The number and percentage of lesions of each class were calculated in each disease form. The chance of each lesion class to change volume after one year (enlarging or shrinking) was evaluated using logistic regressions. Finally, a multiple linear regression was used to correlate the number of lesion subtypes with the clinical evolution (measured as change in Expanded Disability Status Scale – EDSS) in the two years preceding the PET exam.
Results
In patients, the percentage of activated microglia was higher in T2-w lesions (33%, p=0.0001), NAWM (10%, p=0.001) and GM (11%, p=0.0013), compared to HC’s WM and GM respectively (Fig. 2).
In total, 710 lesions were identified at baseline, 231 of which were classified as active (in contrast to only 3 gadolinium-enhancing lesions found in the whole cohort), 194 as inactive and 42 as smoldering.
Active lesions were found in all form of disease, while smoldering lesions were almost exclusively found in progressive patients (Fig. 3).
10% of all lesions changed volume after one year (7% enlarged, 3% shrank). Active lesions were more likely to change over time, with an odd ratio of 2.3 (p=0.026) to enlarge at the second time point, and an odd ratio of 5.7 (p=0.024) to shrink compared to inactive lesions.
A higher number of lesions classified as active correlated with a greater EDSS step change (beta coefficient=0.76, p=0.001, Fig. 4)
Conclusion & Discussion
Individual mapping of microglial activation generated from 18F-DPA-714 PET images allowed the in-vivo characterization of chronically active lesions which were not detectable with MRI in patients with MS. These lesions were the most structurally dynamic over time, having a higher chance of enlarging or shrinking after one year. Furthermore, a higher number of active lesions was associated with a more severe clinical progression.Acknowledgements
References
1. Kutzelnigg, A. et al. Cortical demyelination and diffuse white matter injury in multiple sclerosis. Brain 128, 2705–2712 (2005).
2. Lavisse, S. et al. Optimized Quantification of Translocator Protein Radioligand 18F-DPA-714 Uptake in the Brain of Genotyped Healthy Volunteers. J. Nucl. Med. 56, 1048–54 (2015).
3. Battaglini, M. et al. Automated identification of brain new lesions in multiple sclerosis using subtraction images. J. Magn. Reson. Imaging 39, 1543–1549 (2014).
4. Tustison, N. J. et al. N4ITK: improved N3 bias correction. IEEE Trans. Med. Imaging 29, 1310–20 (2010).
5. Chard, D. T., Jackson, J. S., Miller, D. H. & Wheeler-Kingshott, C. A. M. Reducing the impact of white matter lesions on automated measures of brain gray and white matter volumes. J. Magn. Reson. Imaging 32, 223–228 (2010).
6. Logan, J. et al. Distribution Volume Ratios Without Blood Sampling from Graphical Analysis of PET Data. J. Cereb. Blood Flow Metab. 1, 834–840 (1996).
7. García-Lorenzo, D. et al. Validation of an automatic reference region extraction for the quantification of [ 18 F]DPA-714 in dynamic brain PET studies. J. Cereb. Blood Flow Metab. 0271678X1769259 (2017). doi:10.1177/0271678X17692599
Figures