1972
Periventricular innate immune cell activation drives tissue damage and clinical progression in multiple sclerosis1Institut du Cerveau et de la Moelle épinière (ICM), Inserm U 1127, CNRS UMR 7225, Sorbonne Universités, UPMC Univ Paris 06 UMR S 1127, Paris, France, 2Neurology Department, St Antoine Hospital, APHP, Paris, France, Paris, France
Synopsis
The objective of this study was to investigate the role of activated microglia in the periventricular damage of patients with MS, combining positron emission tomography with [18F]DPA714 and magnetisation transfert ratio (MTR). Using two-mm thick rings from the ventricular CSF surface to periventricular WM and thalamus, we describe the presence of a gradient of activated microglia together with a gradient of MTR, which correlate with the clinical worsening of patients. These results suggest that an increase of activated microglia and tissue damage might be triggered by the presence of CSF-derived factors, and could mediate the subsequent development of neuro-axonal irreversible damage in MS.
Introduction
A large amount of evidence indicates that the periventricular area, which includes periventricular white matter (PWM) and thalami (TH), is particularly susceptible to lesion accumulation1 and volume loss2 in Multiple Sclerosis (MS). Recent studies have demonstrated the presence of a gradient of tissue damage in the areas close to the cerebrospinal fluid (CSF). Combined with the observations from post-mortem studies3,4, these data suggest that CSF-derived factors infiltrating surrounding tissues may be involved in tissue damage affecting periventricular regions in MS. However, the mechanisms underlying this gradient of tissue damage is yet to be clarified. The objective of this study was to investigate the role of activated microglia in the periventricular damage of patients with MS, combining positron emission tomography (PET) with [18F]DPA714, a second generation TSPO tracer which specifically targets activated innate immune cells, and magnetisation transfert ratio (MTR), a MRI metric sensitive to microstructural damage.Methods
Thirty-five patients with MS (10 relapsing-remitting, 11 primary progressive, 14 secondary progressive) and 19 healthy controls were recruited. Disability progression was evaluated using the Expanded Disability Status Scale change over the two years preceding study entry (delta EDSS). All subjects underwent a 3T MRI protocol including magnetization transfer (MT) imaging and a 90-min [18F]DPA714-PET. A non-invasive PET quantification approach was used, based on reference regions extracted through a supervised clustering approach5 (Fig 1.A). Individual maps of microglial activation (expressed as percent volume of activated microglia, PVAM, Fig 1.B) were derived from voxel-wise differences in the tracer binding between patients and controls. Magnetisation transfer ratio (MTR) maps were derived from MT sequences. Two-mm thick rings from the ventricular CSF surface to PWM and TH were used to calculate the gradient in activated microglia and in MTR (Fig 2). ANCOVA corrected for age, gender and brain volume was used to test for differences between patients and controls in mean PVAM, MTR, and slopes of periventricular gradients in PWM and TH. A 3-level hierarchical linear regression model was used to assess the relationship between PET/MRI and clinical variables, where delta EDSS was entered as dependent variable, and age and gender as confounding factors (level 1). The gradient in activated microglia and the level of activated microglia in the first periventricular ring were entered as independent variables (level 2), and the gradient of MTR and level of MTR in the first periventricular ring were then included as additional explaining factors (level 3).Results
The first ring of WM close to CSF showed a higher level of microglia activation (p=1e-5, Fig 3.A) and lower MTR values (p=2e-4, Fig 4.A) in patients compared to controls. Patients showed increased microglial activation (p=1e-4, Fig3.C), but not reduced MTR values, in the first ring of TH in comparison with controls. The level of microglial activation decreased moving further from the ventricles, with a gradient that was significantly steeper in patients compared to control (PWM p=3e-3, Fig 3.B ; TH p=8e-4, Fig 3.D). Conversely, MTR values increased with the distance from CSF, generating a gradient which was significantly steeper in patients compared with controls in PWM only (p=1e-4, Fig 4.B). The gradient in activated microglia and the gradient in MTR in PWM were inversely correlated with each other (R2=0.29; p=2e-3). Age and gender did not predict the delta EDSS (R2=0.008, p=0.9). When the gradient and the level of microglial activation in the first ring of PWM were included in the hierarchical model, there was a significant increase in the explained variance of delta EDSS (R2 change=0.375, p=0.001, Fig 5.A). Adding the WM gradient of MTR and the mean MTR in first PWM ring further improved the explained variance of the dependent variable. (additional R2 change=0.273, p=0.003, Fig 5.B).Conclusion & Discussion
We used [18F]DPA714-PET to demonstrate that, in patients with MS, activated microglia was highest in the tissues adjacent to the ventricles and progressively decreased with distance from them. This gradient in activated microglia showed a moderate correlation with the gradient of tissue damage detected with MTR. This suggests that MTR reflects multiple components of microstructural damage but are not limited to microglial activation. The level of tissue damage around the ventricles, measured by a combination of PET- and MTR-derived metrics, was significantly correlated with the progression of clinical disability over the 2 years preceding study entry. The increase in the activation of the innate immune system and the accumulation of tissue damage in periventricular areas might be triggered by the presence of CSF-derived factors, and could mediate the subsequent development of neuro-axonal irreversible damage in MS.Acknowledgements
EP, CB, MT and GB have nothing to disclose. BB was supported by the ARSEP post-doctoral research fellowship. BS received honoraria from Biogen, Teva, Novartis, Genzyme, and research support from Genzyme and Merck-Serono. Project funding : ANR MNP-2008-007125, “Investissement d’avenir” ANR-10-IAIHU-06, MS research foundation ARSEP, INSERM, ECTRIMS, JNLF, FRM, Sponsored by APHPReferences
1. JEHNA M., et al. Periventricular lesions correlate with cortical thinning in multiple sclerosis. Annals of neurology, 2015, vol. 78, no 4, p. 530-539.
2. RUDICK R. A., et al. Use of the brain parenchymal fraction to measure whole brain atrophy in relapsing-remitting MS. Neurology, 1999, vol. 53, no 8, p. 1698-1698.
3. MAGLIOZZI R, et al. Meningeal B-cell follicles in secondary progressive multiple sclerosis associate with early onset of disease and severe cortical pathology. Brain, 2007, vol. 130, no 4, p. 1089-1104.
4. MAGLIOZZI R., et al. A gradient of neuronal loss and meningeal inflammation in multiple sclerosis. Annals of neurology, 2010, vol. 68, no 4, p. 477-493.
5. GARCÍA-LORENZO, D., et al. Validation of an automatic reference region extraction for the quantification of [18F] DPA-714 in dynamic brain PET studies. Journal of Cerebral Blood Flow & Metabolism, 2017, p. 0271678X17692599.
Figures
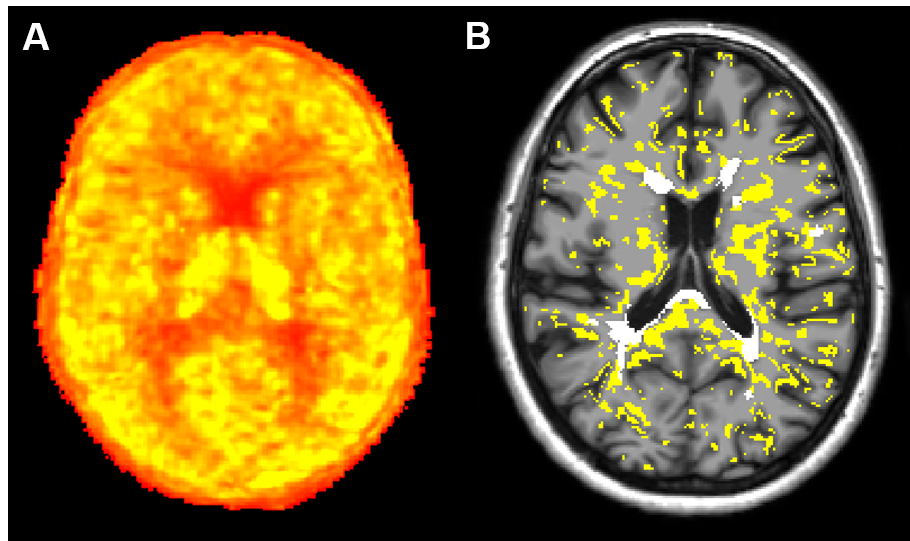
Fig 1: [18F]DPA714 quantification and individual map of activated microglia
A) Parametric map of [18F]DPA714 obtained using Logan graphical analysis with reference region extracted with a supervised clustering approach. B) Individual map of activated microglia generated by thresholding the parametric map. The percentage difference DVR between groups was used as a threshold to classify each voxel of each subject as activated or not. In yellow are represented voxels of activated microglia, in white lesional voxels.
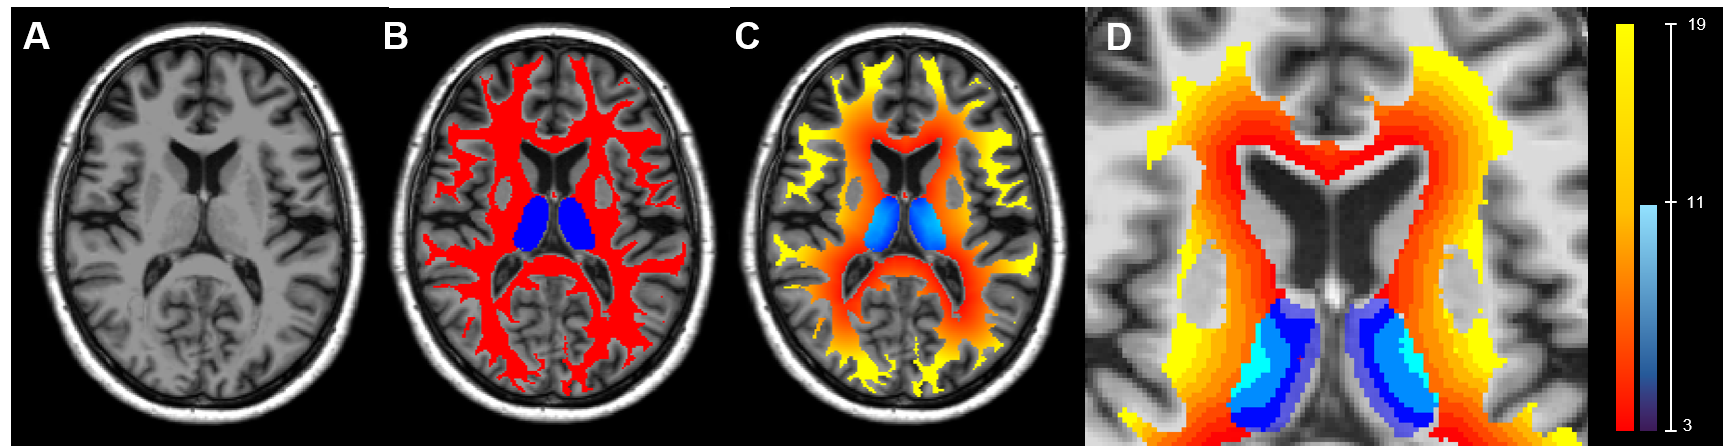
Fig 2 : Step to generate 2mm thick ring from CSF to adjacent WM and TH
T1-weighted images (A) were segmented using Freesurfer and First obtaining WM and TH masks (B, red and blue respectively). Distance maps from the CSF were calculated in both masks (C) and divided in 2mm wide rings (D).
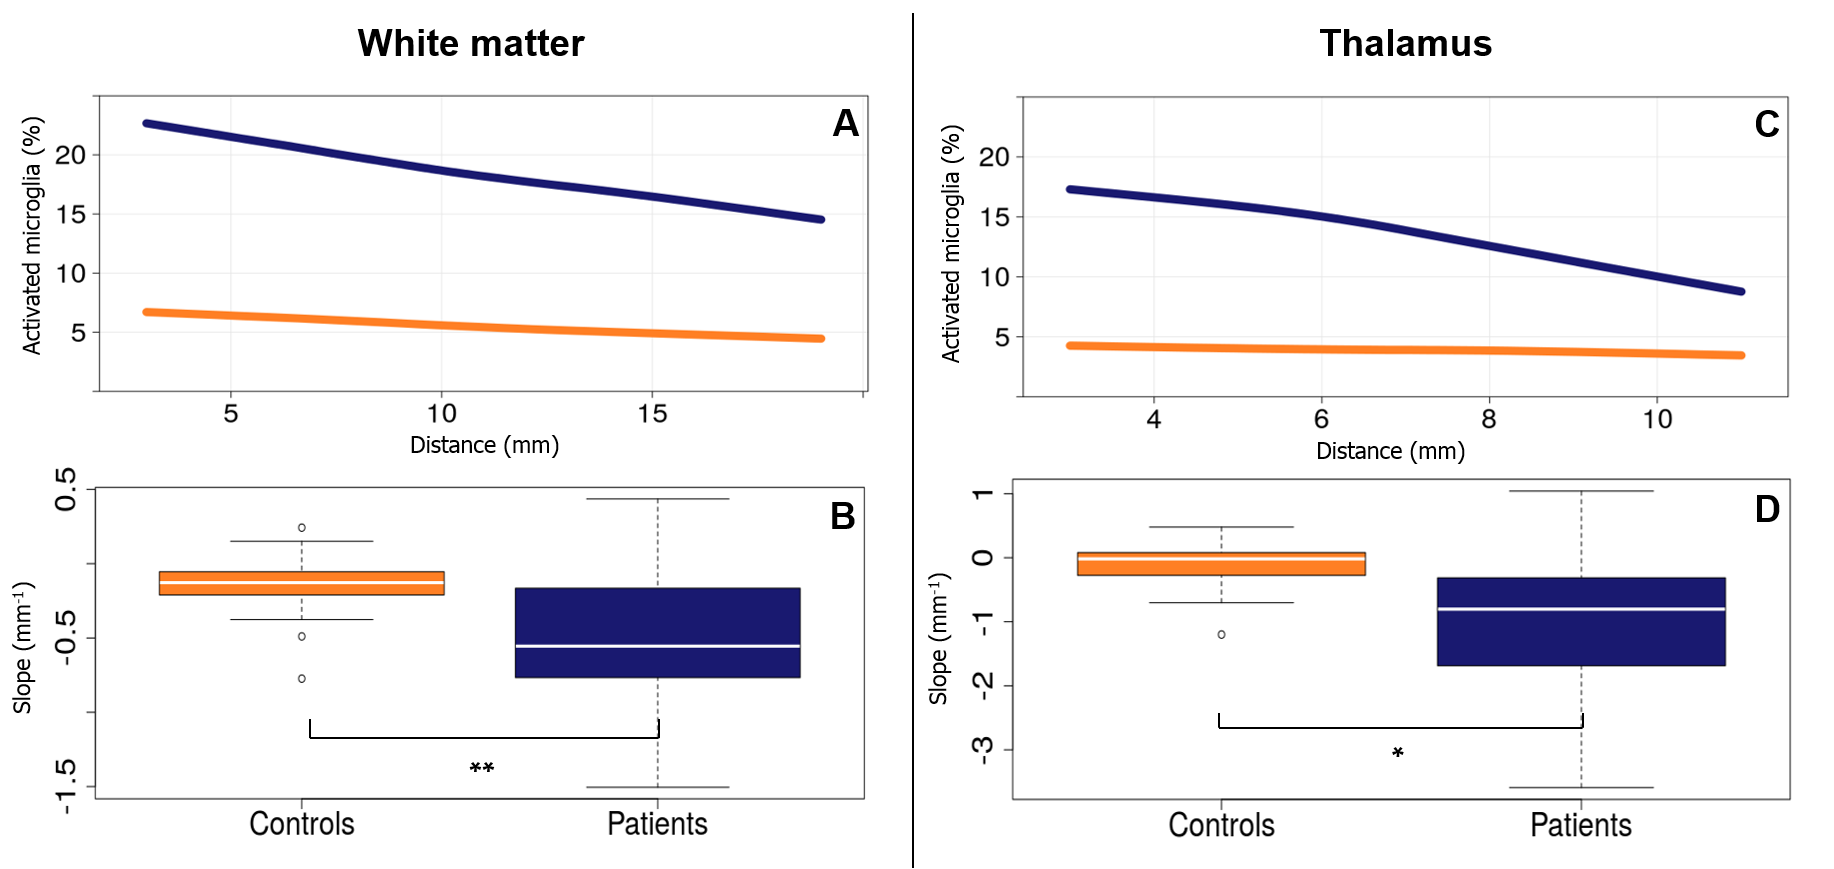
Fig 3 : Periventricular gradient of activated microglia in MS patients
Upper panels show the average level of microglia activation in function of the distance from the CSF in patients (blue) and controls (orange) in WM (Panel A) and TH (Panel C). Bottom panels show the differences of the gradients of microglia activation between patients (blue) and controls (orange) in the same regions.
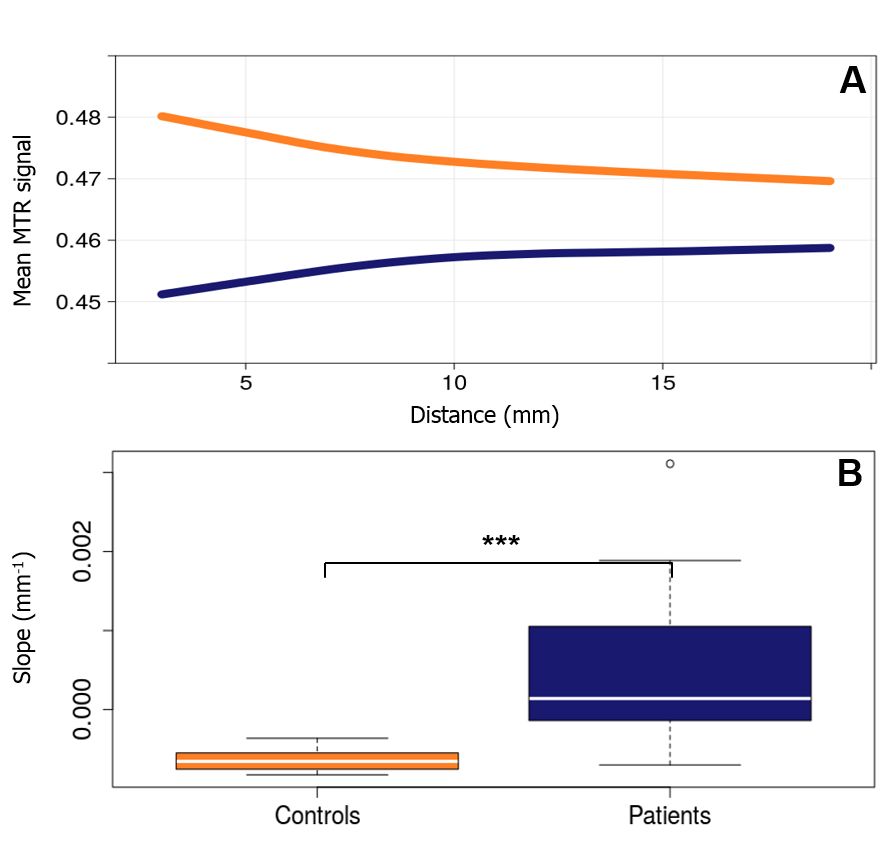
Fig 4 : Periventricular gradient of MTR in MS patients
Panel A shows the average level of MTR in function of the distance from the CSF in patients (blue) and controls (orange) in WM. Panel B shows the differences of the gradients of MTR between patients (blue) and controls (orange) in the same region.
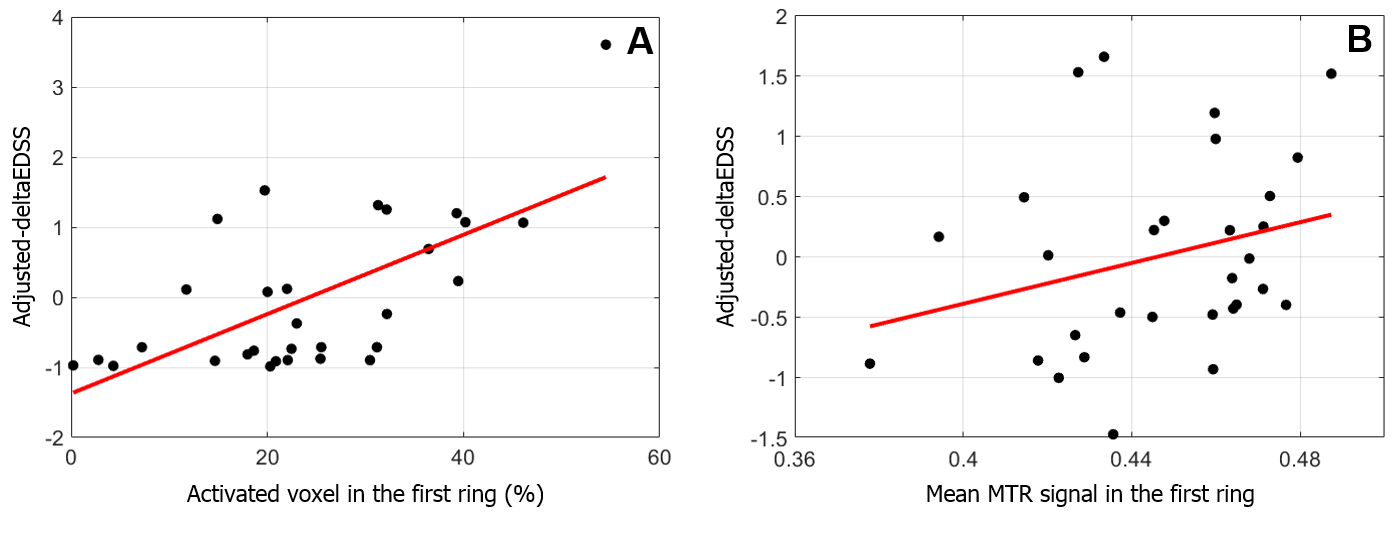
Fig 5 : Correlation of activated microglia and MTR level with the progression of clinical disability
Panel A shows the correlation between the percentage of activated microglia in the first ring of white matter and the deltaEDSS adjusted for age and gender (first level of the hierarchical regression). Panel B shows the correlation between the mean MTR signal in the first ring of white matter and the deltaEDSS adjusted for age, gender, percentage of activated microglia in the first WM ring and slope of microglia activation in WM (first and second levels of the hierarchical regression).