1965
Differentiating Neuromyelitis Optica (NMO)-related and Multiple Sclerosis-related Acute Optic Neuritis using Conventional Magnetic Resonance Imaging Combined with Readout-segmented Echo-planar Diffusion-weighted Imaging1Eye & ENT hospital of Fudan University, Shanghai, China, 2Siemens Ltd, Shanghai, China
Synopsis
In clinical practice, acute optic neuritis (ON) associated with the development of neuromyelitis optica (NMO) after the first attack is often indistinguishable from that associated with multiple sclerosis (MS)1-3; and different therapeutic strategies are required for the two diseases because of their immunopathogenic differences4. Therefore, we aimed to determine the optimal combination of features derived from conventional magnetic resonance imaging (MRI) and diffusion-weighted imaging using readout-segmented echo-planar imaging (RESOLVE-DWI) for the differentiation of the two types of acute ON.
Synopsis
In this study, in order to differentiate between the NMO-related and MS-related acute optic neuritis, we aimed to determine the optimal combination of imaging features obtained from conventional magnetic resonance imaging (MRI) and diffusion-weighted imaging using readout-segmented echo-planar imaging (RESOLVE-DWI). A multivariate logistic regression analysis was used to identify the most significant variables, and receiver operating characteristic curve analyses were performed to determine the ability of a combined diagnostic model. In conclusion, the combination of the ADC value and chiasm involvement appears to be effective for discriminating these two types of acute ON.Purpose
In clinical practice, acute optic neuritis (ON) associated with the development of neuromyelitis optica (NMO) after the first attack is often indistinguishable from that associated with multiple sclerosis (MS)1-3; and different therapeutic strategies are required for the two diseases because of their immunopathogenic differences4. Therefore, we aimed to determine the optimal combination of features derived from conventional magnetic resonance imaging (MRI) and diffusion-weighted imaging using readout-segmented echo-planar imaging (RESOLVE-DWI) for the differentiation of the two types of acute ON.Methods
Fifty-four patients with acute ON (NMO-related cases: 26, MS-related cases: 28) were enrolled in this study. Conventional MRI (T1WI, T2WI and contrast-enhanced T1WI) and RESOLVE-DWI images taken within four weeks of their initial attack were included in our evaluation. All the examinations were performed with a 3 T scanner (MAGNETOM Verio, Siemens Healthcare, Erlangen, Germany) using a 32-channel head coil. The features detected by conventional MRI (including laterality, the enhancement pattern, and the extent and position of involvement) and the apparent diffusion coefficient (ADC) measurements were retrospectively compared between the NMO-related and MS-related groups. The parameters for axial/coronal RESOLVE-DWI were as follows: TR, 2700/4000 ms; TE, 68/83 ms; thickness, 2/3 mm; gap, 0.2/0.3 mm; FOV, 210×210/145×145 mm2; acquisition matrix, 192×192/192×192; 9/9 segments; [z1] b value 800/800 s/mm2; NEX, 1/2; and acquisition time, 4/5.5 min. ADC maps were automatically generated on the MR workstation. In order to demonstrate the image quality differences between RESOLVE-DWI and single-shot echo-planar imaging (SS-EPI) DWI, both sequences were performed on several volunteers. The SS-EPI parameters are: TR, 2700/4000 ms; TE, 98/86 ms; thickness, 2/3 mm; gap, 0.2/0.3 mm; FOV, 210×210/150×150 mm2; acquisition matrix, 192×192/192×192; b value, 800/800 s/mm2; NEX, 10/8; and acquisition time, 2.2/3.1 min. An imaging comparison between RESOLVE and SS-EPI is shown in Fig. 1. A multivariate logistic regression analysis was used to identify the most significant variables, [YX2] and receiver operating characteristic curve analyses were performed to determine the ability of a combined diagnostic model based on the qualitative and quantitative characteristics identified in this study to differentiate the two conditions. P values <0.05 were considered statistically significant. [z1]请和技师老师确认,RESOLVE是分几段读出的 [YX2]The variable or imaging features info should be providedResults & Discussion
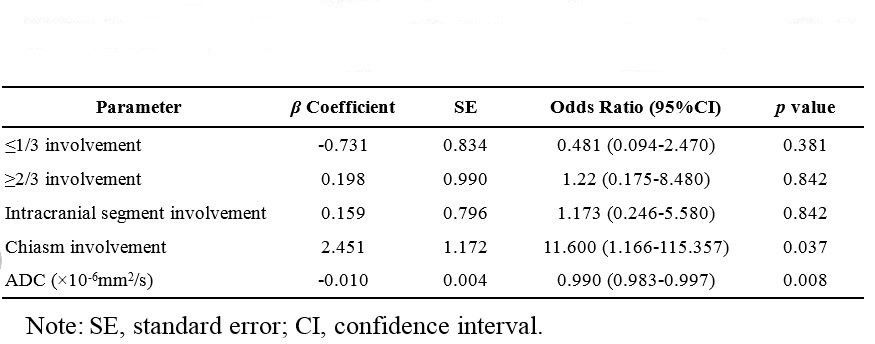
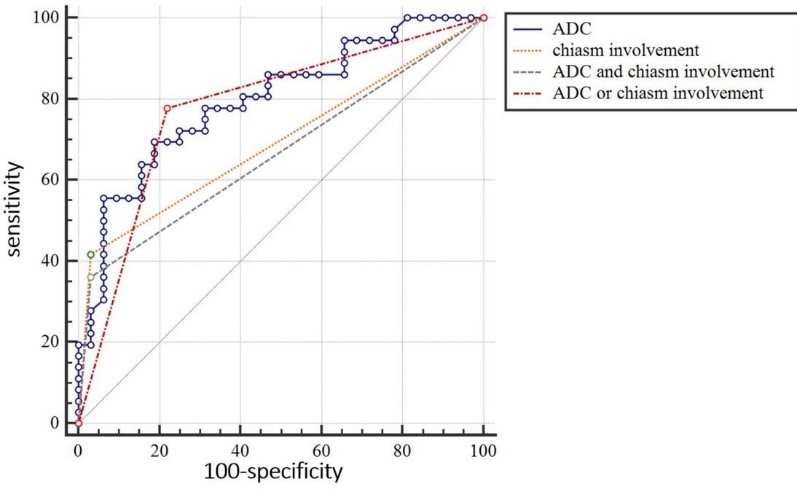
As shown in Table 1, the multivariate logistic regression analyses indicated that the presence of chiasm involvement and lower ADC values derived from RESOLVE DWI were significantly associated with NMO-related acute ON compared with MS-related acute ON (p=0.037 and 0.008 respectively). The diagnostic criterion of chiasm involvement or “ADC<791×10-6 mm2/s and chiasm involvement” had the highest specificity (96.9%), and “ADC<791×10-6 mm2/s or chiasm involvement” showed the optimal sensitivity (77.8%) for differentiating NMO-related from MS-related acute ON. Figures 2-3 show the conventional and diffusion MR images of representative patients with NMO-related and MS-related acute ON, and the results of the ROC curve analysis are summarized in Fig. 4. Therefore, we suggest using “ADC<791×10-6 mm2/s or chiasm involvement” as the filtering metric to identify patients who should be suspected to have NMO-related acute ON, and the combination of “ADC<791×10-6 mm2/s and chiasm involvement” should be used as the indicator for diagnosing NMO-related acute ON.Conclusions
This study demonstrates that chiasm involvement and the ADC measurements were the two most significant MRI features allowing the differentiation of NMO-related from MS-related acute ON. The diagnostic accuracy would be improved by adding a quantitative analysis of the RESOLVE-DWI data to orbital conventional MRI alone. Therefore, the combined diagnostic model used in this study might prompt further patient evaluation for differentiating NMO-related and MS-related acute ON.Acknowledgements
No acknowledgement foundReferences
1. Toosy AT, Mason DF, Miller DH. Optic neuritis. The Lancet Neurology 2014;13:83-99.
2. Barnett Y, Sutton IJ, Ghadiri M, et al. Conventional and advanced imaging in neuromyelitis optica. AJNR Am J Neuroradiol 2014;35:1458-66.
3. Wingerchuk DM, Lennon VA, Lucchinetti CF, et al. The spectrum of neuromyelitis optica. The Lancet Neurology 2007;6:805-815.
4. Palace J, Leite MI, Nairne A, et al. Interferon Beta treatment in neuromyelitis optica: increase in relapses and aquaporin 4 antibody titers. Arch Neurol 2010;67:1016-7.
Figures