1958
Setting up a Multi-centric Multiparametric hMRI Protocol for the Investigation of Temporal Lobe Epilepsy1C. Mondino National Neurological Institute, Pavia, Italy, 2University of Pavia, Pavia, Italy, 3IRCCS Foundation, C. Besta Neurological Institute, Milan, Italy, 4Civile Aziende Ospedaliera-Universitaria, Modena, Italy, 5University of Modena and Reggio Emilia, Modena, Italy, 6University College London, London, United Kingdom
Synopsis
Quantitative characterization of MT, R1, R2*, and PD may aid in providing more consistent readings of alterations in temporal lobe epilepsy. As part of a multi-centric study we have set up a hMRI protocol for use at 3T across two manufactures of MR scanners. Because of differences in MT pulses and SAR calculations, near matching was achieved only through use of commercial or research options. Initial results from one scanner show excellent reproducibility within and between subjects for MT and R1. A cross-scanner evaluation is in course.
INTRODUCTION
Temporal lobe epilepsy can be associated with hippocampal sclerosis, focal cortical dysplasia, low grade tumours and other focal lesions that can frequently, but not always be appreciated on conventional MR imaging at 1.5 or 3T.1 Quantitative characterization of MR tissue properties (including MT, R1, R2*, and PD) that can be associated with histopathological substrates (hMRI) has the potential to provide more consistent readings of alterations to the brain.2,3 As part of an Italian multi-centric study of temporal lobe epilepsy, we have set up a hMRI protocol for use at 3T across two manufactures of MR scanners.
METHODS
Resolution and timing parameters of 3D multi-echo PD, R1 and MT-weighted gradient-echo scans and B1 mapping based on prior publications2,3 were iteratively adapted to provide a common parameter set across 3T scanners from two manufacturers (Philips Achieva, Siemens Skyra). Constraints included: acquisition time below 20 minutes, and acquisition resolutions within 15% of the target 1mm isotropic resolution to avoid loss of grey-white boundary sharpness.
Software for hMRI analysis was used to generate MT, PD, R1 and R2* maps.4 Visual inspection of the source images and resulting maps was performed to identify artifacts. After unified registration and segmentation using the ICBM atlas into grey and white matter probabilities, a threshold of 50% was used to binarize each class against the Harvard-Oxford Atlas to produce ROIs of the hippocampi and temporal lobes. For each ROI, the mean and standard deviation of MT, R1, R2* and PD were extracted. We report here one center’s results with the protocol as mean and standard deviation of these values over 16 volunteers as well as the test-retest variability from three scans of two subjects on a single scanner.
RESULTS
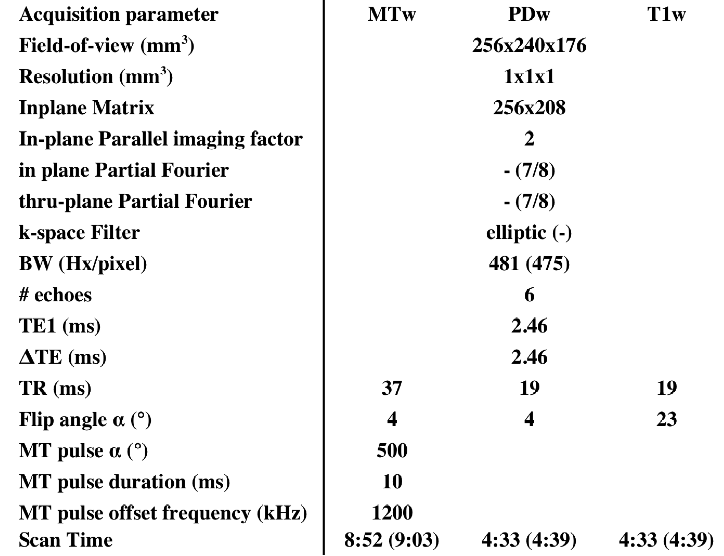
The final imaging parameters are detailed in Table 1. Notable differences between manufacturers involved the default MT pre-pulses and SAR estimation. A research agreement with one manufacturer allowed matching of MT pre-pulse angle and duration.
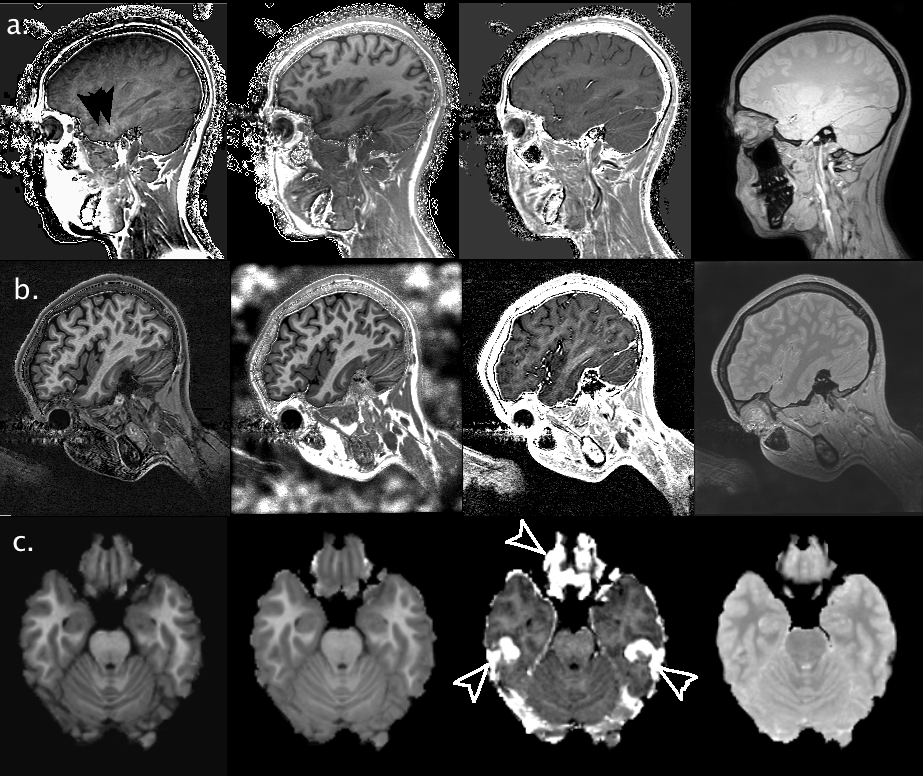
As the product of number of slices and echoes proved a limiting factor for one manufacturer, a sagittal acquisition was adopted to limit the number of slices required for whole brain coverage. Persistent ghosting from the eyes was noted propagating over the temporal lobes and hippocampus (Figure 1a), leading us to adopt a rotated sagittal geometry to ensure this artifact remains below the temporal poles (Figure 1b). The hMRI maps provide good depiction of anatomy, and although elevated R2* values are seen in the orbito-frontal cortex and the inferior temporal lobes the other maps appear relatively unaffected (Figure 1c).
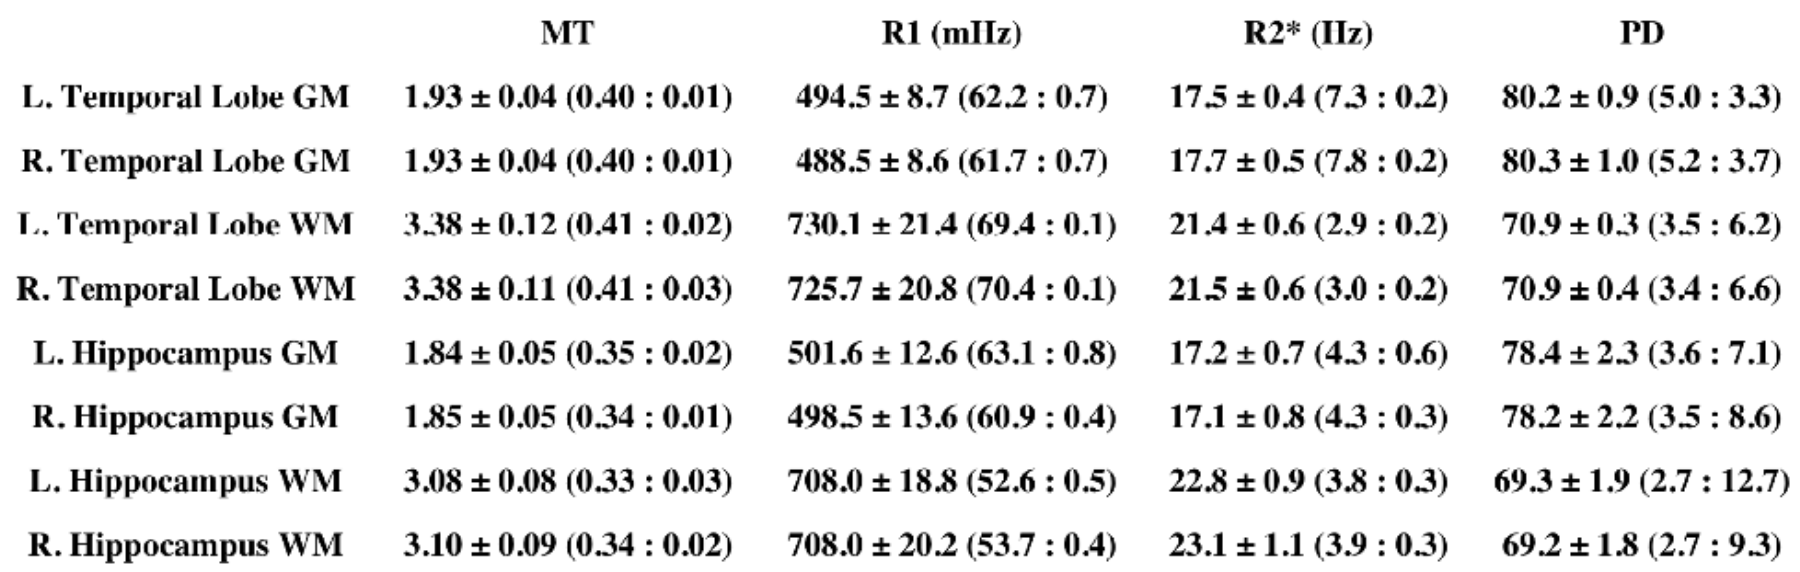
Averaged over the entire temporal lobe or hippocampus, hMRI values were very consistent across subjects with the variation in grey and white matter values generally being less 3% for MT, R1 and R2*; roughly a third the intrasubject variation (Table 2). Intra-subject reproducibility of mean values was within 1% for MT and R1, 10% for R2* and 15% for PD.
DISCUSSION
Using a liberal threshold for grey and white matter segmentation we observed a relatively large variability in properties within the temporal lobes and hippocampi of individual subjects. Despite this, the inter- and intra-subject reproducibility for whole lobe (hippocampus) values was below 3% and 1% respectively for both MT and R1. Greater variability in R2* values likely reflects the effects of magnetic field inhomogeneity in areas adjacent to large susceptibility differences, to which the other values appear relatively immune during map generation. Incorporating correction for imperfect spoiling and head coil sensitivity profiles into the workflow should further improve performance.
To allow study of the hippocampus we favored spatial resolution over speed of acquisition. In other applications, slight reductions of spatial resolution, combined with parallel imaging should permit significant reductions in scan time without substantial reductions in SNR. A strongly rotated sagittal acquisition visibly reduced the artifacts affecting images of the temporal lobes and hippocampus. Greater spoiling may help to reduce eye-movement related artifact, but would likely require increased scanning time. Inter-site variability is currently under investigation with volunteers undergoing hMRI scans on both models of MR scanner. This will aid in assessing the importance of some sequence characteristics (e.g. RF pulse shape, degree of gradient spoiling, and SAR models) that remain beyond user control.
CONCLUSION
We have demonstrated a hMRI mapping protocol for the study of temporal lobe epilepsy with isotropic 1mm resolution that yields good anatomical depiction and reproducibility of values across subjects in under 20 minutes on 3T scanners from two different manufacturers. It must be noted however, that this required the use of commercial or research options, which may limit use outside of the research context.Acknowledgements
We thank our colleagues who have supported our efforts: Emilio Perucca, Carlo Andrea Galimberti, Elena Tartara, Valentina De Giorigis (Neurological Institute C. Mondino, Pavia), Valeria Mariani, Alberto Citterio, Laura Tassi, (Epilepsy Surgery Center “C.Munari” Niguarda Hospital) Milano, and Laura Mirandola (University of Modena and Reggio Emilia); Rebecca Samson (University College London) for early suggestions of hMRI processing and scanning; and the contributors to the hMRI toolbox: Karsten Tabelow, Evelyne Balteau, Martina F. Callaghan, Bogdan Draganski, Tobias Leutritz, Antoine Lutti, Christophe Phillips, Enrico Reimer, Lars Ruthotto, Maryam Seif , Nikolaus Weiskopf, Gabriel Ziegler and Siawoosh Mohammadi. Funding support for this work was provided by the Italian Ministry of Health grant: NET2013-02355313.
References
- Tassi L, Meroni A, Deleo F, et al. Temporal lobe epilepsy: neuropathological and clinical correlations in 243 surgically treated patients. Epileptic Disord. 2009;11(4):281-292.
- Weiskopf N, Suckling J, Williams G, et al. Quantitative multi-parameter mapping of R1, PD*, MT, and R2* at 3T: a multi-center validation. Front Neurosci. 2013;7:9.
- Callaghan MF, Helms G, Lutti A, Mohammadi S, Weiskopf N. A General Linear Relaxometry Model of R1 Using Imaging Data. Magn Res Med. 2015;73:1309–1314.
- https://hMRI.info
Figures