1955
Comparison between two different post-processing techniques in the presurgical evaluation of Focal Cortical Displasya in a paediatric population.1Medical Physics Department, IRCCS Bambino Gesù Children’s Hospital, Rome, Italy, 2Imaging Department, IRCCS Bambino Gesù Children’s Hospital, Rome, Italy, 3Department of Neurosciences, IRCCS Bambino Gesù Children’s Hospital, Rome, Italy
Synopsis
The purpose of this study is to compare two different techniques for cortical dysplasia detection: Opti-MAP and the SUPR-FLAIR. The Opti-MAP is a children-optimized version of the Morphological analysis program (MAP), which is able to detect the “blurred-junction”, peculiar characteristics of focal cortical dysplasia in children, thanks to a voxel-based morphological analysis in which neuroanatomical differences are detected by comparison with a normal template. The SUPR-FLAIR analysis, instead, is a technique able to highlight hyperintensities in FLAIR images. These methods have been applied on paediatric subjects affected by pharmaco-resistant epilepsy.
Introduction
Different techniques have been developed to improve identification of malformations of cortical development such as focal cortical dysplasias (FCD) in patients affected by pharmacoresistant epilepsy (PRE). For the morphological analysis of this specific population, contrary to the adults, the variability of brain size and the white matter’s continuous process of myelination 1 should be taken into account. The purpose of this prospective study is to compare the MAP 2 and the SUPR-FLAIR 3 techniques for the pre-surgical evaluation of the pediatric brain in children with PRE.Methods
A group of 90 healthy subjects (age range 8-16 years) was used as a control group, while 10 patients (4 RMN positive and 6 RMN negative) with drug-resistant epilepsy, and histological proof of FCD, were analyzed to compare the two methods. All subjects were scanned with a 3T Siemens Skyra (Erlagen, Germany) equipped with 20 channels head coil. T1 MPRAGE and standard 2D FLAIR TSE sequences were acquired. The original Map method has been tailored (Opti-MAP) to work with the pediatric population by creating a specific template for pediatric subjects (90 healthy subjects), and by inserting two further preprocessing (BET 4,5 and N4ITK 6 ) into the pipeline. The BET was used to perform the skull stripping of the original image, eliminating in this way the hyperintensity signal from the scalp. Also, since SPM 7 might fail to eliminate intensity inhomogeneity, before the mean and SD calculation, a small iterative cycle using again the N4ITK tool was introduced to correct for such artefacts. The images ran through the tool three times and in particular on the white matter, on the gray matter and on the total brain. That helped our algorithm to improve the thresholding of the normalized image by obtain a more accurate intensity value of the GM-WM transition zone. For the segmentation and subsequently normalization, the Tissue probability maps (TPM) provided by SPM were replaced with customized TPM created by the Template-O-Matic toolbox 8 to account for the differences in the children brain images. . For the SUPR-FLAIR Analysis, the original algorithm was implemented as follow: an intrasubjects coregistration between the T1 and T2 images, followed by an intersubjects registration to a common space. The median of the white matter voxels was calculated on the T1 images, and then the FLAIR intensity values were normalized by the computed median, obtaining intensity-normalized images. For each patient, the surface reconstruction was obtained by Freesurfer 9, thus allowing the projection of the normalized FLAIR values onto the surface. Statistical analysis was performed with QDEC (Query Design Estimate Contrast) by using a linear general model (GLM) to compare case versus controls. To better compare the two methods the junction images was also projected onto the pial surface similarly to the SUPR-FLAIR.Results
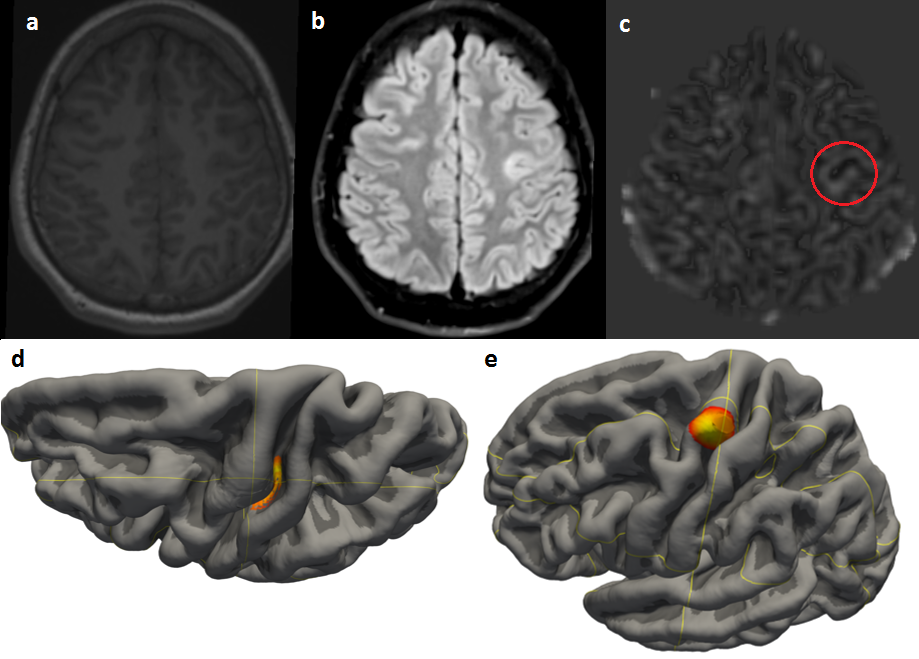
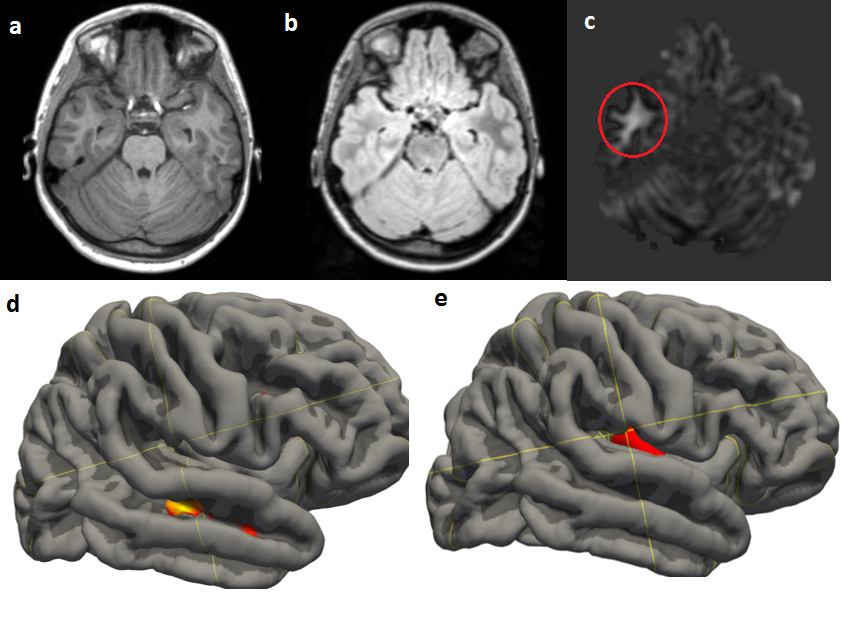
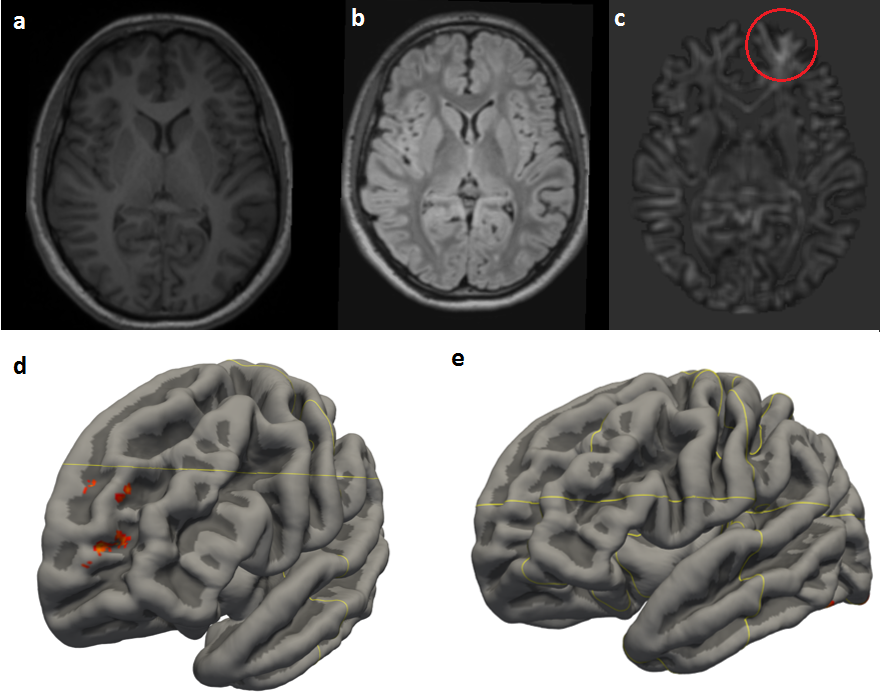
All the subjects analyzed had surgery between the 2011 and 2017 at our center and FCD have been confirmed by histological analysis. Only 5 of them underwent SEEG implantation. Clinical outcome was defined with Engel classification. In Group A, Opti-MAP technique confirmed the lesion in the 75% of cases. The SUPR FLAIR succeeded in only 25% of cases. All patients were diagnosed with FCD type II (a or b). In Group B with no evidence of FCD in the conventional images, the Opti-MAP was successful in the 83,4% of cases (5/6) whereas the SUPR-FLAIR in 16,6% (1/6). All the MR- patients, except one who has been diagnosed with type II b, had FCD type I.Discussion
To the best of our knowledge, this is the first study aiming to compare the performance of FCD detection analysis pipeline in paediatric population. With an 80% successful rate, the Opti-Map shows a better characterization of the FCD. All the patients RMN+ have been diagnosed with type II FCD that, according with the literature, are the easiest types to spot. The most important results is that the Opti-Map has an 80% successful rate among the patient diagnosed with FCD type I. This is relevant because FCD type I are the hardest to diagnose with conventional RM imaging. The SUPR-FLAIR technique is signal-dependent, and it fails where there is not a hyper-intense signal due to the lesion. Instead the Opti-Map, by studying the morphology, is able to detect easily the anatomical differences despite the signal intensity.Conclusion
From these preliminary results, optimized MAP post-processing seems to be a more reliable tool compared to the SUPR-FLAIR technique in the pre-surgical evaluation of pharmacoresistant epilepsy in children. More data are necessary to further optimize the template and validate these results.Acknowledgements
No acknowledgement found.References
1.Jay N Giedd, Armin Raznahan, Aaron Alexander-Bloch, Eric Schmitt, Nitin Gogtay and Judith L Rapoport. Child Psychiatry Branch of the National Institute of Mental Health Longitudinal Structural Magnetic Resonance Imaging Study of Human Brain Development. Neuropsychopharmacology Reviews (2015) 40, 43–49
2. Hans-Jürgen Huppertz, Christina Grimm, Susanne Fauser, Jan Kassubek, Irina Mader, Albrecht Hochmuth, Joachim Spreer, Andreas Schulze-Bonhage. Enhanced visualization of blurred gray–white matter junctions in focal cortical dysplasia by voxel-based 3D MRI analysis. Epilepsy Research 67 (2005) 35–50
3. Luciana Gennari, Alberto Citterio, Maurizio Sberna, Roberto Mai, Ivana Sartori, Lino Nobili, Massimo Cossu, Laura Castana, Giorgio Lo Russo, Nadia Colombo. SUrface-PRojected FLuid-Attenuation-Inversion-Recovery Analysis: A Novel Tool for Advanced Imaging of Epilepsy. World Neurosurgery Volume 98, February 2017, Pages 715-726.e1
4. S.M. Smith. Fast robust automated brain extraction. Human Brain Mapping, 17(3):143-155, November 2002.
5. M. Jenkinson, M. Pechaud, and S. Smith. BET2: MR-based estimation of brain, skull and scalp surfaces. In Eleventh Annual Meeting of the Organization for Human Brain Mapping, 2005.
6. Nicholas J. Tustison, Brian B. Avants, Philip A. Cook, Yuanjie Zheng, Alexander Egan, Paul A. Yushkevich, and James C. Gee. N4ITK: Improved N3 Bias Correction.
7. Statistical Parametric Mapping, Wellcome Trust Centre, UK. http://www.fil.ion.ucl.ac.uk/spm
8. Template-o-Matic toolbox. Structural Brain Mapping Group, University of Jena, DE. www.neuro.uni-jena.de/software/tom/
9. Freesurfer, Athinoula A. Martinos Center for Biomedical Imaging at Massachusetts General Hospital, Boston, Massachusetts, USA. https://surfer.nmr.mgh.harvard.edu/
Figures