1954
Automated Hippocampal Subfield Segmentation using Ultrahigh Field MRI in Patients with Epilepsy1Radiology, Icahn School of Medicine At Mount Sinai, New York, NY, United States, 2Biomedical Engineering, City College of New York, New York, NY, United States, 3Biomedical Engineering, University of Pennsylvania, Philadelphia, PA, United States, 4Icahn School of Medicine At Mount Sinai, New York, NY, United States, 5Neurology, Mount Sinai Medical Center, New York, NY, United States, 6Radiology, Mount Sinai Medical Center, New York, NY, United States, 7Population Health Science and Policy Department, Icahn School of Medicine At Mount Sinai, New York, NY, United States, 8Neuroscience, Icahn School of Medicine At Mount Sinai, New York, NY, United States
Synopsis
Epilepsy is a widely prevalent, disabling condition, whose anatomical source is not clearly identifiable on clinical MRI scans. Identifying hippocampal subfields associated with epilepsy may elucidate mechanisms of epileptigenesis and assist treatment planning. We performed high-resolution 7T-MRI, enabling precise subfield measurements in thirty patients and matched controls. Greater CA1 and DG asymmetries were found in patients compared to controls. In a subset of mesial-temporal lobe epilepsy patients, we found reduced CA2 on the ipsilateral side in patients compared to controls. Identifying hippocampal subfield biomarkers in epilepsy can result in better treatment planning and monitoring in epilepsy.
Introduction
Epilepsy is a widely prevalent, disabling neurological condition, characterized by recurrent seizures. In 20-30% of patients with focal epilepsy, the anatomical source of epilepsy is not clearly identifiable on clinical MRI scans, making treatment decisions difficult1. Identification of hippocampal subfields associated with epilepsy2, 3 may elucidate underlying mechanisms of seizure genesis as well as aid with treatment planning. The higher contrast and resolution afforded by ultrahigh field MRI scanners, such as at 7 Tesla (7T), allows for more precise measurements of the subfields than with conventional clinical strength units. In this study, we evaluate differences in subfield volumes between MDD patients and healthy controls using Automatic Segmentation of Hippocampus Subfields (ASHS) software4.Methods
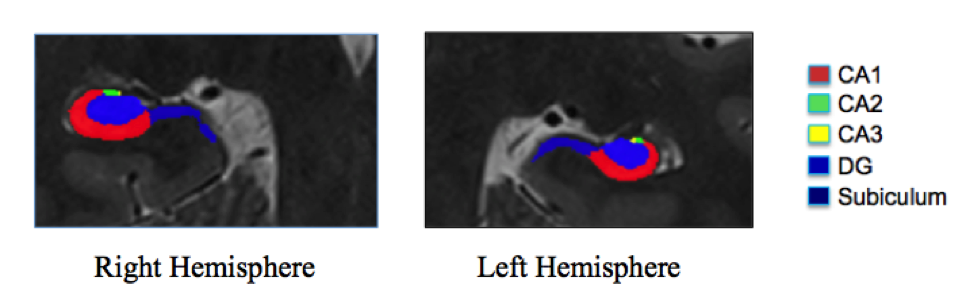
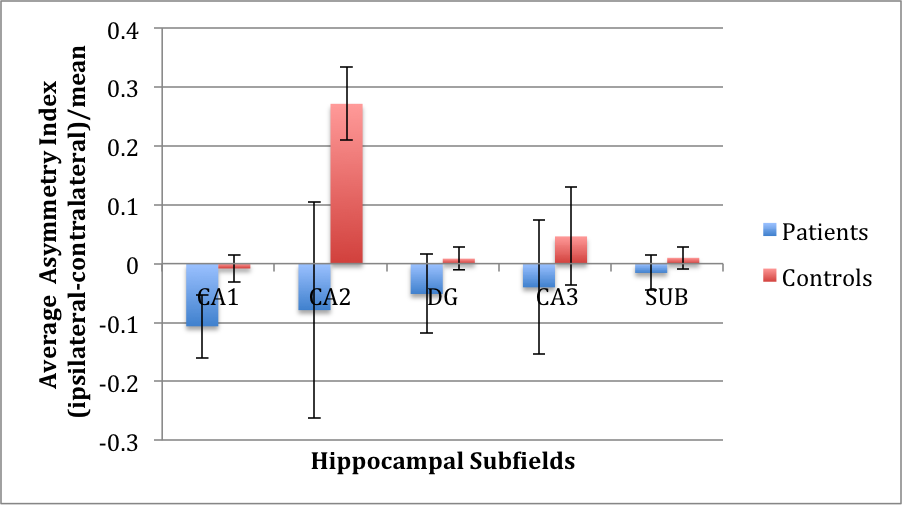
Thirty epilepsy patients (ages 19-56) and thirty gender and age matched (+/-3 years) healthy controls (20-55 years) underwent MRI scanning at 7T (Magnetom, Siemens). Imaging protocol included MP2RAGE (TR=6000 ms, TI1=1050 ms, TI2=3000 ms, TE=5.06 ms, voxel=0.8x0.8x0.8 mm3) and T2 TSE (TR=9000 ms, TE=69 ms, voxel=0.45x0.45x2 mm3) acquired at a coronal oblique orientation, perpendicular to the long axis of the hippocampus. Using ASHS4, we evaluated differences in subfield volume asymmetries between epilepsy patients and healthy controls. Subfield volumes reported include: CA1, CA2, CA3, DG, and subiculum on each side (see Figure 1). Asymmetry for each subfield volume was compared between epilepsy patients and controls, by calculating an asymmetry index (AI = 2x(Right Volume-Left Volume)/(Right Volume+Left Volume)). A subanalysis on a subset of sixteen patients with lateralized, mesial-temporal lobe epilepsy (MTE) against sixteen side-matched controls was performed by calculating an asymmetry index specialized to the side with seizure onset (AI = 2x(Vi – Vc)/(Vi+Vc); Vi = volume ipsilateral to the seizure onset zone in the epilepsy patient; Vc = volume contralateral to the seizure onset zone in the epilepsy patient). We regressed for age and gender and used a signed rank statistical test on the data.Results
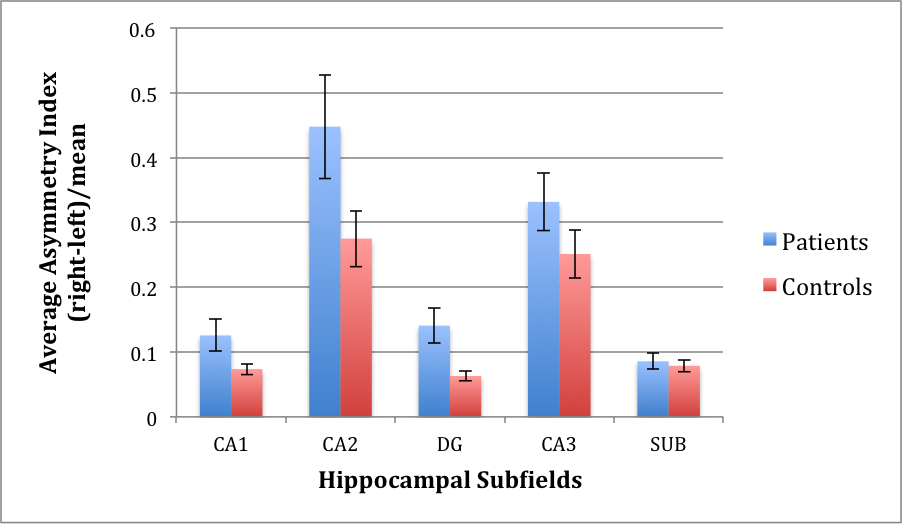
Epilepsy patients exhibited significantly greater right-left asymmetry in CA1 (p=0.0428) and DG (p=0.0074) compared with controls (see Figure 2). Subanalysis on the subset of sixteen MTE patients against sixteen side-matched controls revealed a significant difference in CA2 asymmetry index (p=0.0017), indicating reduced CA2 volume on the ipsilateral side in MTE patients compared with side-matched controls (see Figure 3).Discussion
We have demonstrated feasibility of automated hippocampal subfield segmentation at 7T as applied to epilepsy patients and controls. Significant volume right-left asymmetry was found in CA1 and DG of epilepsy patients, and significant volume asymmetry differences were found in CA2 when comparing the ipsilateral side of MTE patients to their contralateral side against side-matched mesial temporal lobe in healthy controls. These results are concordant with the literature on hippocampal subfield changes associated with neurological disorders such as epilepsy, and may reflect atrophy5 as well as modified signaling in pyramidal cells6. Future work includes accounting for total intracranial volume and comparing to Freesurfer 6.0 automated segmentation results. It is anticipated that identifying subfield biomarkers to better characterize hippocampal involvement in epilepsy will result in better treatment planning and monitoring in epilepsy.Acknowledgements
NIH grant R00 NS070821, NIH R01 MH109544, Icahn School of Medicine Capital Campaign, Translational and Molecular Imaging InstituteReferences
1. Winston, G.P., C. Micallef, B.E. Kendell, P.A. Bartlett, E.J. Williams, J.L. Burdett, et al., The value of repeat neuroimaging for epilepsy at a tertiary referral centre: 16 years of experience. Epilepsy research, 2013. 105(3): p. 349-355.
2. Kim, J.B., S.-i. Suh, and J.H. Kim, Volumetric and shape analysis of hippocampal subfields in unilateral mesial temporal lobe epilepsy with hippocampal atrophy. Epilepsy research, 2015. 117: p. 74-81.
3. Schoene‐Bake, J.C., S.S. Keller, P. Niehusmann, E. Volmering, C. Elger, M. Deppe, et al., In vivo mapping of hippocampal subfields in mesial temporal lobe epilepsy: relation to histopathology. Human brain mapping, 2014. 35(9): p. 4718-4728.
4. Yushkevich, P.A., J.B. Pluta, H. Wang, L. Xie, S.L. Ding, E.C. Gertje, et al., Automated volumetry and regional thickness analysis of hippocampal subfields and medial temporal cortical structures in mild cognitive impairment. Human brain mapping, 2015. 36(1): p. 258-287.
5. Mueller, S.G., K.D. Laxer, J. Barakos, I. Cheong, P. Garcia, and M.W. Weiner, Subfield atrophy pattern in temporal lobe epilepsy with and without mesial sclerosis detected by high‐resolution MRI at 4 Tesla: Preliminary results. Epilepsia, 2009. 50(6): p. 1474-1483.
6. Wittner, L., G. Huberfeld, S. Clémenceau, L. Erőss, E. Dezamis, L. Entz, et al., The epileptic human hippocampal cornu ammonis 2 region generates spontaneous interictal-like activity in vitro. Brain, 2009. 132(11): p. 3032-3046.
Figures