1951
Whole-Brain connectomics reveals network differences in patients with Non-Lesional Frontal Lobe Epilepsy1Institute of Molecular Bioimaging and Physiology (IBFM-CNR), Catanzaro, Italy, 2Institute of Neurology, University Magna Graecia, Catanzaro, Italy
Synopsis
In frontal lobe epilepsy (FLE) seizure onset is usually caused by the presence of lesions or cortical dysplasias of different location and size, challenging the identification of homogeneous samples for neuroimaging studies. However, there are patients in which, even if seizures start in the frontal lobe, no clearly identifiable abnormality can be seen on magnetic resonance imaging (MRI). Thus, it has been hypothesized that non-lesional FLE is indeed a network syndrome, rather the result of focal pathology. In the light of this, probabilistic tractography and graph analysis seem the ideal methodology to investigate the presence and extent of network alterations.
Introduction
Frontal lobe epilepsy (FLE) is a common form of epilepsy1 in which seizure onset is usually caused by a lesion or by a cortical dysplasia. This leads to great variability in the brain characteristics of patients, raising issues in identifying homogeneous samples for neuroimaging studies. However, some patients with FLE can be defined non lesional (nlFLE), i.e., seizures start in the frontal lobe, but there is no clearly identifiable abnormality on magnetic resonance imaging (MRI). For this reason, nlFLE patients represent an ideal sample for the study of the epileptic syndrome itself, regardless of the nature and location of the epileptogenic focus. In this study, we applied graph-analysis analysis to diffusion MRI data of nlFLE patients and healthy controls, in order to analyze network properties, rather than the presence of localized abnormalities, that may be altered due to the epileptic syndrome .Methods
Twenty-two patients with nlFLE (7 female, mean age (standard deviation) 37.0 (15.5)) and 22 age- and sex-matched healthy controls underwent the same 3 Tesla MRI protocol including whole-brain, 3D T1-weighted, spoiled gradient recall echo (TE/TR = 3.7/ 9.2 ms, flip angle 12°, voxel size= 1×1×1 mm3) and diffusion-weighted MRI (b=1000 s/mm2; diffusion-weighting along 27 non-collinear gradient directions; matrix size 128 × 128; 80 axial slices; number of b0 images = 4; NEX = 2; voxel size = 2 × 2 × 2 mm3). The structural connectome2 was computed as follows. The AAL90 atlas was used to identify cortical and subcortical regions to be used as nodes of the network. FSL tools, bedpostX and probtrackX, were used to perform probabilistic tractography in network-mode with the following parameters: 5000 streamlines drawn, from each voxel, through the probability distributions on principal fibres direction, output of bedpostX; 0.2 curvature threshold, which represents the cosine of the minimum allowed angle between two steps; exclusion of pathways that create loops, traveling over voxels where they have already been; samples are terminated after 2000 steps, where each step has a length of 0.5 mm. Afterwards, connectivity matrices were obtained, in which each entry represented the probability of connection between pairs of regions, normalized by the total number of generated fibers for each subject. In order to address the issue of path-length dependency, due to which longer connections tend to be characterized by lower connectivity probabilities, while shorter connections may have higher values, path distributions were corrected for the length of the pathways. To investigate network properties, the following graph-based measures were computed at different network densities [ten values from 0.001 to 0.01]: clustering coefficient, measuring how strongly inter-connected neighboring nodes are; shortest path length and global efficiency, related to the global integration of the network; the nodal efficiencies, related to the importance of a node in the network. All measures were compared through analysis of covariance, with age, sex and intracranial volume as covariates.Correction for multiple comparisons was performed using the False Discovery Rate method.
Results
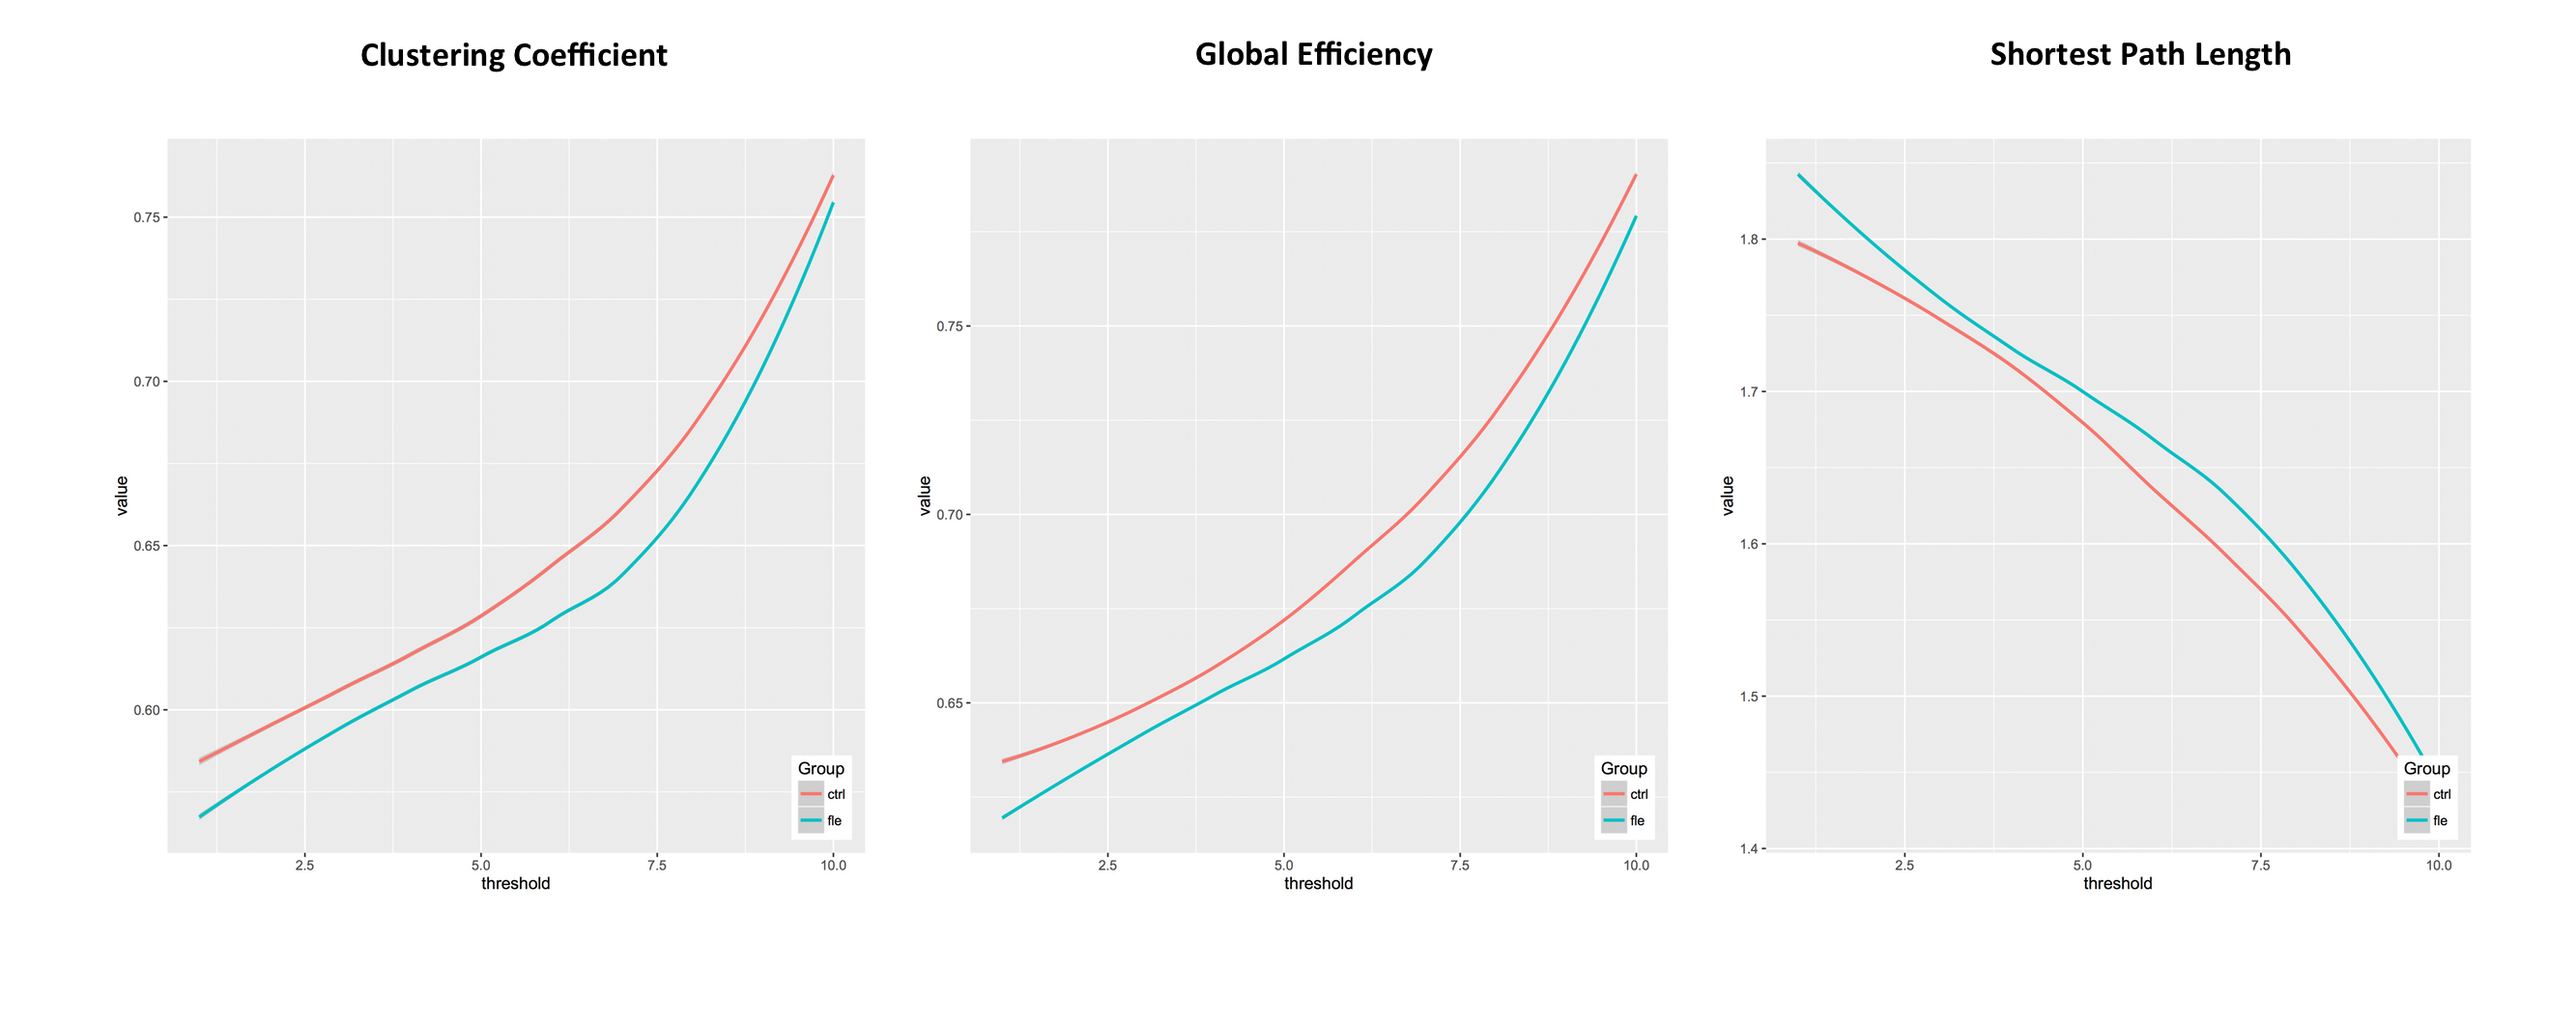
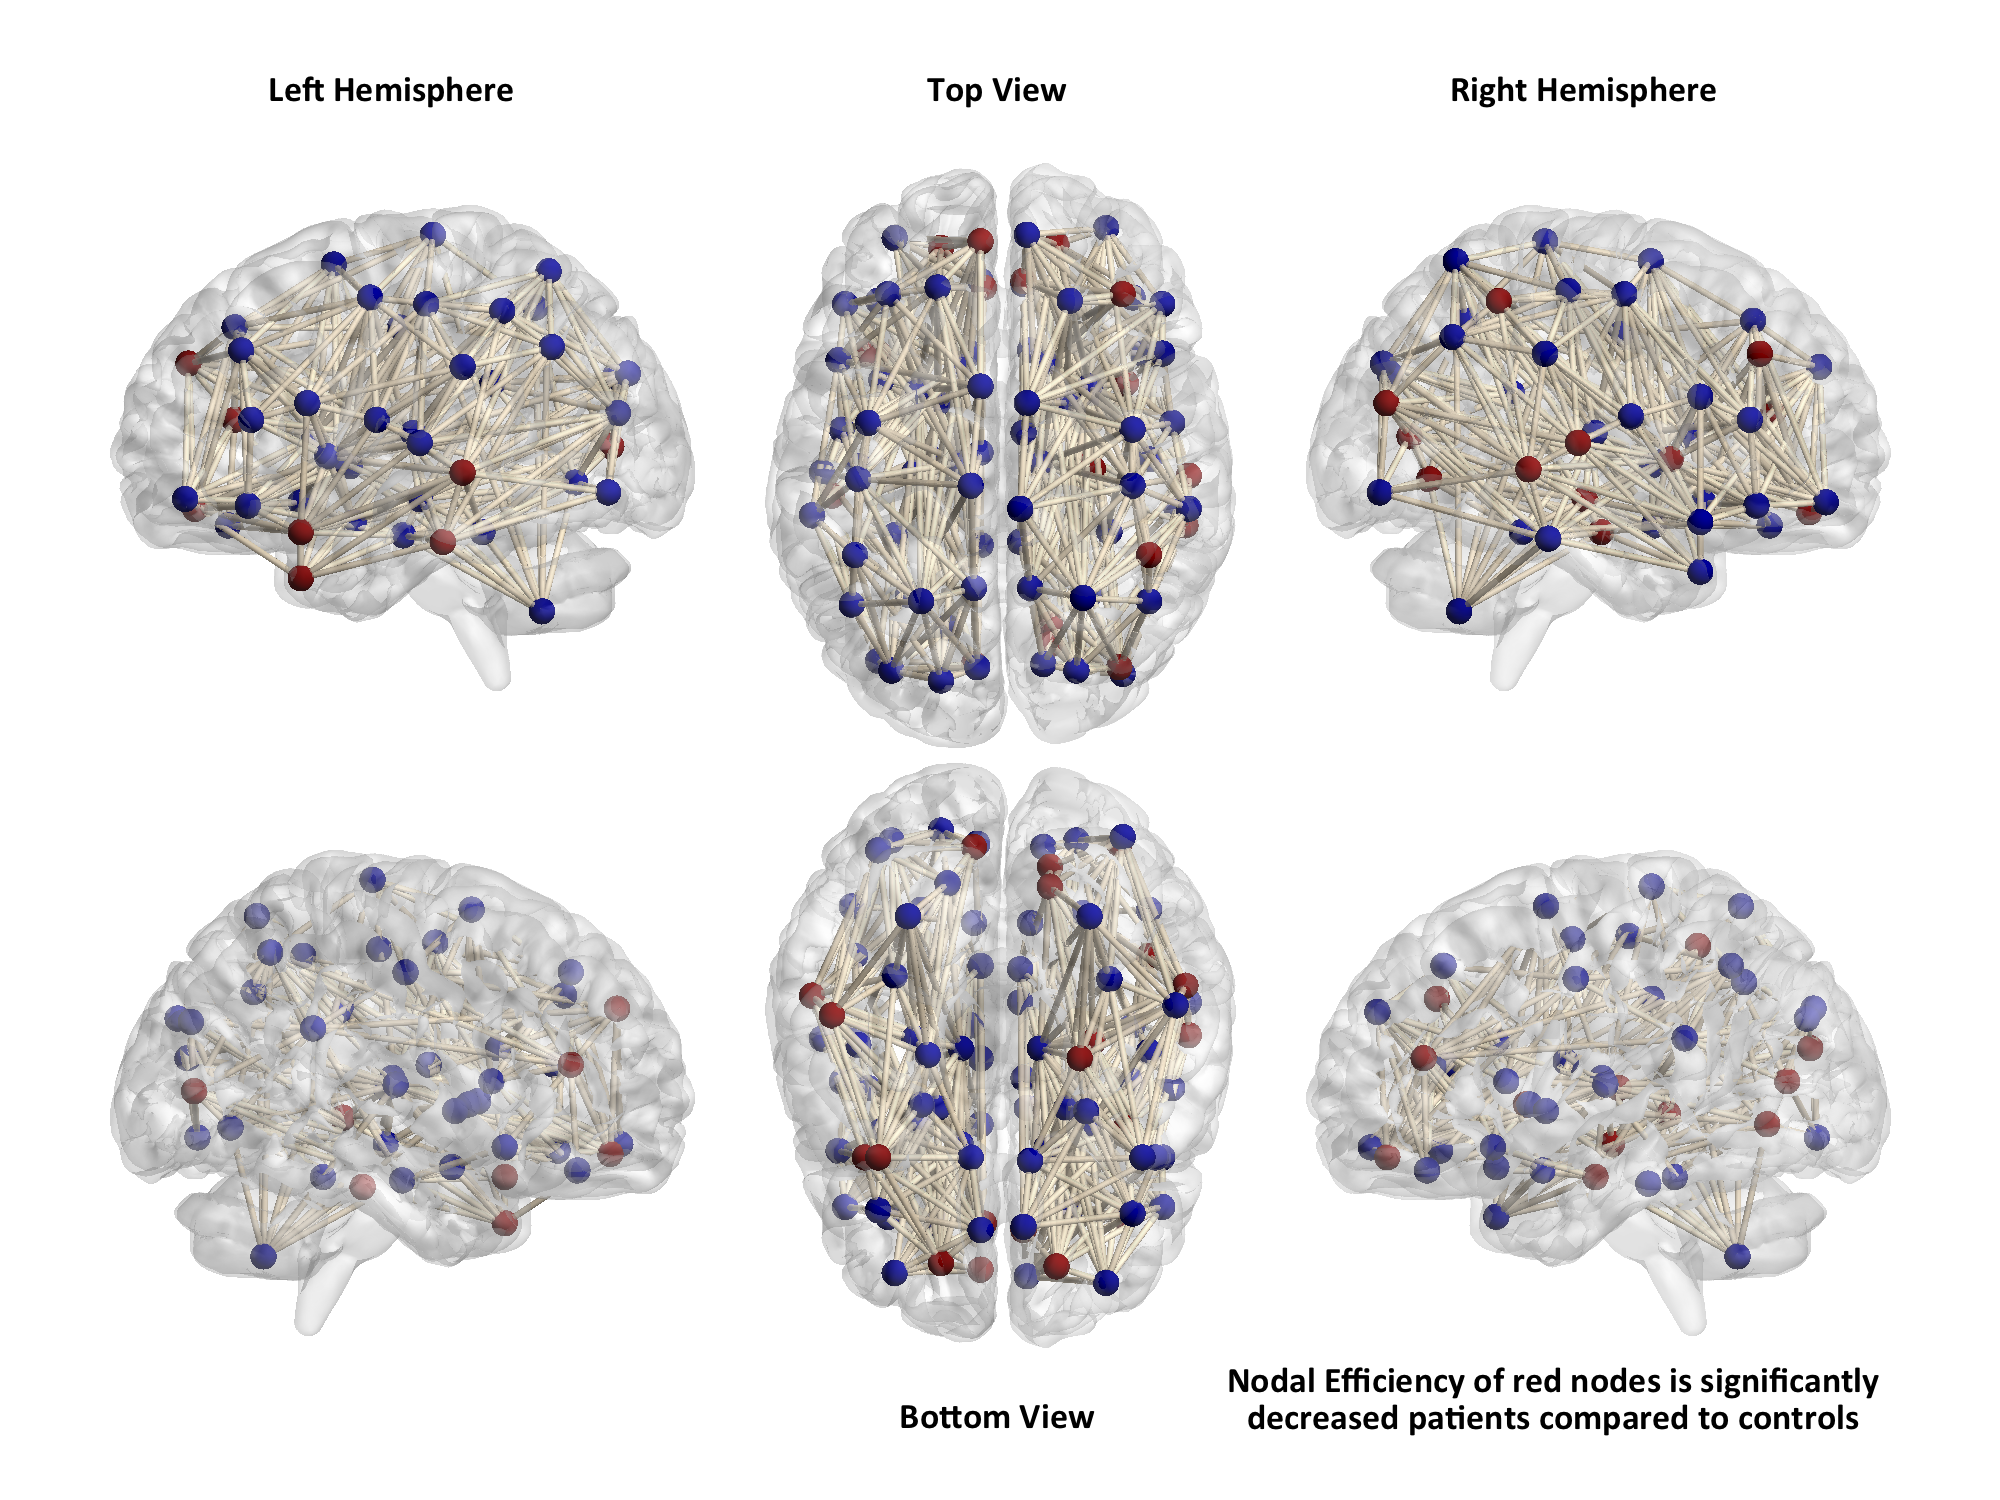
Patients with nlFLE showed abnormalities in network properties at both global and nodal level. In particular, across all network densities, patients showed significantly lower values of global efficiency (p=0.003) and clustering coefficient (p=0.001), whereas the shortest path length was lower in the control group (Figure 1). At the nodal level, we observed that several regions, not limited to the frontal lobe (Figure 2), had decreased nodal efficiency in patients compared to healthy controls (p<0.05 corrected).Discussion
The absence of focal lesions allowed us to explore the characteristics of a uniform sample of patients with frontal lobe epilepsy, thus excluding the variability introduced by epileptogenic lesions of different sizes and locations. Tractography-based graph analysis allowed us to identify abnormalities in a brain network that goes beyond the frontal lobe in these patients, supporting the hypothesis that nlFLE syndrome may arise from complex dysfunctions in whole brain connectivity, and not only from the presence of focal lesions.Conclusions
Network analysis of brain structural connectivity, measured with diffusion MRI and probabilistic tractography, might represent a useful tool in investigating the presence of disease-induced alterations in those syndromes, such as nlFLE, in which no clearly localized damage can be identified
Acknowledgements
No acknowledgement found.References
1) Lawson, J.A., Cook, M.J., Vogrin, S., Litewka, L., Strong, D., Bleasel, A.F., Bye, A.M., Clinical, EEG, and quantitative MRI differences in pediatric frontal and temporal lobe epilepsy. Neurology 2002, 58:723-729.
2) Bonilha L. et al., Presurgical connectome and postsurgical seizure control in temporal lobe epilepsy. Neurology 2013, 81:1704-1710.
Figures