1950
Functional connectivity changes during epileptogenesis: a longitudinal rs-fMRI studyEmma Christiaen1, Marie-Gabrielle Goossens2, Benedicte Descamps1, Paul Boon2, Robrecht Raedt2, and Christian Vanhove1
1MEDISIP, Department of Electronics and Information Systems, Ghent University - IMEC, Ghent, Belgium, 2Laboratory for Clinical and Experimental Neurophysiology, Neurobiology and Neuropsychology (LCEN3), Department of Neurology, Ghent University, Ghent, Belgium
Synopsis
Abnormal functional brain networks could be involved in the development of temporal lobe epilepsy (TLE). In this longitudinal resting-state fMRI study, changes in functional networks during epileptogenesis in the intraperitoneal kainic acid (IPKA) rat model for TLE were mapped. Therefore, resting-state fMRI was acquired at several time points during epileptogenesis to identify functional networks that were analysed and compared with graph theory. Our results suggest that network connections in the functional brain network progressively become weaker during epileptogenesis. We also find a decreased segregation and integration of the network.
Introduction
Temporal lobe epilepsy (TLE) is the most common form of epilepsy in adults. Research has shown that abnormal functional brain networks could be involved in the development of epilepsy and its comorbidities1. Gaining more insight into these networks can be useful for the development of new therapies. Resting-state functional magnetic resonance imaging (rs-fMRI) can visualize changes in functional networks on a whole-brain level2. In this study, we aim to map changes in functional networks during epileptogenesis in the intraperitoneal kainic acid (IPKA) rat model for TLE using longitudinal resting-state fMRI and graph theory.Subjects and Methods
Twenty-four adult male Sprague-Dawley rats (276 ± 15 g body weight) were used in this study. Seventeen animals were intraperitoneally injected with kainic acid (KA) according to the protocol of Hellier et al. (1998)3 resulting in status epilepticus (SE). The other 7 animals were injected with saline and used as a control group. Rs-fMRI images were acquired before the KA injections and at 5 time points during the development of epilepsy: 1, 3, 6, 10 and 16 weeks after SE. At each time point an anatomical TurboRARE T2 image and three resting-state blood-oxygen level dependent (BOLD) fMRI images (TR=2s, TE=20ms, 300 repetitions) were acquired on a 7T system (Bruker PharmaScan). During image acquisition animals were anesthetized with medetomidine. The fMRI images were corrected for slice timing and motion, normalized to a template, smoothed with a Gaussian kernel (FWHM=0.8 mm), and band-pass filtered (0.01-0.1 Hz) using SPM12. The mean time series of 38 predefined regions of interest (ROIs) were extracted from the preprocessed images and the Pearson correlation coefficient between each pair of ROIs was calculated and stored in a correlation matrix using a graph theoretical network analysis toolbox (GRETNA)4. Different thresholds were applied to the correlation matrix to remove the weakest connections, resulting in 21 correlation matrices with a density ranging from 20% to 40%. Each of these matrices was visualized as a graph in which the nodes represent the ROIs and the edges the correlation coefficients between the time series of the ROIs. Several network measures were calculated at each time point, including clustering coefficient and local efficiency (measures of segregation), characteristic path length and global efficiency (measures of integration), and small-world coefficient. The mean value was calculated over the range of densities and plotted as a function of time to visualize how the properties of the functional networks change during the development of epilepsy.Results and Discussion
In Fig. 1 the distribution of the correlation coefficients is shown at different time points during the development of epilepsy in the IPKA rat model and in control animals. The correlation coefficients shift to smaller values during epileptogenesis and their distribution becomes wider. This indicates that network connections progressively become weaker during the development of epilepsy. In Fig. 2A and 2B clustering coefficient and local efficiency are shown. Both decrease during epileptogenesis, indicating a decrease in segregation or local interconnectivity in the functional brain network. Fig. 2C and 2D show that characteristic path length increases and global efficiency decreases during epileptogenesis. This indicates that the integration in the brain network decreases, so there is a decrease in overall communication efficiency.Conclusion
The results of this study show that functional brain network connections progressively become weaker and that segregation and integration of the network are decreased during epileptogenesis. In the next phase of this study, EEG monitoring will be used to characterize the severity of epilepsy in these rats to investigate how changes in functional brain networks during epileptogenesis correlate with epilepsy severity.Acknowledgements
No acknowledgement found.References
- Chiang, S. & Haneef, Z. Graph theory findings in the pathophysiology of temporal lobe epilepsy. Clin. Neurophysiol. 125, 1295–1305 (2014).
- Hutchison, R. M., Mirsattari, S. M., Jones, C. K., Gati, J. S. & Leung, L. S. Functional Networks in the Anesthetized Rat Brain Revealed by Independent Component Analysis of Resting-State fMRI. J. Neurophysiol. 103, (2010).
- Hellier, J. L., Patrylo, P. R., Buckmaster, P. S. & Dudek, F. E. Recurrent spontaneous motor seizures after repeated low-dose systemic treatment with kainate: assessment of a rat model of temporal lobe epilepsy. Epilepsy Res. 31, 73–84 (1998).
- Wang, J. et al. GRETNA: a graph theoretical network analysis toolbox for imaging connectomics. Front. Hum. Neurosci. 9, 386 (2015).
Figures
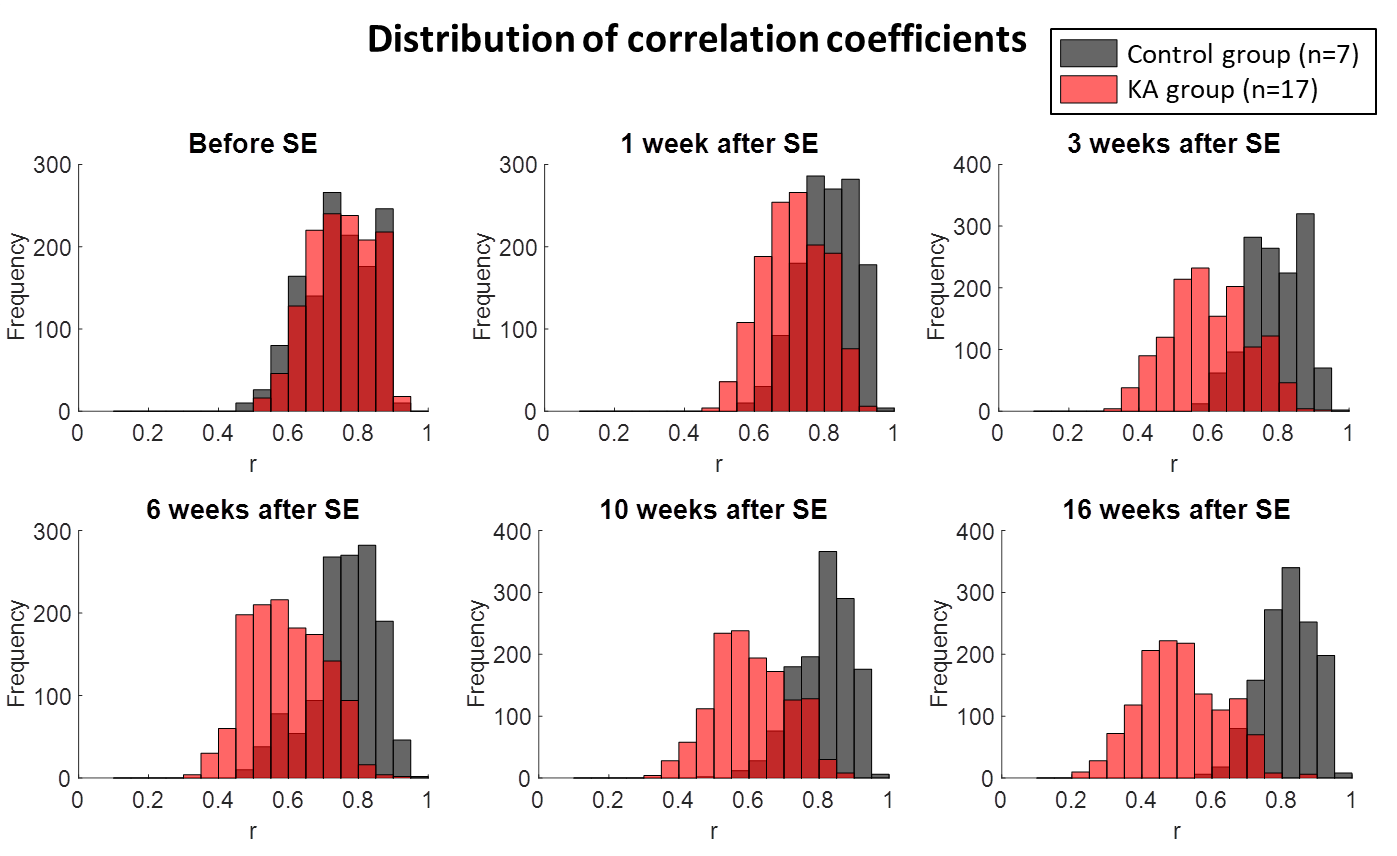
Fig. 1. Distribution of correlation coefficients during epileptogenesis in IPKA
animals and control animals
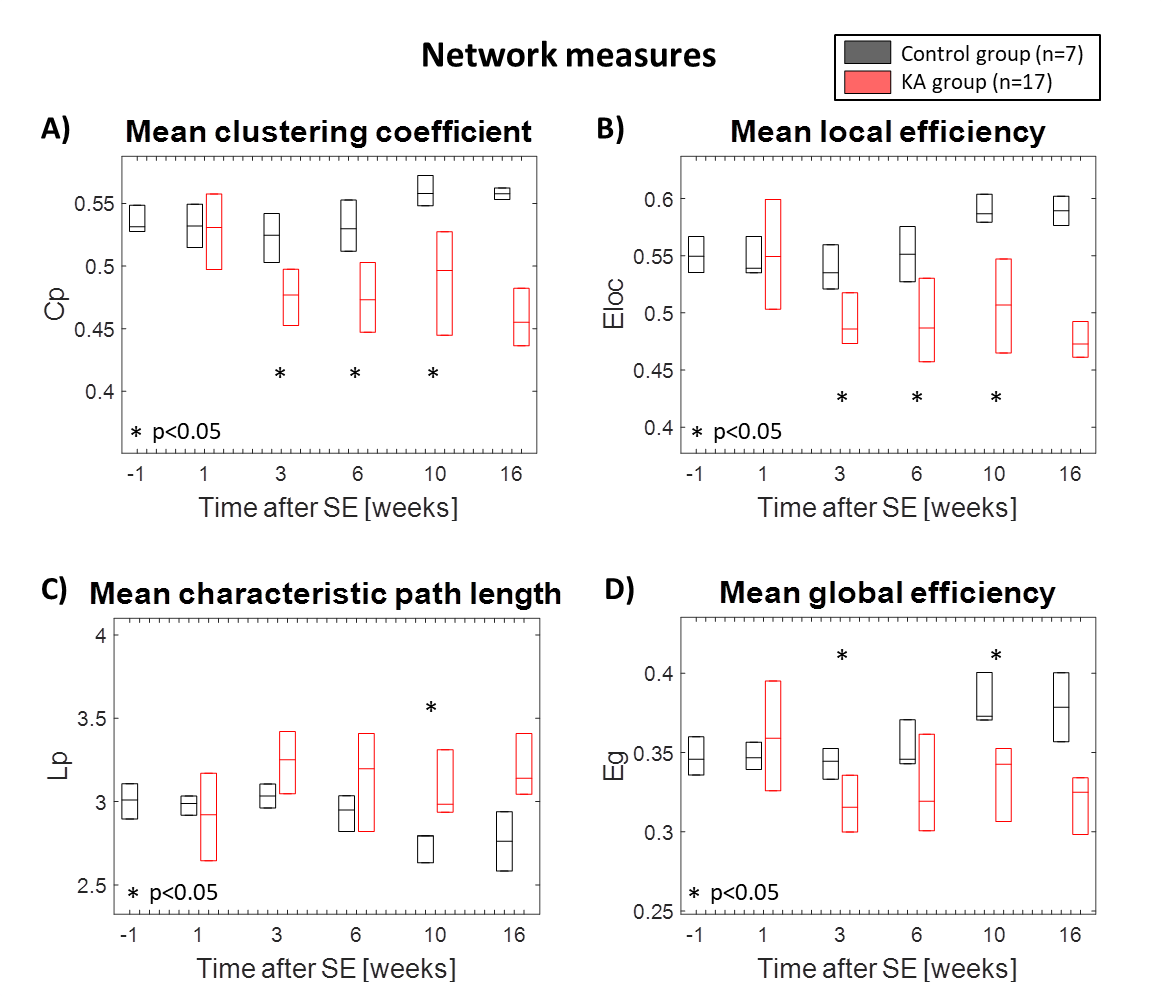
Fig. 2. Changes in network measures during
epileptogenesis: A) Mean clustering coefficient, B) Mean local efficiency, C)
Mean characteristic path length, D) Mean global efficiency