1948
Resting state activity is depressed in regions of MRSI identified dysfunction in epilepsy1University of Cincinati, Cincinati, OH, United States, 2University of Pittsburgh, pittsburgh, PA, United States
Synopsis
This study describes co-registered rsfMRI and MRSI data in poorly localized epilepsy patients with the goal of identifying the aberrant epilepsy network. We used 3T rosette encoded spectroscopic image covering the fronto-parietal-temporal brain regions in conjunction with resting fMRI data. The MRSI defined masks of metabolic dysfunction which was then forward warped using Bo maps to define the equivalent regions in the rsfMRI data. The rsfMRI data was analyzed with a model-free evaluation of local connectivity (regional homogeneity). Regions identified by MRSI as metabolically abnormal exhibited lower local rsfMRI coherence in comparison to gray matter or temporal regions.
Introduction
The epilepsy brain commonly exhibits a network of dysfunctional activity that is thought to underlie seizures. Methods that can identify this network can be clinically informative. Several MRI methods are possibly able to contribute this identification, including resting state functional (rsfMRI) connectivity and spectroscopic imaging (MRSI). In this report we studied n=12 patients in comparison to n=8 controls using rsfMRI and MRSI. We assessed the local connectivity using the regional homogeneity approach in brain regions that were metabolically abnormal as identified by MRSI.Methods
Patients were recruited from the UPMC Comprehensive Epilepsy Center. All studies were performed at 3T on a Siemens Trio and 32channel head coil. The MR spectroscopic imaging and resting state studies were all typically acquired in a single 1hour imaging session. MR spectroscopic imaging was performed using a moderate echo (TE 40ms/TR 2s) fast rosette acquisition, with nominal voxel resolution of 0.4cc (in-plane resolution 20x20x 4mm slice thickness, [1]). Two slabs of MRSI acquisitions were performed to cover a total of contiguous longitudinal 6.5cm of the frontal-parietal and superior temporal regions. To enable evaluation of pixels in the neocortical ribbon, these studies did not use any in-plane spatial localization. The MRSI acquisition required ~20min. The whole brain rsfMRI data were collected with a multi-band factor of 3, 2.5mm isotropic echo planar imaging sequence with TE 35msec, TR 2s, 6.7min duration. To maintain high accuracy to individual anatomy, analysis of the MRSI Cr/NAA data was performed using a regression approach [1]. This approach used tissue segmentation from structural images via Freesurfer to calculate the fraction gray matter of each CSI voxel. After filtering for spectral quality taken at a minimum tissue fraction of 40% (wm, gm), CRLB values of <20%, and linewidth of 15Hz, control regression statistics (slope, intercept and standard error) were used to statistically evaluate each patient voxel using a threshold p-value of 0.01 for inclusion. The identified abnormal regions thus created a mask which was then applied to the resting state data. To provide correction of Bo distortion, the MRSI-determined mask of abnormality was forward-distorted according to echo-planar imaging parameters to identify their positions in the rsfMRI data. The resting state data were analyzed principally in SPM, evaluating the regional homogeneity (ReHo) local coherence measure. The first 4 time points were discarded for steady state and subject acclimation resulting in 196 timepoints. Preprocessing included motion correction, within-subject registration between the structural, fMRI imaging data and time series linear detrending. Individual masks were created from the three-dimensional T1 imaging data by setting the value of voxels outside of the brain to zero. In order to maintain individual anatomical detail, native brain space was maintained throughout without smoothing. To provide a model-free evaluation of tissue activity, the regional homogeneity approach was taken in analysis, calculating the Kendall’s coefficient for concordance over a 27 voxel neighborhood as discussed by [2]. For each subject, the ReHo values were thus determined from the MRSI-identified regions. For control subjects, instead of an abnormal MRSI mask, temporal and total gray matter ROI masks were applied.Results
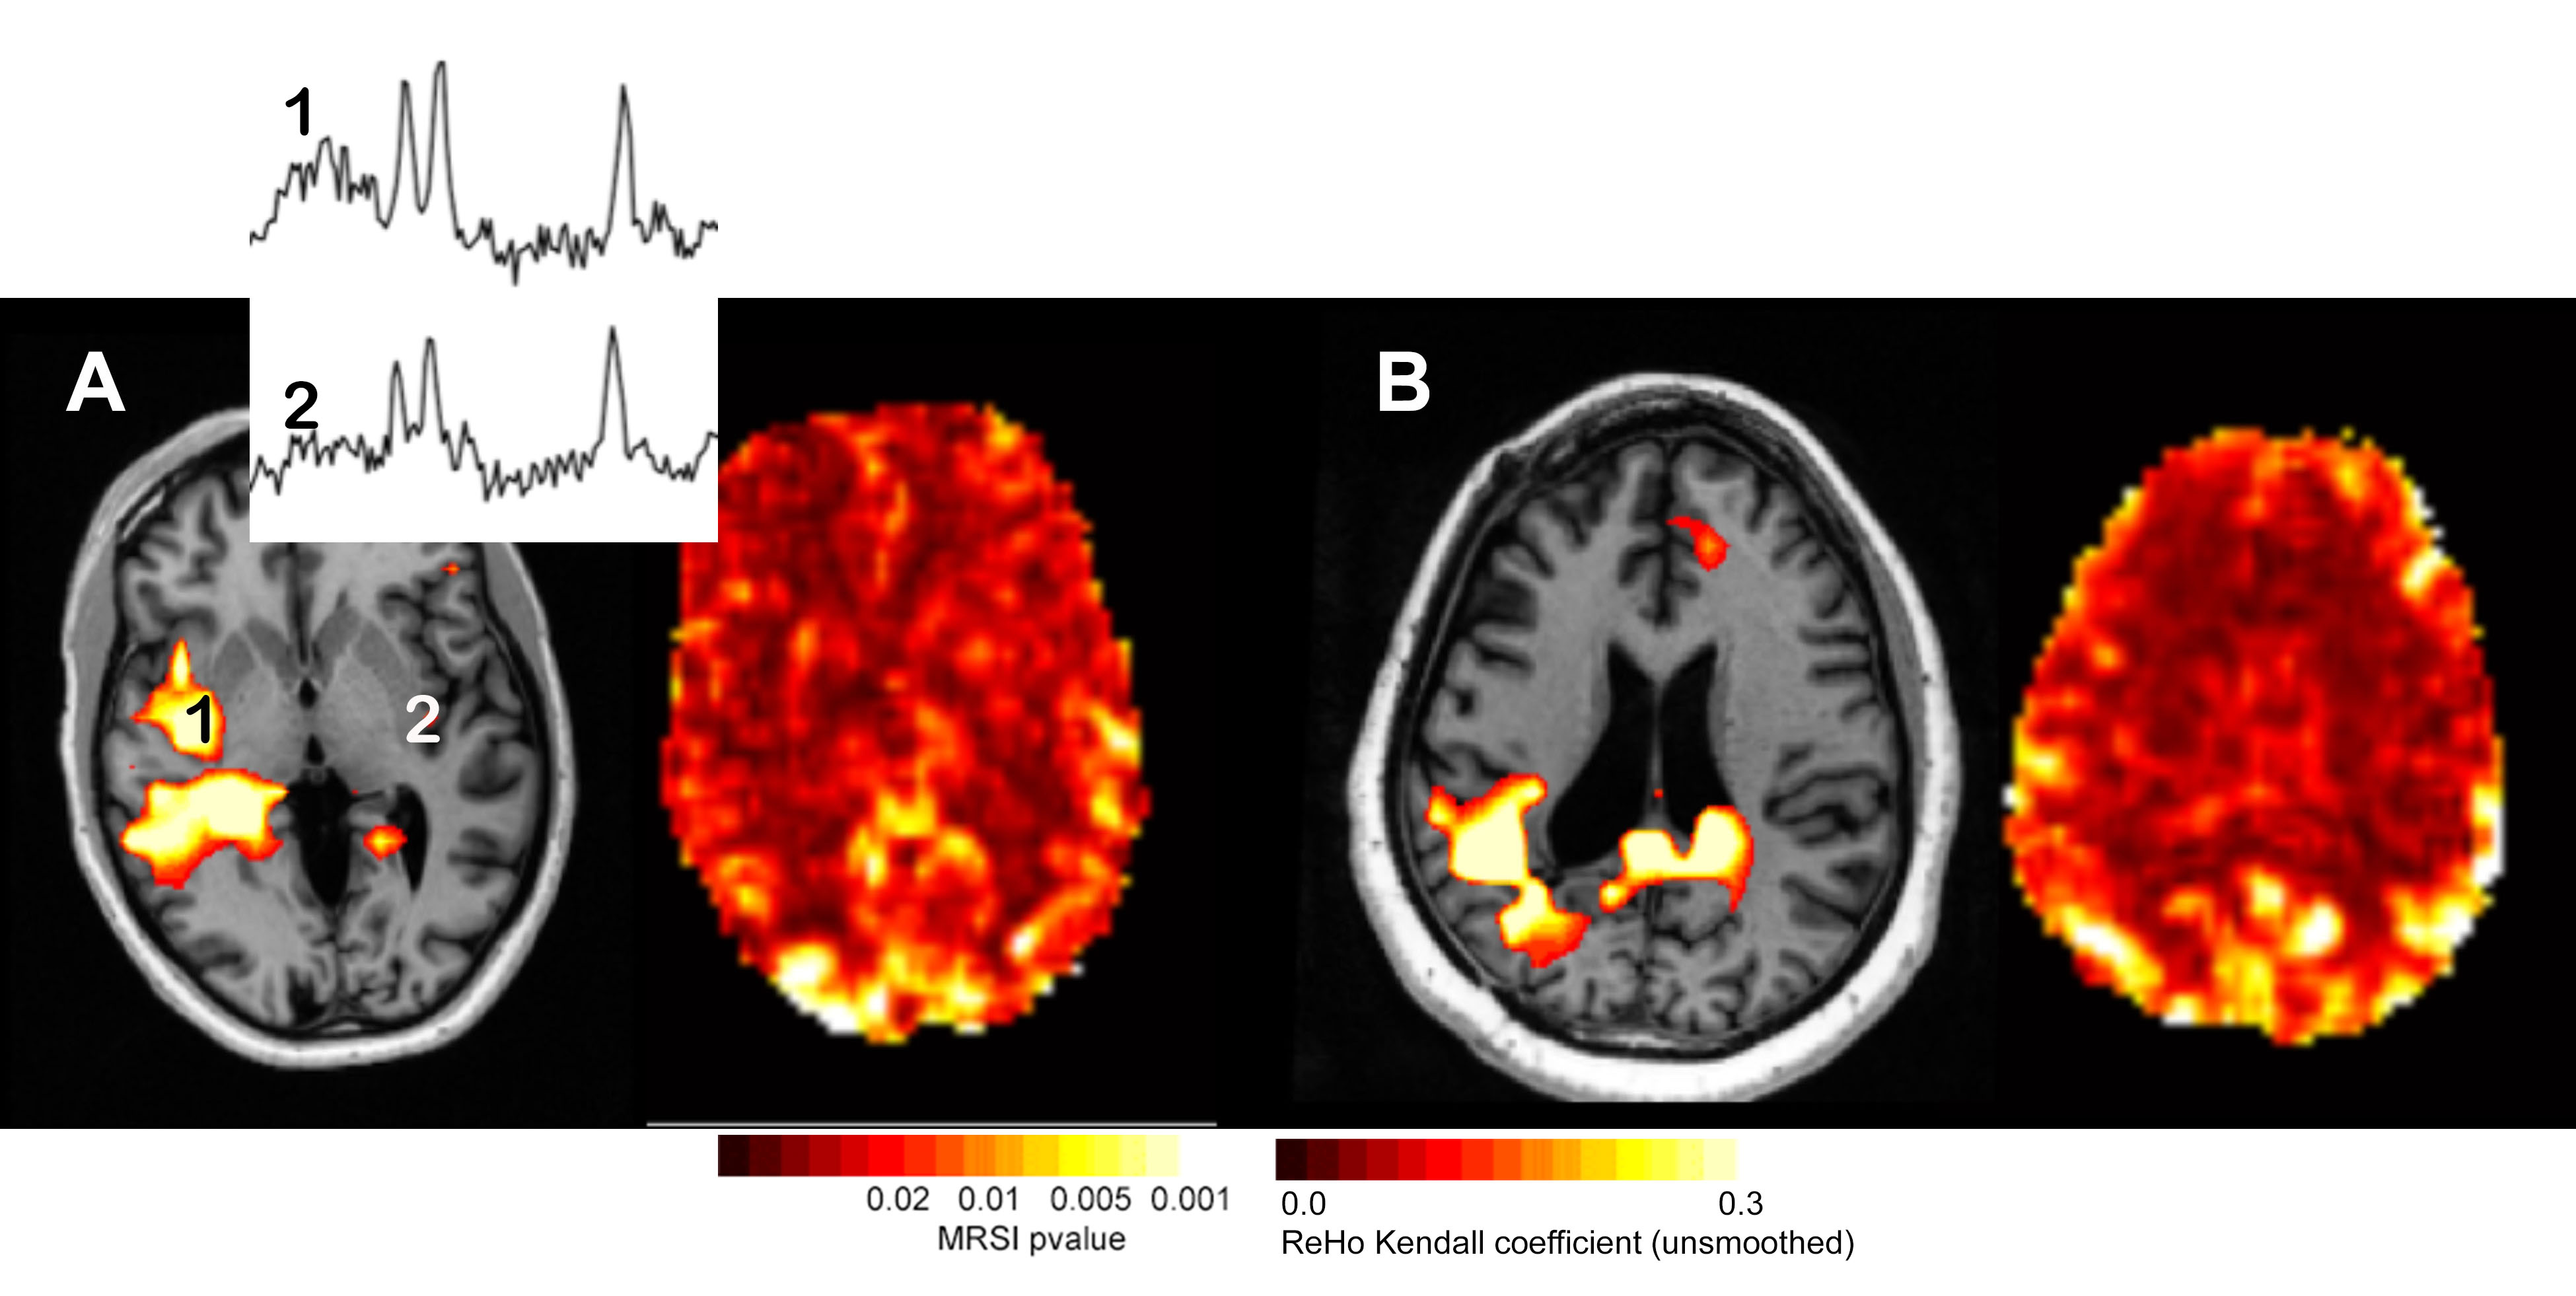
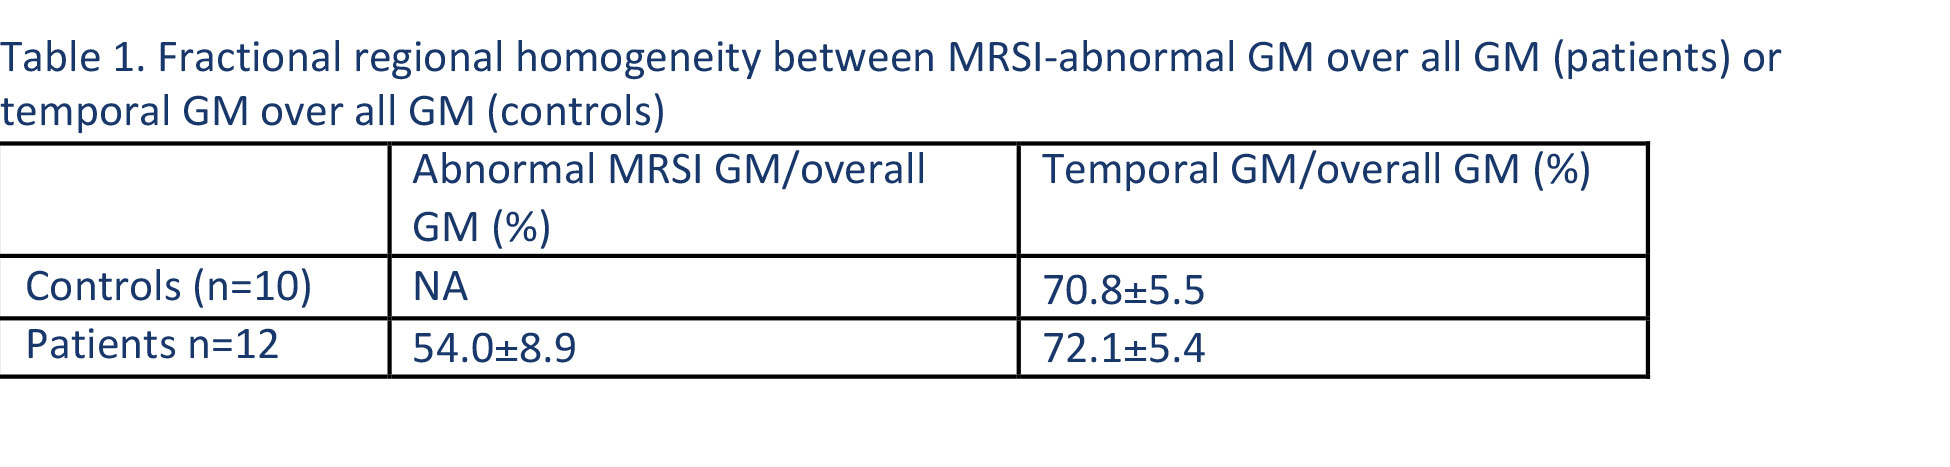
Using the t-maps defined from the regression analysis, Fig. 1 shows a typical MRSI study with the significance level indicated with the colorbar. Two spectra are shown from the indicated loci. The resting state regional homogeneity (ReHo) map is also shown from the same slice. In comparison to the contralateral region, the reduction in amplitude in the ReHo map is visually recognized. Clinically, the non-invasive studies from patient A had EEG-identified seizure onset from the right mid-anterior temporal region but was MRI negative, SISCOM negative, PET negative and MEG left temporal-parietal dipoles. Figure 2 shows similar abnormal Cr/NAA data from another patient who sustained an earlier right parietal hemorrhage and overlaps with the decreased regional homogeneity. Over n=12 patients, the MRSI defined voxels exhibited a much smaller amount of local connectivity, at 54.0±8.9% of the signal of overall gray matter. In temporal gray matter alone, the patients did not exhibit a different local regional homogeneity in comparison to control (72.1%± 5.4 patients; controls 70.8%±5.5).Conclusions
In epilepsy, the challenge of identifying the region(s) of seizure involvement remains high. Methods that can identify network components of seizure involvement can be helpful. These data show that co-registered MRSI and rsfMRI data are in agreement, finding that regions identified by MRSI as metabolically abnormal exhibit lower local rsfMRI coherence in comparison to overall gray matter or temporal regions. This is consistent with the view that metabolically dysfunctional areas are also less locally coherent, most likely reflecting abnormal local neurotransmission.Acknowledgements
This work is supported by NIH R01 EB011639, NS090417, NS081772 and EB009871References
1. Schirda, Zhao, Yushmanov et al. Magn Res. Med 2017: doi 10.1002/mrm26901.
2. Zang, Jiang, Lu et al. Neuroimage 2004. 22(1):394-400.
Figures