1946
Iron Quantification in Brain Gray Matter Nuclei of Patients with Parkinson's Disease: A Study Based on MR Quantitative Susceptibility Mapping1Affiliated Hospital Of BeiHua University, Jilin, China, 2Philips Healthcare, Beijing, China
Synopsis
Parkinson's disease (PD) is the most common extrapyramidal disease in the elderly people, and the overall prevalence rate is increasing year by year. Quantitative susceptibility mapping (QSM) is based on the basis of susceptibility weighted imaging (SWI), and has more advantages in quantitative detection of brain iron content and display of microstructure. In this study, we tried to use QSM to analyze brain iron variations and microstructural changes in brain gray matter nuclei of patients with PD.
Introduction
Parkinson's disease (PD) is the most common extrapyramidal disease in the elderly people, and the overall prevalence rate is increasing year by year. Quantitative susceptibility mapping (QSM) is an MR technique to describe and quantify magnetic susceptibility sources[1,2].It provides an effective way to quantify and analyze tissue iron deposits,calcification and vessel oxygen saturation[3.4].Based on QSM,we aimed to evaluate iron vartations and the microstructural changes of brain gray nuclei in Parkinson's disease[5].
Methods
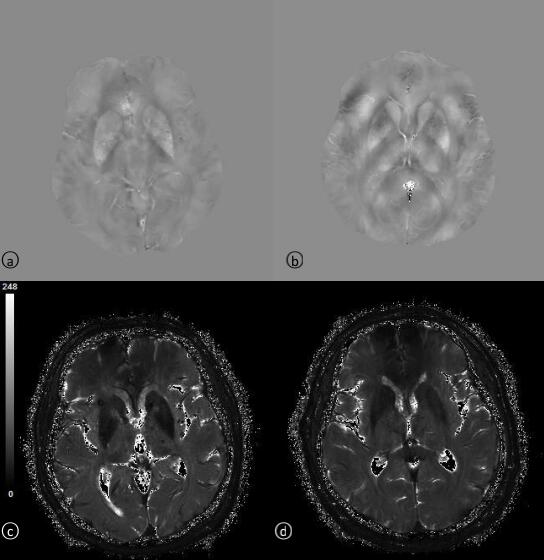
Totally 10 PD patients (5 females and 5 males; aged 68.8±6.24 years old) and 10 healthy controls (HC) (8 females and 2 males; aged 71.2±8.91 years old) were included in this study. All the subjects were informed of the purpose of this study. And the study was approved by the Ethics Committee of Beihua University Hospital, Jinlin, China. The QSM images were acquired based on a 3T MR scanner (Ingenia; Philips, Best, the Netherlands) with the following parameters: TR=57ms, multi-echo acquisition with TE of 8,16,25,33 and 41ms,matrix size=332×224,FOV=220×220mm2, 18 slices, slice thickness=4mm with no gap. The images were processed by using the MEDI Toolbox to calculate magnetic susceptibility mapping. Besides, the T2* values were also obtained with the multi-echo images. Then region of interests (ROI) were placed on the bilateral predetermined structures including bilateral substantia nigra, red nucleus, head of caudate nucleus and putamen by using SPIN LITE software. Nonparametric Rank-Sum test was applied on the T2* and susceptibility values between PD and HC groups.Results
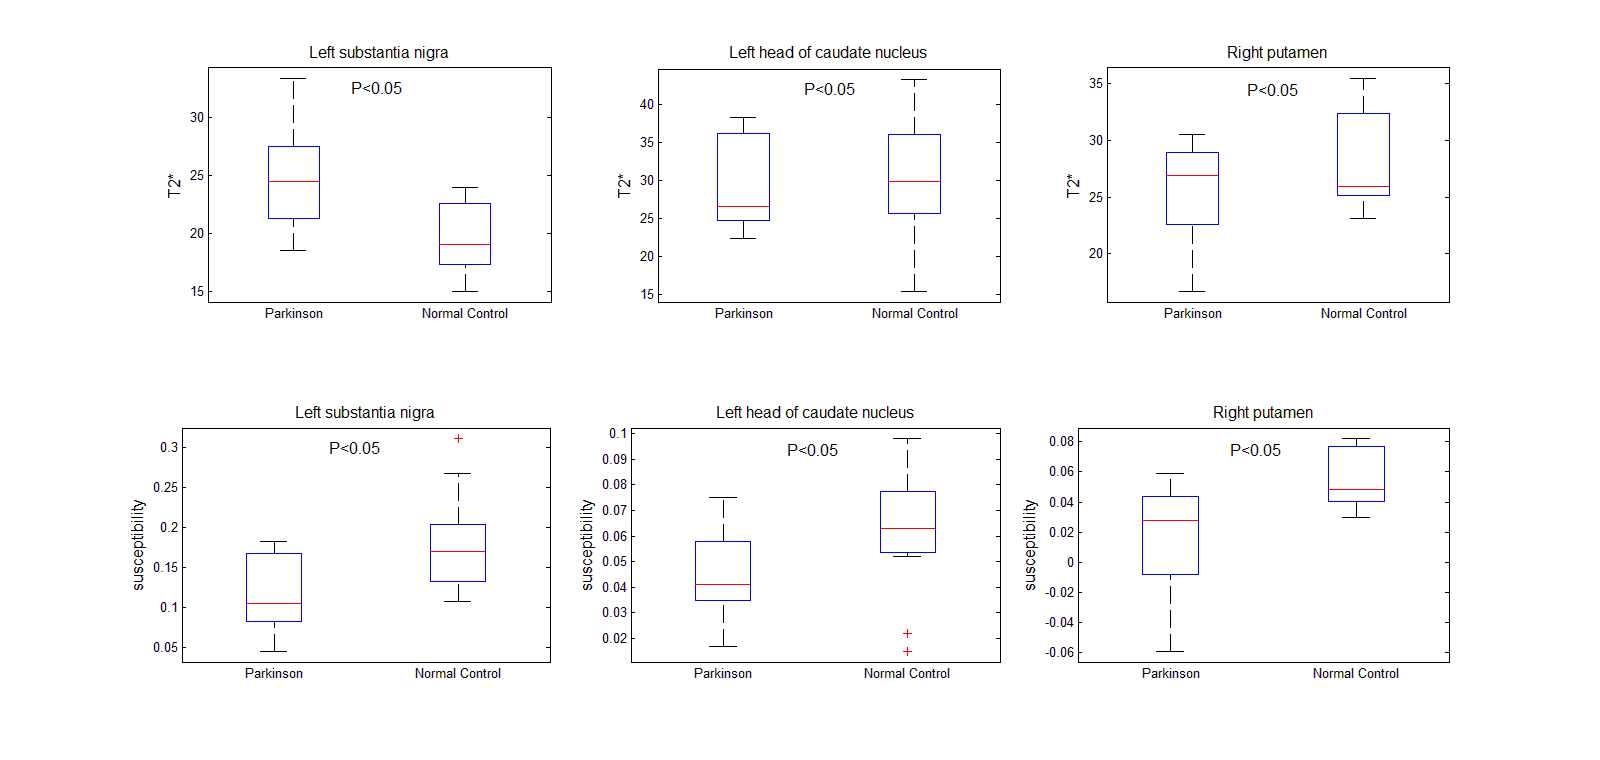
As shown in Figure 2, compared with the HC group, T2* value was increased in the left substantia nigra (P<0.05). However, the magnetic susceptibility value was decreased in the PD group (P<0.05). T2* and magnetic susceptibility values in the left head of caudate nucleus were both decreased (P<0.05). The T2* value of the right putamen in the PD group was increased, while the magnetic susceptibility value was decreased (P<0.05).Discussion
In the present study, the results showed that there were all decreased in magnetic susceptibility values of the left substantia nigra, the left head of caudate nucleus and the right putamen in PD groups, which was different from the conclusions in other literatures. The possible reason is that healthy controls are older and existing the physiological iron deposit. On the other hand, maybe the selected patients in Parkinson's disease is early stage, the symptom is lighter and the iron abnormal deposition was not obvious. The T2* value of the left substantia nigra and the right putamen in PD patients was increased compared to HC, while the T2* value of the left head of caudate nucleus was decreased. It might be due to the difference of iron variations and microstructure changes in brain gray matter nuclei. Further study will include more subjects and investigate the effect of abnormal iron deposition on the magnetic susceptibility changes of the gray matter nuclei in PD patients with different stages.Conclusion
Parkinson's disease is associated with abnormal iron variations, which could be detected by T2* and magnetic susceptibility values in brain gray matter nuclei of patients with PD.Acknowledgements
No acknowledgement found.References
[1]Schweser F,Deistung A,Lehr BW,et al.Quantitative imaging of intrinsic magnetic tissue properties using MRI signal phase:an approach to in vivo brain iron metabolism.Neuroimage.2011,54(4):2789-2807.
[2]Liu T,Khalidov I,De Rochefort L,et al.A novel background field removal method for MRI using projection onto dipole fields(PDF). Nmr in Biomedicine.2011,24(9):1129-1136.
[3]Haacke EM,Tang J,Neelavalli J,et al.Susceptibility mapping as a means to visualize veins and quantify oxygen saturation.Journal of Magnetic Resonance Imaging.2010,32(3):663-676.
[4]Chen WW,Zhu WZ,Kovanlikaya I,et al.Intracranial calcifications and hemorrhages:Characterization with quantitative susceptibility mapping. Radiology.2014,270(2):496-505.
[5]Bilgic B,Pfefferbaum A,Rohlfing T,et al.MRI estimates of brain iron concentration in normal aging using quantitative susceptibility mapping. Neuroimage.2012,59(3):2625-2635.
Figures