1942
Iron Deposition Quantification in Patients with Parkinson’s Disease by Quantitative Susceptibility Mapping1Biomedical Engineering, Tsinghua University, Beijing, China, 2School of Computer Science and Technology, Beijing Insitute of Technology, Beijing, China, 3Tsinghua University Yuquan Hospital, Beijing, China
Synopsis
Parkinson’s disease (PD) is one of the most common neurodegenerative disorders worldwide. This study explores the relationships between iron accumulation in different nucleus, including red nucleus (RN), caudate nucleus (CN), global pallidus (GP), putamen (PUT), and the severity of PD, which is characterized by the Unified Parkinson’s Disease Rating Scale (UPDRS)-III. Significant bilateral difference was found in RN only. Significant correlations were found in bilateral GPe, PUT, RN, and contralateral GPi, which can serves as an evidence that iron deposition can be an important biomarker for the severity of PD.
Purpose
As a neurodegenerative disorder, Parkinson’s disease (PD) is commonly characterized by the asymmetric onset of motor symptoms, such as tremor, rigidity, gait disorder and postural instability. The pathologic features of PD can be divided into three levels: neurological level [1], macromolecular level, and micromolecular level (such as the iron deposition in PD-related brain regions) [2]. As an MRI based post-processing method, the quantitative susceptibility mapping (QSM) [3] method can estimate iron concentration [4], which makes it practical for iron distribution quantification. Several studies have been tried to figure out the relationships between the iron deposition in certain brain regions, such as substantia nigra (SN), red nucleus (RN), caudate nucleus (CN), global pallidus (GP), putamen (PUT) and Parkinson’s disease [5-8]. Most of these studies tried to find the difference of iron concentration between PD patients and healthy controls. Consistent results of iron deposition in SN have been reported, but consensus still has not been established for other regions [6]. Also, the intra-patient difference between iron deposition in specific regions and the severity of PD have not been consistently reported. This study focuses on the differences of iron deposition in CN, GPe, GPi, RN, PUT among patients with different stage of PD assessed by the Unified Parkinson’s Disease Rating Scale (UPDRS)-III [9].Methods
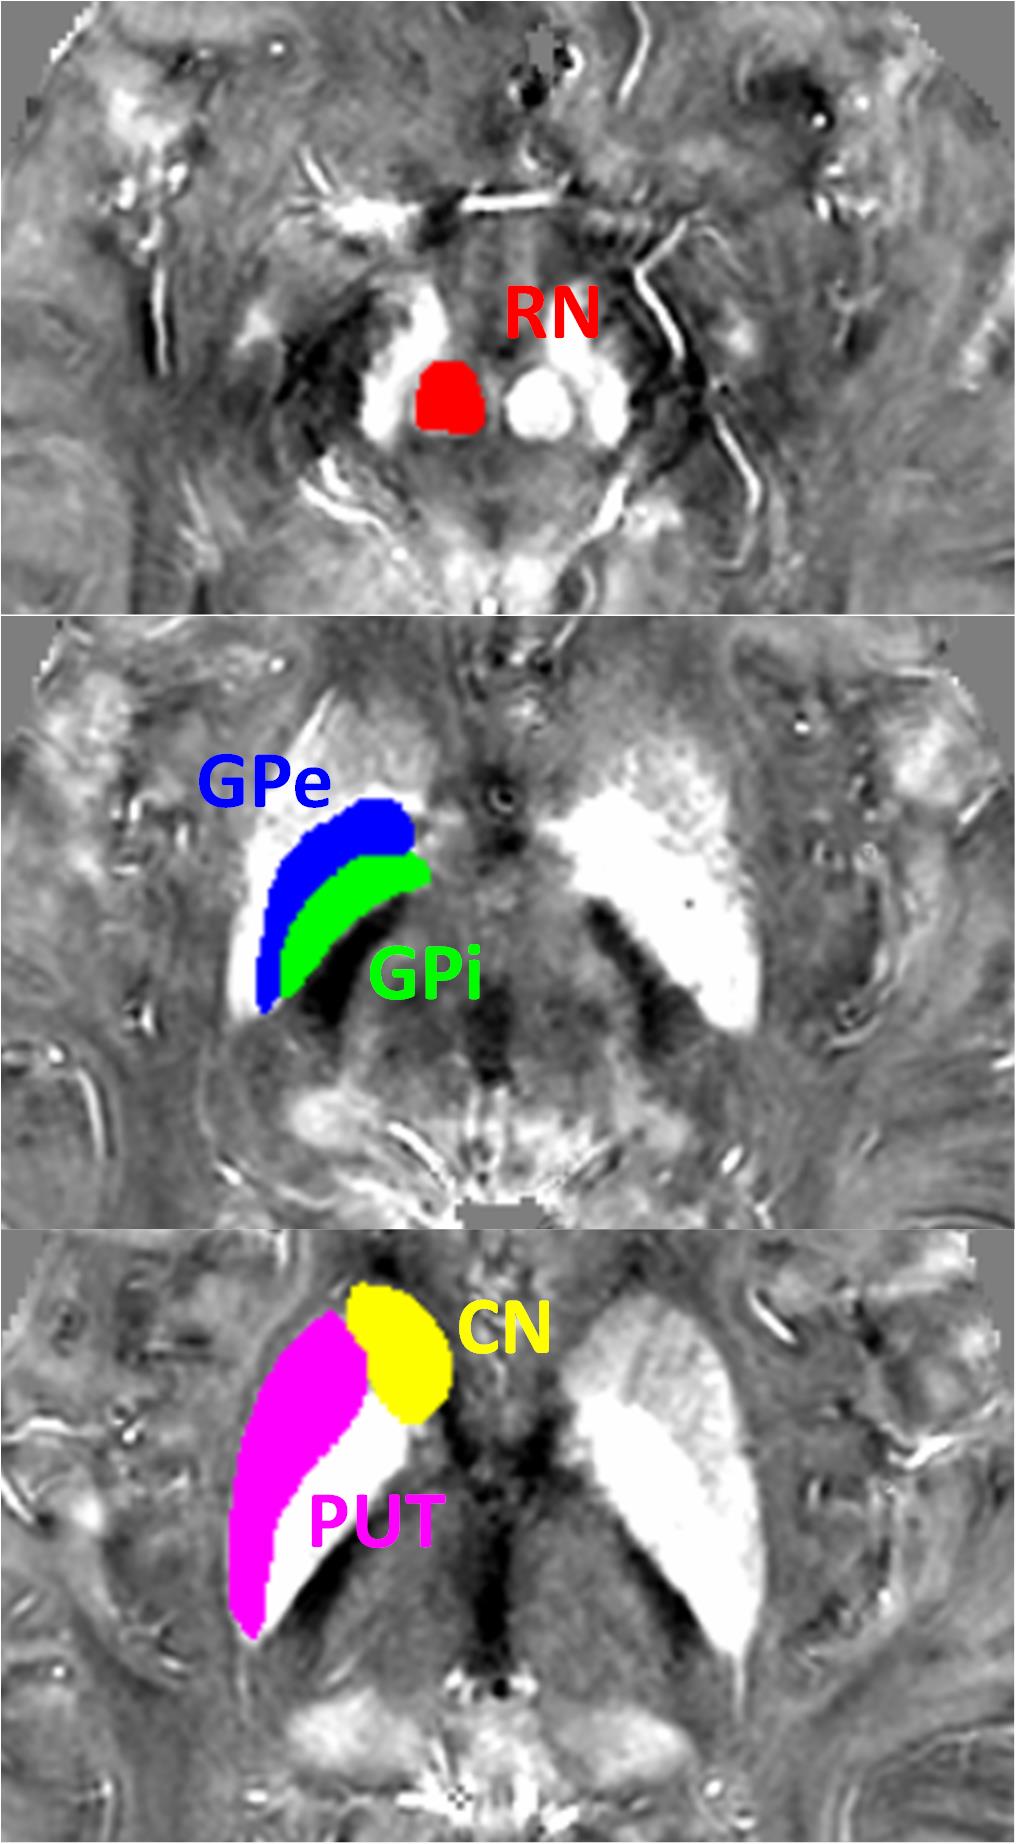
Participants: Twenty-six right-handed patients with PD (age, 57.7 $$$\pm$$$ 10 years; male/female, 14/12) were recruited from Beijing Yuqun Hospital and provided with informed consent. PD diagnosis was conducted by an experienced specialist and assessed using UPDRS-III. Demographic information, such as gender, age, and so on, was collected for each patient. The sides of PD motor symptoms were also recorded, and fourteen patients showed impairment mainly on the right side, and the left twelve primarily on the left side. Data Acquisition: MRI data were acquired on a Philips 3T scanner (Philips Healthcare, Best, The Netherlands) using a 32-channel head coil. A 3D multi-echo (FFE) sequence was used. The imaging parameters were as follows: FOV: 230 $$$\times$$$ 188 $$$\times$$$ 130 mm3, resolution: 0.75 $$$\times$$$ 0.75 $$$\times$$$ 0.75 mm3, TR = 30 ms, number of echoes = 5, TE1 = 5 ms, echo spacing = 5.5 ms, slice number = 173, sense factor 2 in the RL direction and 1.5 in the FH direction, flip angle = 12°. Image processing: The magnitude and phase of the acquired multi-echo images were processed in STI Suite [10] using an improved least-squares (iLSQR) method to obtain the quantitative susceptibility maps. All calculation was performed in Matlab (The Math-Works, Inc., Natick, MA, USA). Bilateral CNs, GPes, GPis, RNs, PUTs shown in Fig. 1 were drawn manually on the susceptibility maps individually by three experienced radiologists using MRIcron software. Statistical analysis: After the mean QSM values in volumes of interest (VOIs) were obtained, t-tests were performed to find the difference between the ipsilateral and contralateral nucleus. The difference between GPe and GPi was also tested. Correlation tests were performed to evaluate the relationship between the iron concentrations and the UPDRS-III scores of PD patients.Results and Discussion
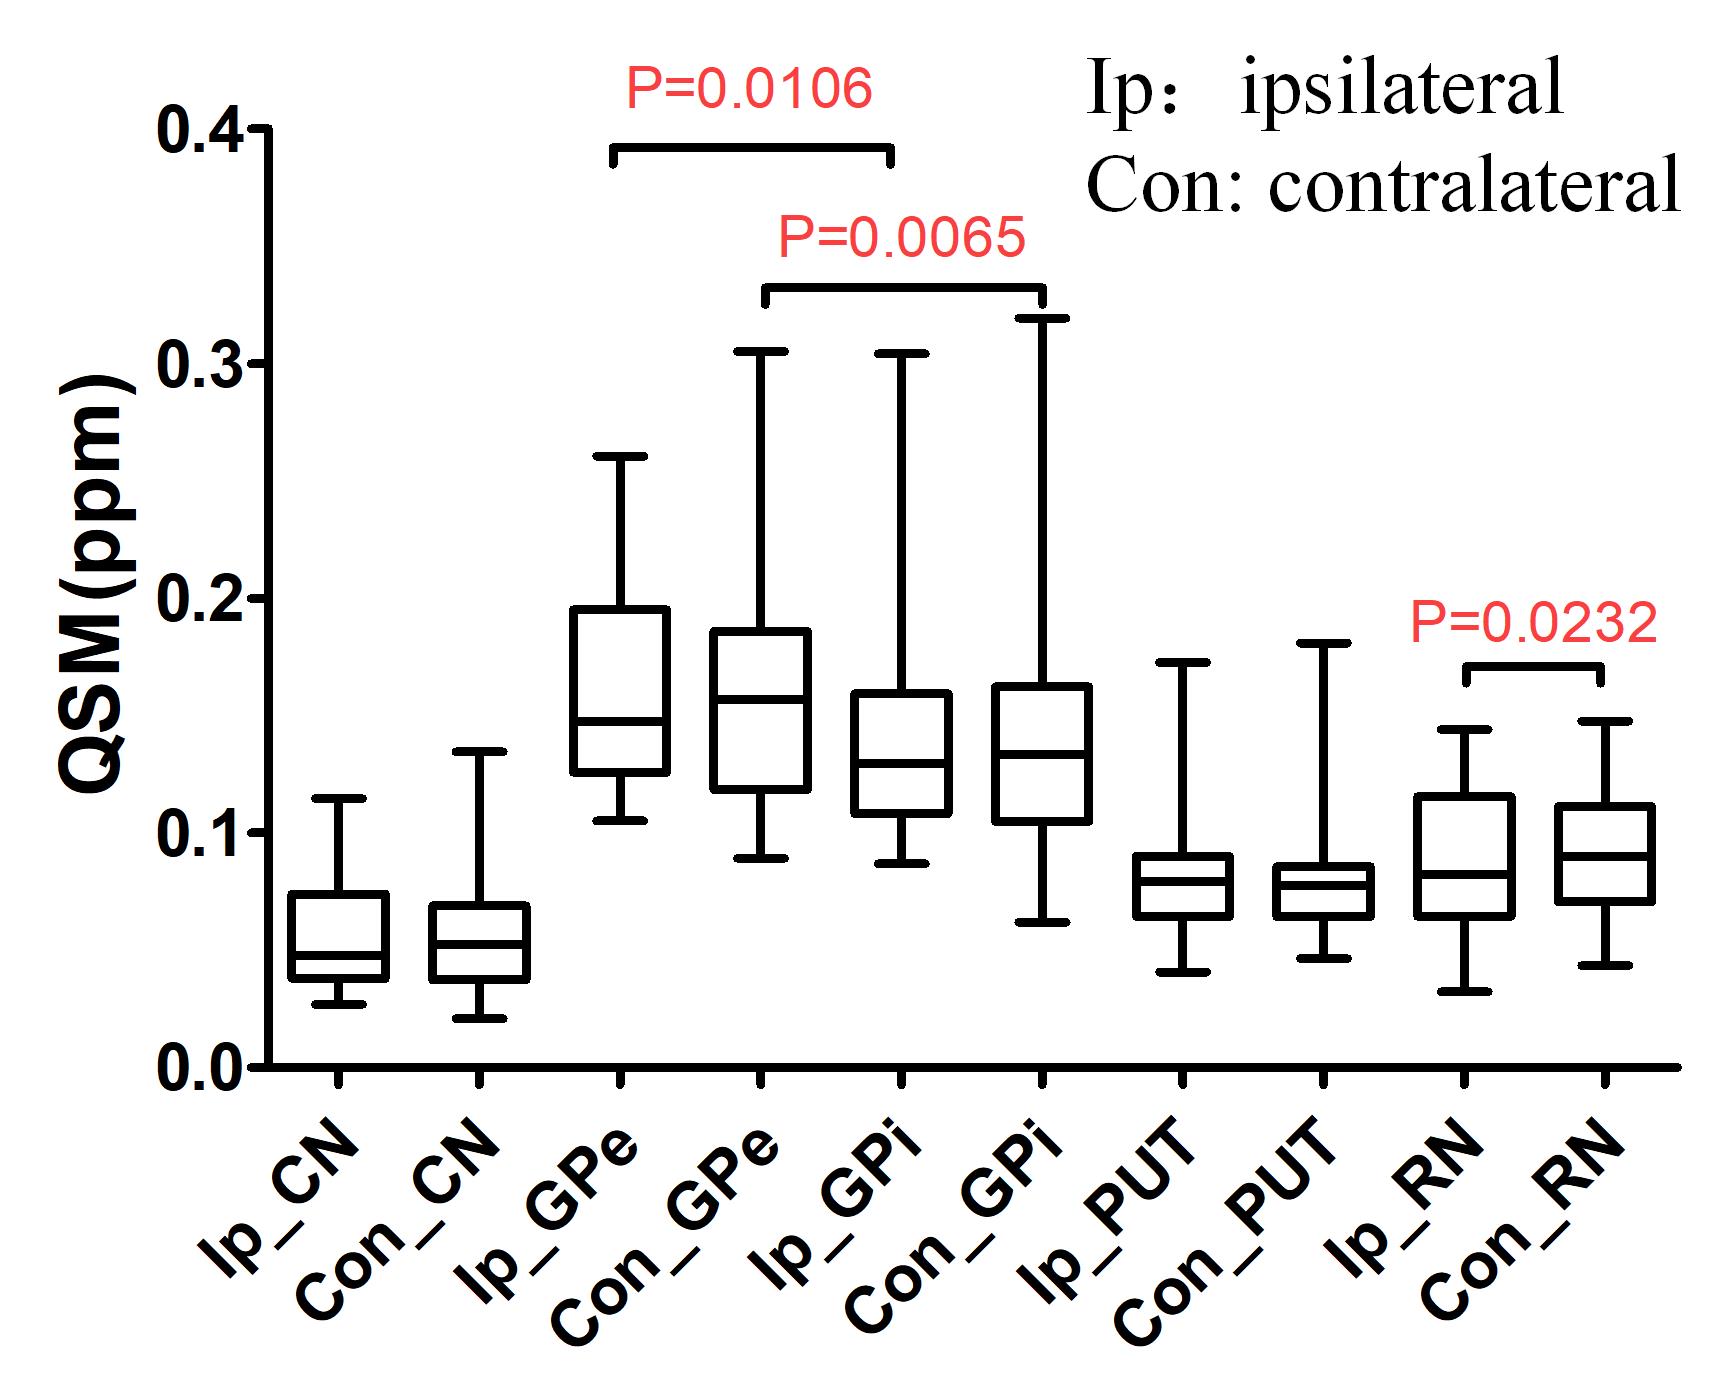
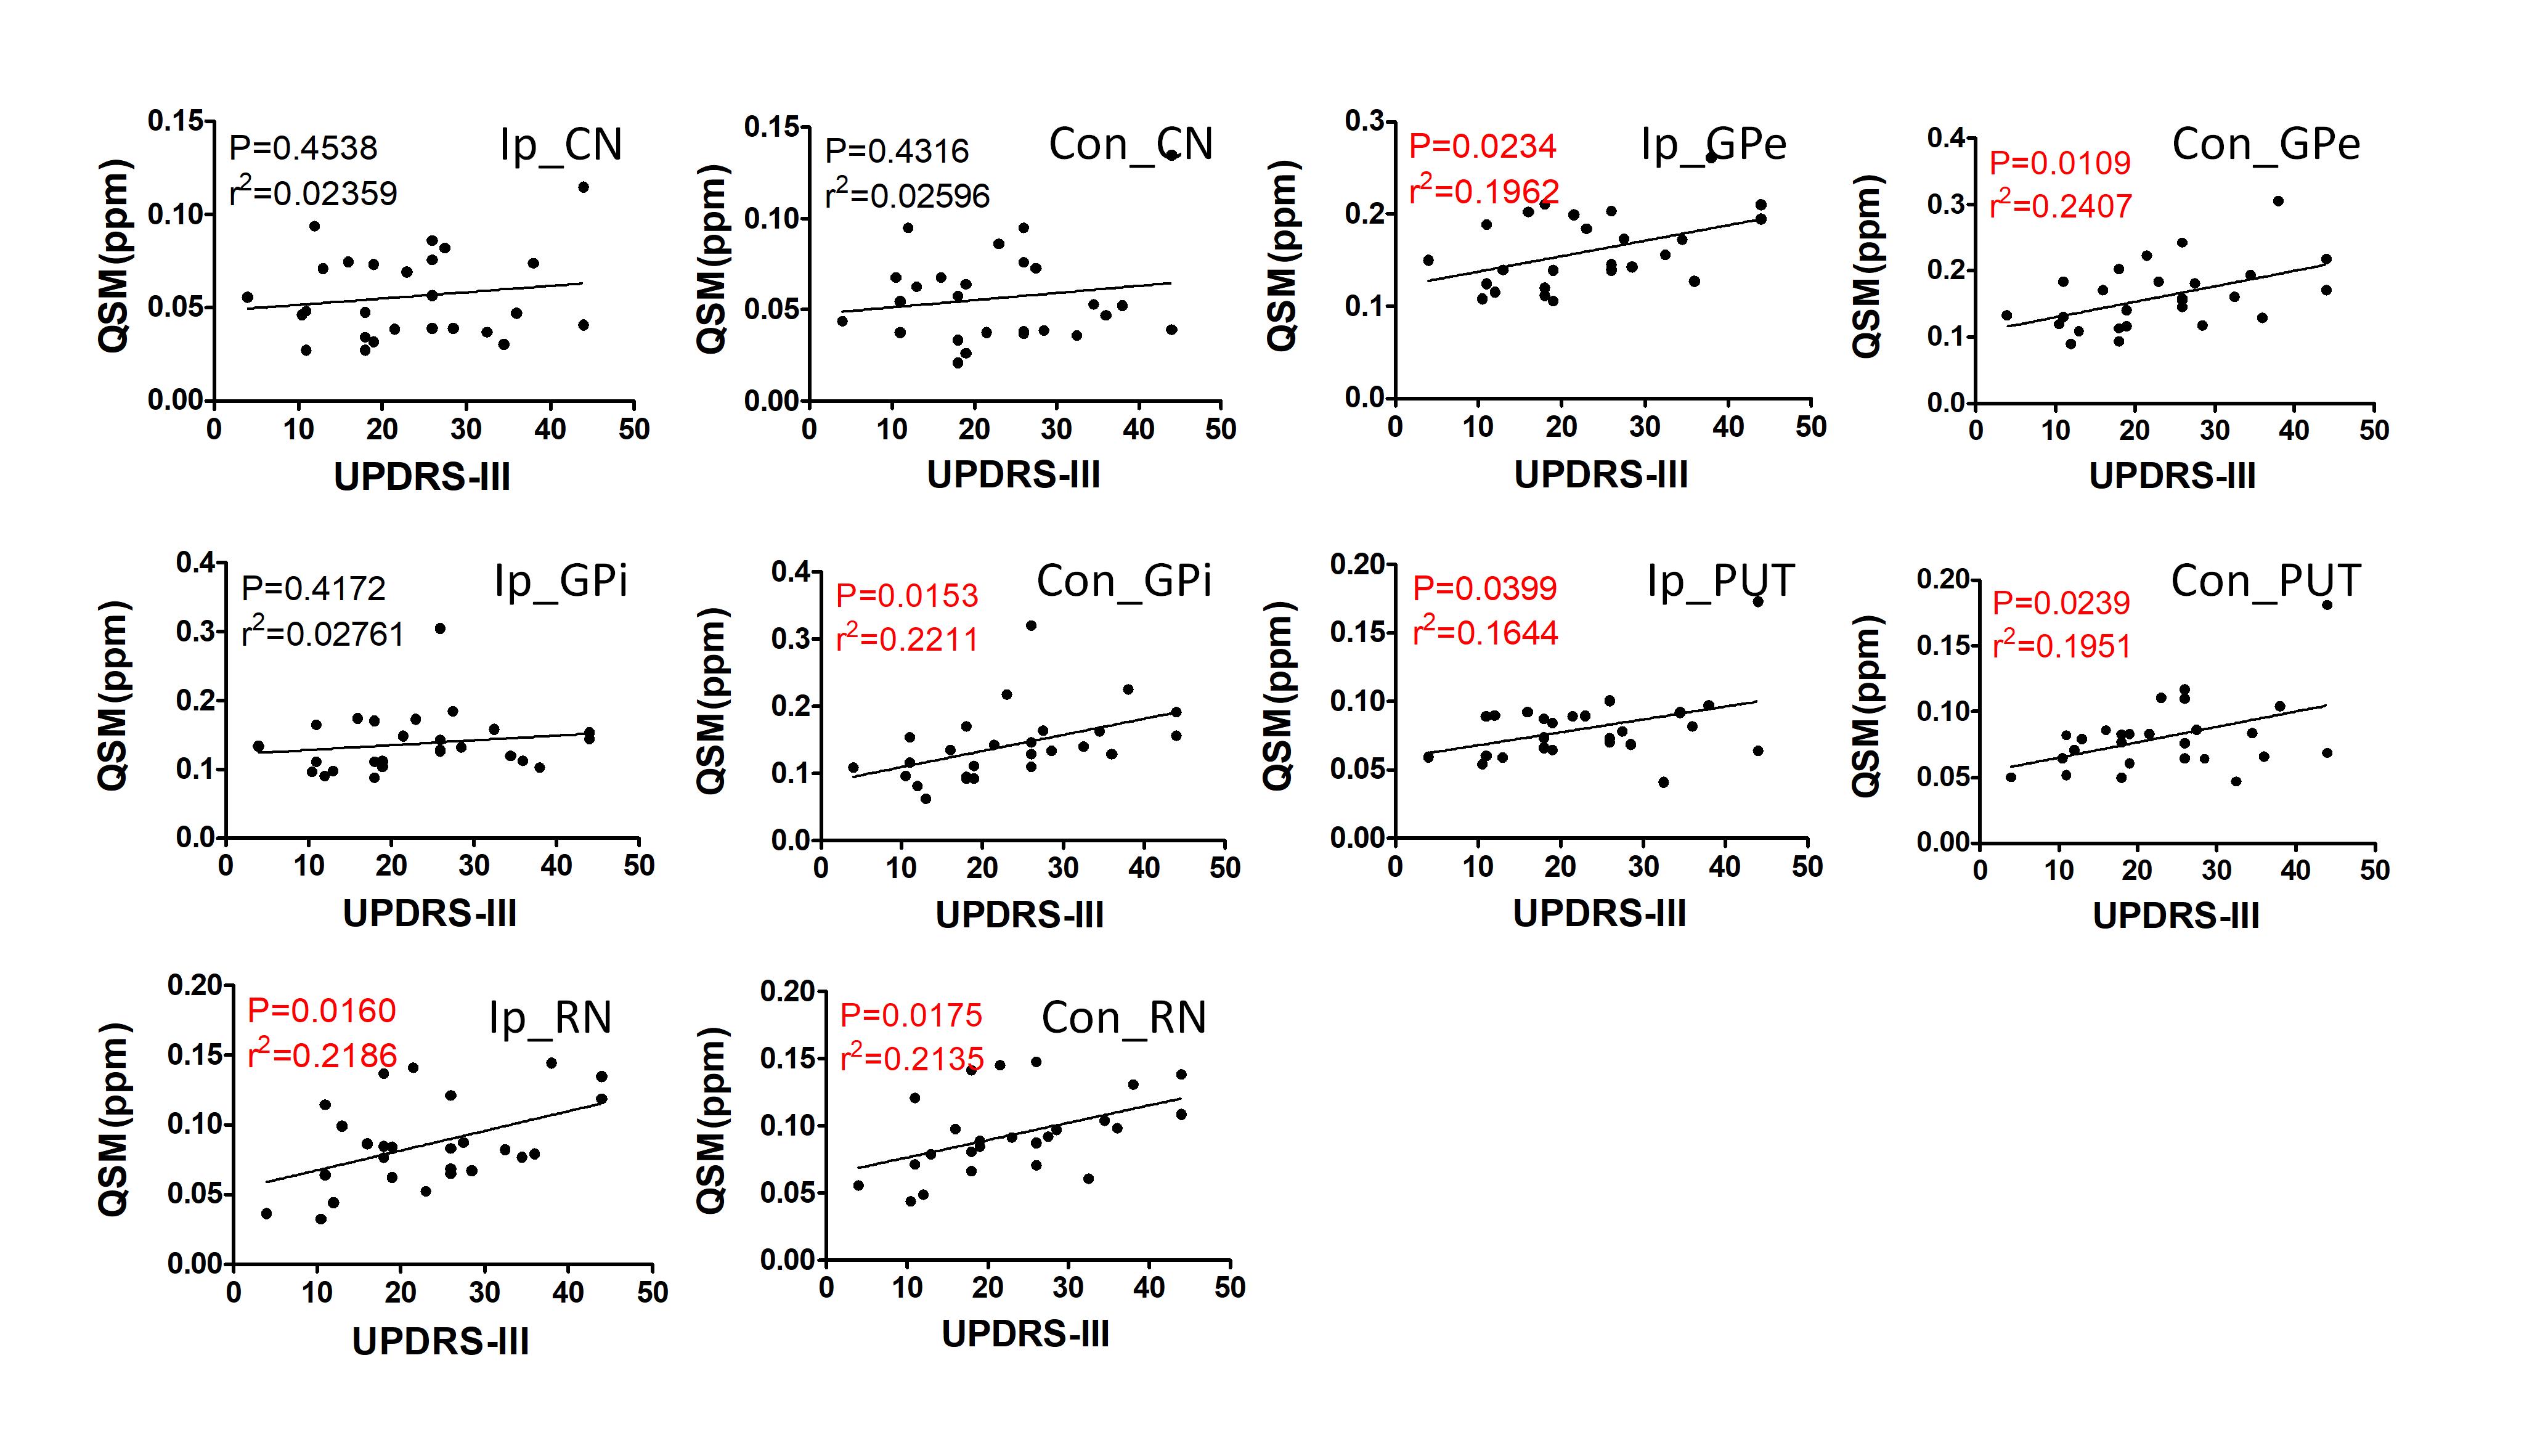
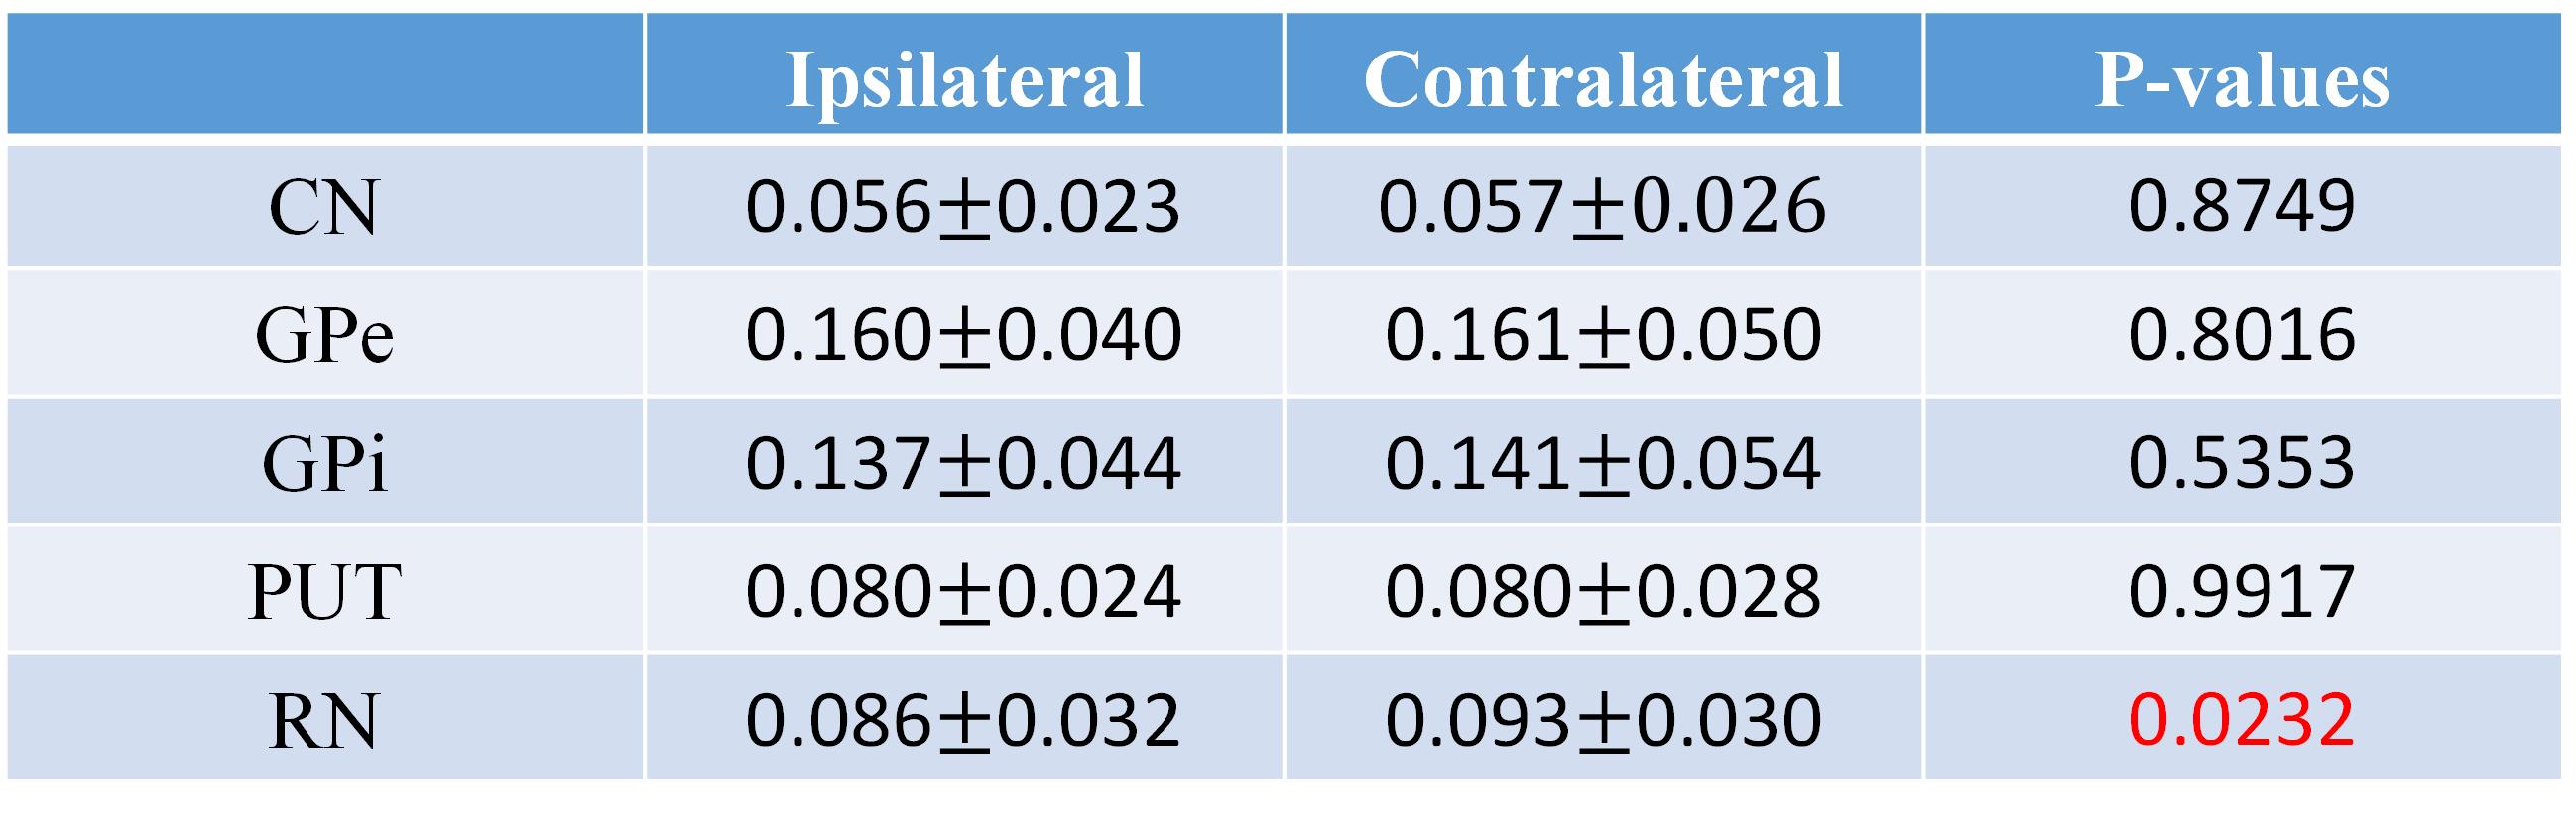
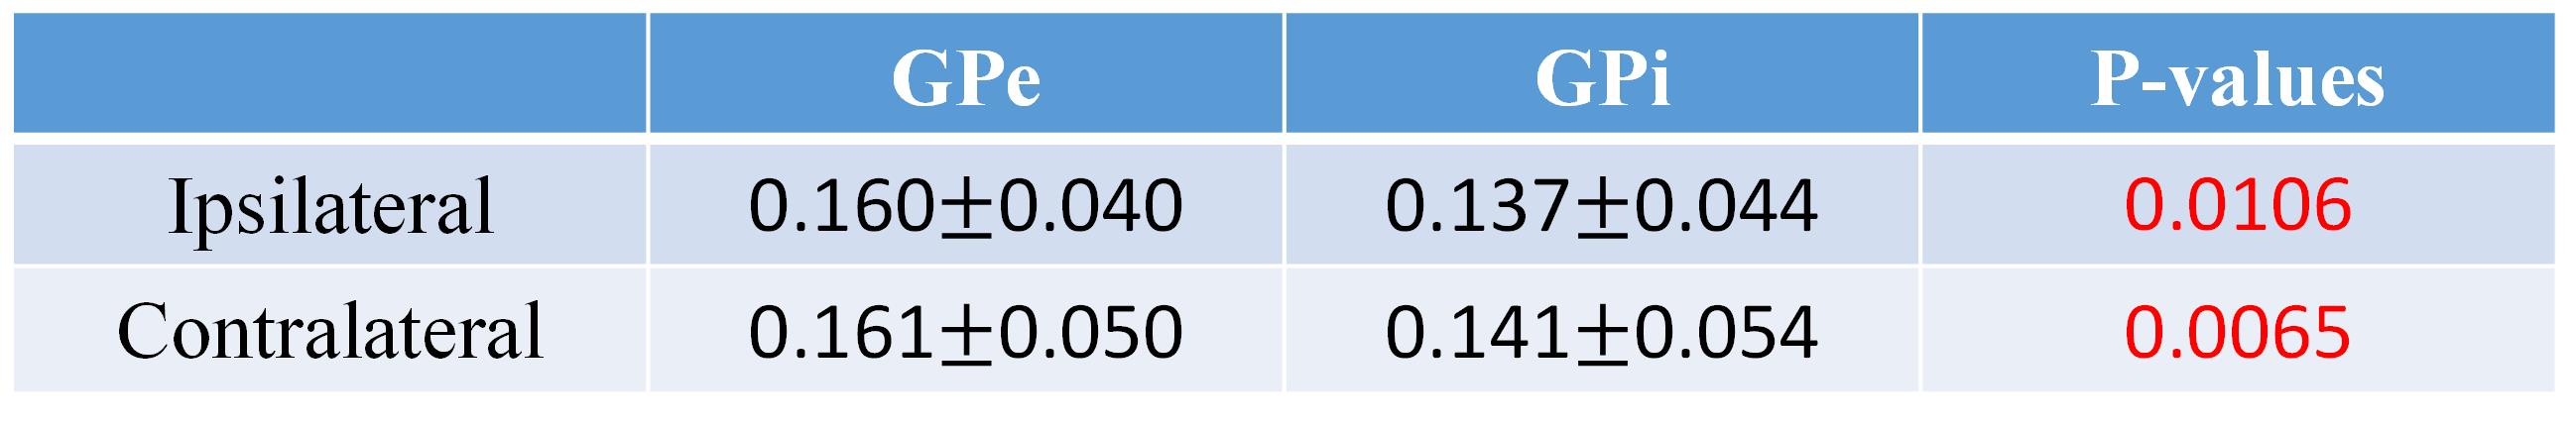
Fig. 2 shows the distribution of average QSM values from the PD patients in bilateral nucleus mentioned above, the pattern of which agrees with the results reported before [6,8]. Correlation tests were performed for each region, and significant correlations were found in bilateral GPe, PUT, RN, and contralateral GPi, which are shown in Fig. 3. Paired t-tests for average QSM values in the ipsilateral nucleus to the main motion impairment side and the contralateral nucleus were performed. The result P values are listed in Table 1. Significant difference was only found in the RN area (P < 0.05). Paired t-tests were performed for the bilateral GPe and GPi area and both show significant difference, which indicate that the iron accumulation is higher in GPe than GPi, and agrees with the results reported by Guan [8].Conclusion
Our data showed
that the iron concentration in bilateral GP, PUT and RN (except CN) and the
UPDRS-III scores have significant correlations, which can serves as an evidence
that iron accumulation can be an important index for the diagnosis of PD and
its severity. Considering the bilateral difference in different nucleus, it is
found that contralateral iron accumulation is only higher than ipsilateral
deposition in RN and the QSM values in contralateral GPi show significant
correlations while do not in ipsilateral GPi. These results indicate the
special roles of RN and GPi in the formation of PD and further studies with
more data required.Acknowledgements
No acknowledgement found.References
[1] Braak H, et al, Neurobiology of aging, 2003, 24(2): 197-211.
[2] Graham J M, et al, Brain, 2000, 123(12): 2423-2431.
[3] Shmueli K, et al, Magnetic resonance in medicine, 2009, 62(6): 1510-1522.
[4] Langkammer C, et al, Neuroimage, 2012, 62(3): 1593-1599.
[5] Du G, et al, Movement Disorders, 2016, 31(3): 317-324.
[6] Naying He et al., Human Brain Mapping, 2015; 36(11): 4407-4420.
[7] He N, et al, NMR in Biomedicine, 2017, 30(4).
[8] Guan X, et al, NMR in Biomedicine, 2017, 30(4).
[9] Fahn S, et al, Parkinson’s Dis. 1987; 2: 153–163.
[10] Liu C, et al, Magn Reson Med. 2010;63(6):1471-7
Figures