1941
QSM versus R2* to study iron deposition in the substantia nigra and subthalamic nucleus in Parkinson’s disease and REM sleep behavior disorders1CENIR, ICM, Paris, France, 2Inserm U 1127, CNRS UMR 7225, Sorbonne Universités, UPMC Univ Paris 06 UMR S 1127, Institut du Cerveau et de la Moelle épinière, ICM, Paris, France
Synopsis
Here, we compared R2* relaxation rate and QSM to study iron deposition in the substantia nigra (SN) and subthalamic nucleus (STN) in patients with early PD and idiopathic REM sleep behavior disorders with two different segmentation methods. PD patients showed increased iron deposition in the SN and STN as compared with healthy controls with QSM and R2*. iRBD only showed an increase tendency of QSM values compared to healthy controls. Obtained p-values were more systematically lower in QSM than in R2*.
Background
Parkinson’s disease patients present neurodegenerative changes in the substantia nigra (SN) associated with increase iron deposition1. Increased iron deposition in the SN can be quantified using iron-sensitive techniques such as R2* relaxation rate, susceptibility-weighted imaging (SWI) and QSM2. Previous studies have also shown that QSM may be better than R2* mapping to distinguish between Parkinsonian subjects and controls3, and that QSM correlates well with iron load in iron-rich regions4. Idiopathic rapid eye movement sleep behavior disorder (iRBD) is considered to be a prodromal stage of Parkinsonism. A previous study did not report any difference in the SN between the iRBD and HC groups using R2*5. Another study in healthy controls has also suggested that although both QSM and R2* were reproducible across successive MR examinations, R2* had lower coefficient of variation than QSM methods6.Methods
Experiments were conducted in three groups. PD group: 60 patients with early Parkinson’s disease (mean age = 67.3±6.5 years, mean disease duration = 2.2±1.3 years, mean MDS-UPDRS III= 24.3±12.9). iRBD groupe: 19 patients with idiopathic RBD (mean age = 67.3±6.5 years, MDS-UPDRS III=12 ±5.4). HC group: 19 age-matched healthy volunteers (mean age = 60.9±8.6 years). Image acquisition was performed using a 3T Prisma Siemens system with a 64-channel head coil. The MR protocol included a 3D MP2RAGE (1mm3 isovoxel size) and a 3D-Multi Echo GRE (MGE) with 12 echoes (1*1*2 mm3 reconstructed on 1mm3 isovoxel size, TEs ranging from 4 to 37 ms, scan time: 9 min). Magnitude and Phase images were reconstructed from raw data with in-house method7 in Matlab (Mathworks, USA). QSM image reconstruction was performed with MEDI-Toolbox8,9. R2* maps were obtained by first fitting a monoexponential decay on each echo for every voxel, then inverted to obtain R2* local values. Regions-of-interest included the substantia nigra (SN) and the subthalamic nucleus (STN). ROI were obtained with two different methods as follows. Method 1: contours of the SN and STN were drawn manually using FreeSurfer on the basis of the most intense signal area on the QSM images. The SN was defined as the hyperintense area dorsal to the cerebral peduncle and ventral to the red nucleus. The STN was situated above the SN. Method 2: MGE volumes were coregistered to the T1-weighted MP2RAGE volume. We used the T1 volume to segment and normalize with the spm12 segment function. We then used the computed transformation to normalize the manually drawn ROIs into MNI space and averaged across the subjects. We then thresholded the average to keep voxel belonging to at least 40% of the subjects. This mean ROI was then denormalized to the subject space so that QSM and R2* values can be extracted. Left and right values of each ROI were averaged. A 3x2 mixed design Anova followed by post-hoc tests was performed for each ROI and each methods to determine ifversus there is a statistically significant difference between the three groups and the two parametric mapping (QSM and R2*).Results
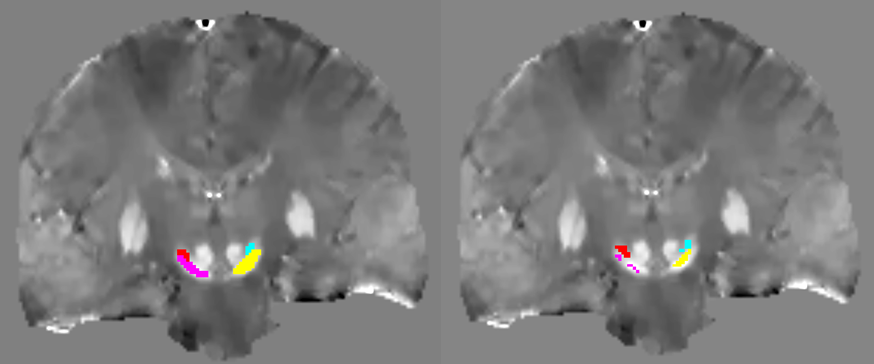
Figure 1 shows obtained QSM images overlayed with the ROIs obtained from the two dmethods. For Method 1, results showed statistically significant difference between the HC, iRBD and PD groups (F(2,94)=4.46, p=0.0141) for STN (F(1,94)=595.503, p< 2e-16). For Method 2, results showed statistically significant difference between the three groups (F(2,93)=4.15, p=0.0187) or the STN (F(1,93)=580.487, p< 2e-16). The ICC coefficient between the two methods was 0.976 for QSM and for 0.970 R2*. Figure 2 shows obtained mean QSM and R2* values for every groups, each ROI and both Methods. For Method 1, QSM values in the SN were significantly increased in PD versus HC (p=0.043) but not with R2*. In the STN, QSM values were significantly increased between HC and PD (p=0.0017) and between iRBD and PD (p=0.0031) as well as R2* values (with respective p-values of 0.027 and 0.047). For Method 2, we demonstrated a significant increase of QSM values in the STN between HC and PD (p=0.0053) and between iRBD and PD (p=0.0032) as well as R2* values (with respective p-values of 0.033 and 0.014). No statistical difference was observed between iRBD and HC.
Discussion and Conclusions
ICC results suggested that both segmentation methods were similar. PD patients showed increased iron deposition in the SN as compared with healthy controls. iRBD only showed an increase tendency of QSM values compared to healthy controls, but this was not statistically significant. However, QSM still appeared as a more sensitive tool to distinguish PD patients and healthy controls compared to conventional R2* mapping. Future work will require a separate analysis of the hemispheres contra and ipsilateral to the most affected body side as well as a correlation with motor scores.Acknowledgements
The research leading to these results has received funding from the program “Investissements d’avenir” ANR-10-IAIHU-06References
1. Hare and Double Brain 2016. 2. Lehericy et al. Mov Disord 2017. 3. Barbosa JHO et al. Magn Reson Imaging 2015. 4. Langkammer C et al. Neuroimage 2012. 5. Pyatigorskaya et al. Sleep 2017. 6. Santin MD et al. NMR Biomed 2017. 7. Santin MD. Pending Patent, #1759804/1000427656, 2017. 8. Zhou D et al. NMR Biomed. 2014 Mar; 27(3). 9. Liu J et al. Neuroimage 2011.Figures