1940
BOLD responses to light stimulus frequency in the rat visual pathway reveal profound effects of Parkinson’s disease in the Superior Colliculus1Grenoble Institut of Neurosciences, Inserm U1216, La Tronche, France, 2UMS Irmage, La Tronche, France
Synopsis
Sensory disorders are associated with Parkinson Disease (PD) at an early stage. We explored with fMRI the visual pathway response to light stimulus frequency in PD rat models. Activation of the Superior Colliculus (SC) was exacerbated at low frequency (1-3%) and rapidly saturated compared to controls. These results confirm the possible role of SC as an early biomarker of the disease.
Introduction
Parkinson's disease (PD) is a neurodegenerative disorder characterized by the progressive loss of dopaminergic neurons. Sensory disorders are associated with PD and appear a long time before the onset of the well-known motor symptoms. A recent electrophysiological study in a PD rat model 1 has revealed the dysfunction of Superior Colliculus (SC), a retinotopic structure involved in vision 2. The aim of this study was to explore SC and visual structures (lateral geniculate nucleus, LGN and V1) in a rat model of PD with the fMRI technique under the hypothesis that the SC could be used as a PD marker.Methods
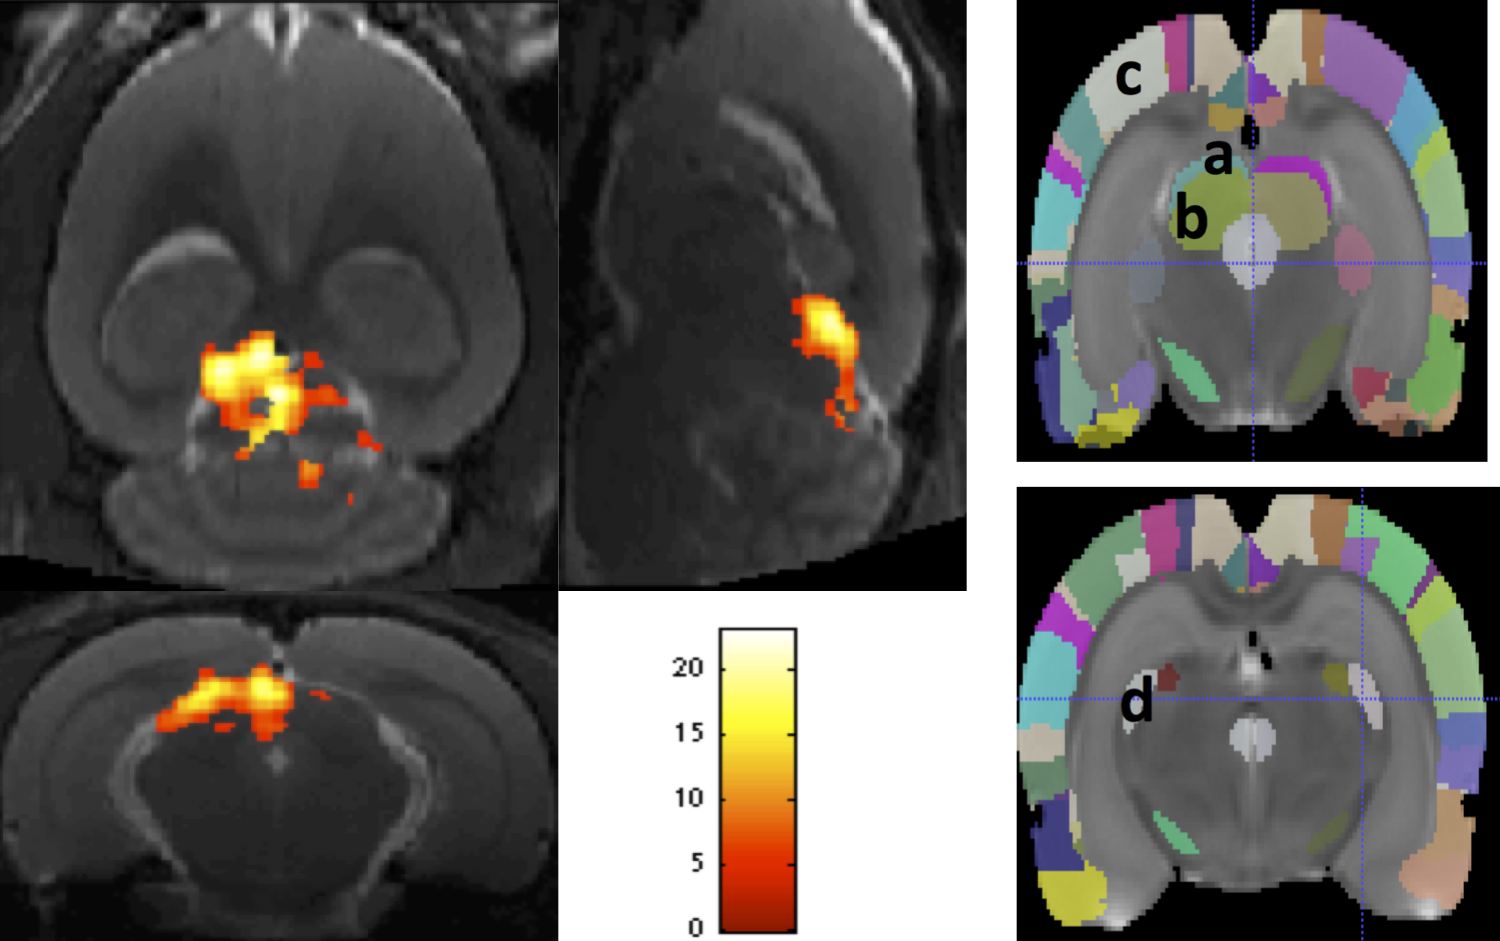
Animals. Six Long Evans (LG) rats (Controls) and six parkinson rat (PD) models (LG with an intracerebral injection of 6-hydroxydopamine in the right SNr) were anesthetized with a intramuscular injection of Medetomidine 0.5ml/kg (Domitor, Pfizer). Rats were spontaneously breathing throughout the entire experiment. MRI. All the images were acquired using a 9.4 T horizontal scanner (Brüker). A circular receiver surface coil (diam: 24 mm) was placed above the dorsocaudal part of the brain. Functional images consisted in a T2*-weighted sequence (TE/TR/flip angle=20 ms/2s/90°, matrix size=64 x 64, FOV=30x30mm, in-plane resolution=0.469 x 0.469 mm2 , slice thickness=1 mm). The T2-weighted Turbo Rare structural image comprised fifty coronal slices (TE/TR/flip angle=36ms/5.7s/90°, echo-spacing=8ms, Rare factor=8, average=6, matrix size= 256 x 256, FOV=30x30, in-plane resolution=0.117 x 0.117 mm2, slice thickness=0.5 mm). Stimulus and visual stimulation. To modulate the functional SC activity the block paradigm consisted in 5ms light monocular flashes emitted by a blue LED (450 nm, 100cd/m2). Each fMRI run was composed of 10 stimulation blocks, 12s each, alternating with a 20s rest period. In each block the light frequency was kept constant. Five frequencies were used 1Hz, 3hz, 5Hz, 8Hz and 10Hz in a first experiment (Exp1, 4 controls and 4 PDs) and 0.5Hz, 1Hz, 1.5hz, 2Hz and 3Hz in a second experiment (Exp2, 2 controls and 2 PD) randomly presented in 14 fMRI separate runs. The monocular visual stimulation was transmitted via an optic fiber to the left eye. Data Analysis. All data were processed using SPM12. After realignment to the functional mean, the structural image was non-linearly deformed to fit an in-house atlas (see Fig.1). The computed individual deformation field was applied to all corresponding functional images. Individual functional images were analysed using a General Linear Model. The six conditions of interest were modeled as regressors constructed as a boxcar function convolved with a canonical response function. Based on our atlas, we conducted a region-of-interest (ROI) analysis in superficial (sSC) and deep (dSC) layers of SC, LGN and V1. Contrast images were computed relative to each stimulus condition compared to the baseline (rest) across all runs. For each ROI we retained and averaged voxels that showed a significant t-value (p<0.05 FWE corrected).Results
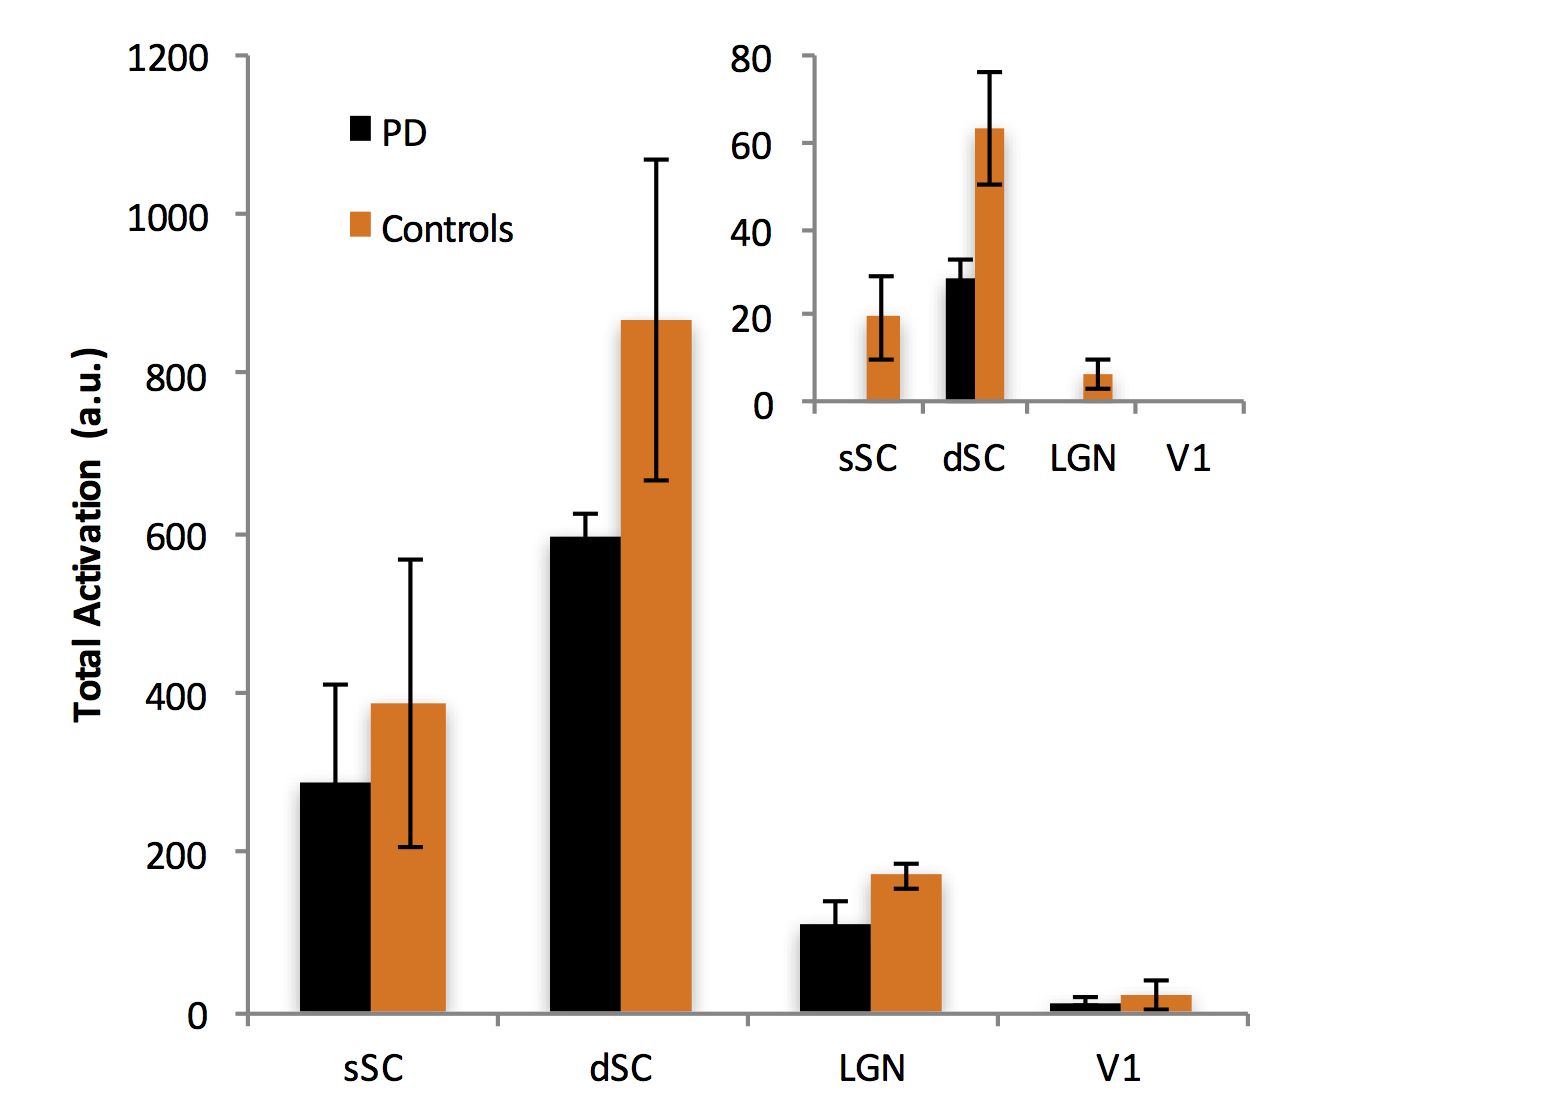
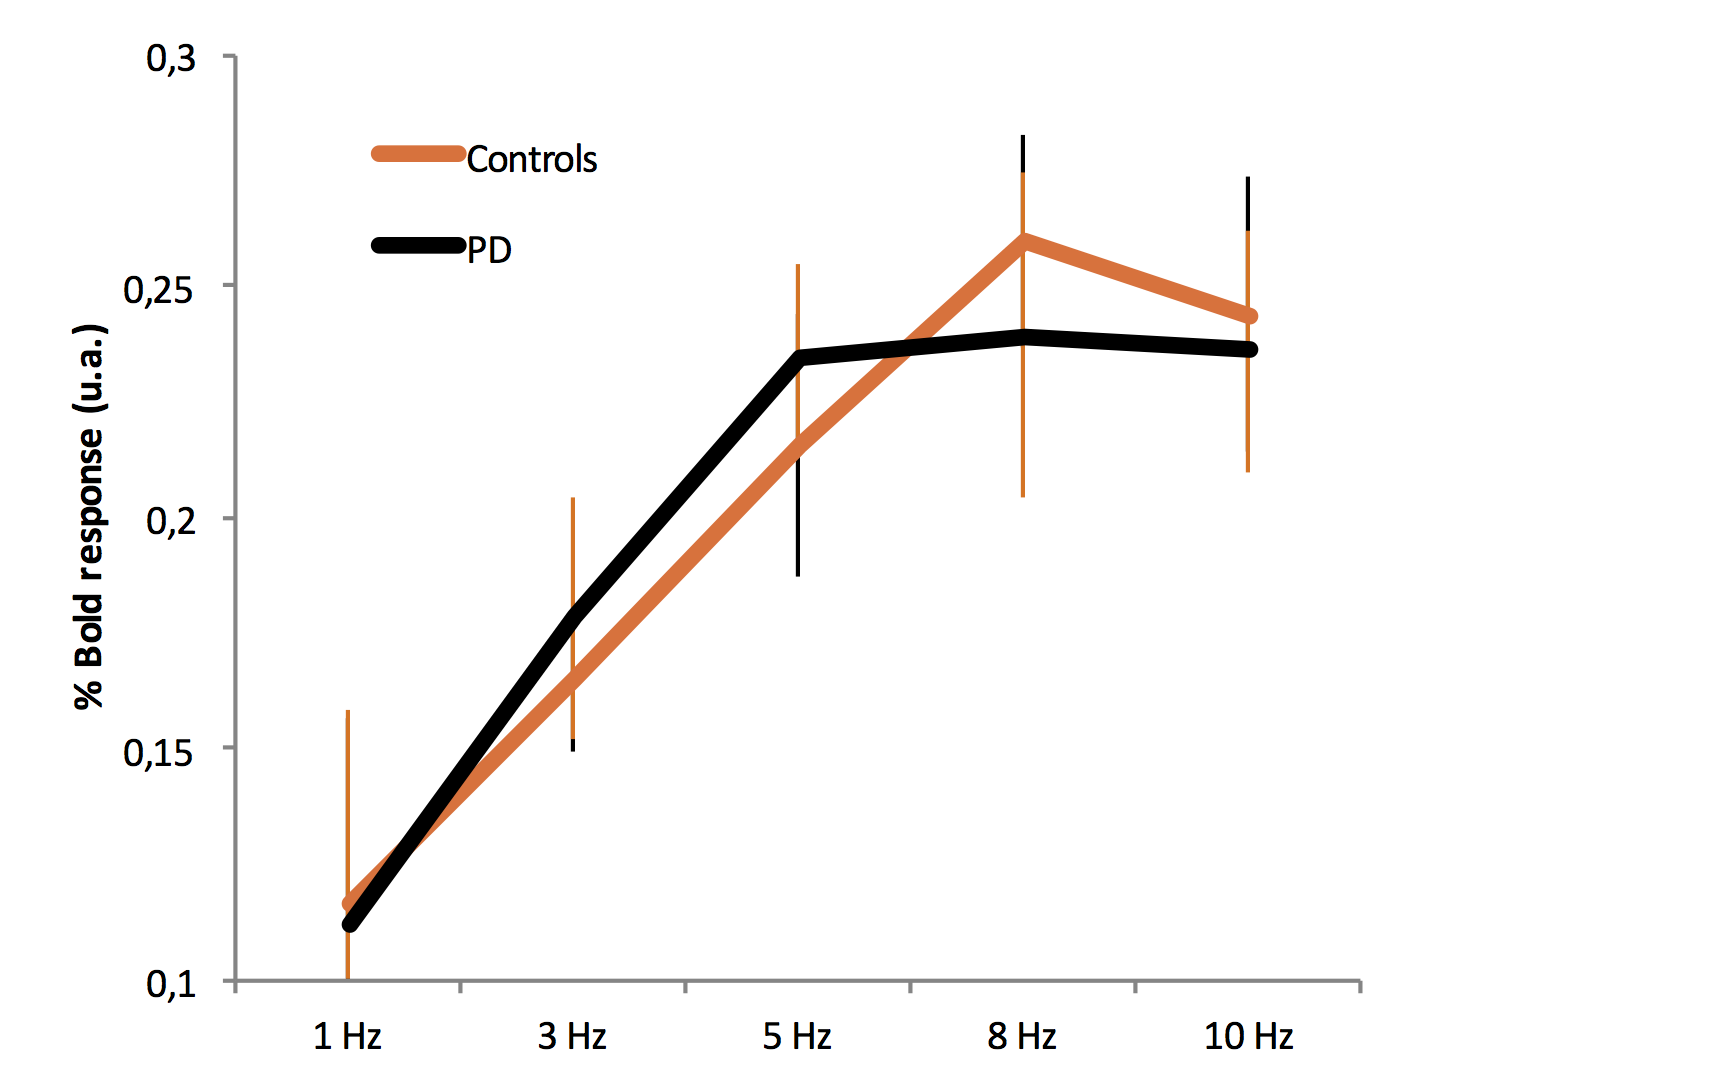
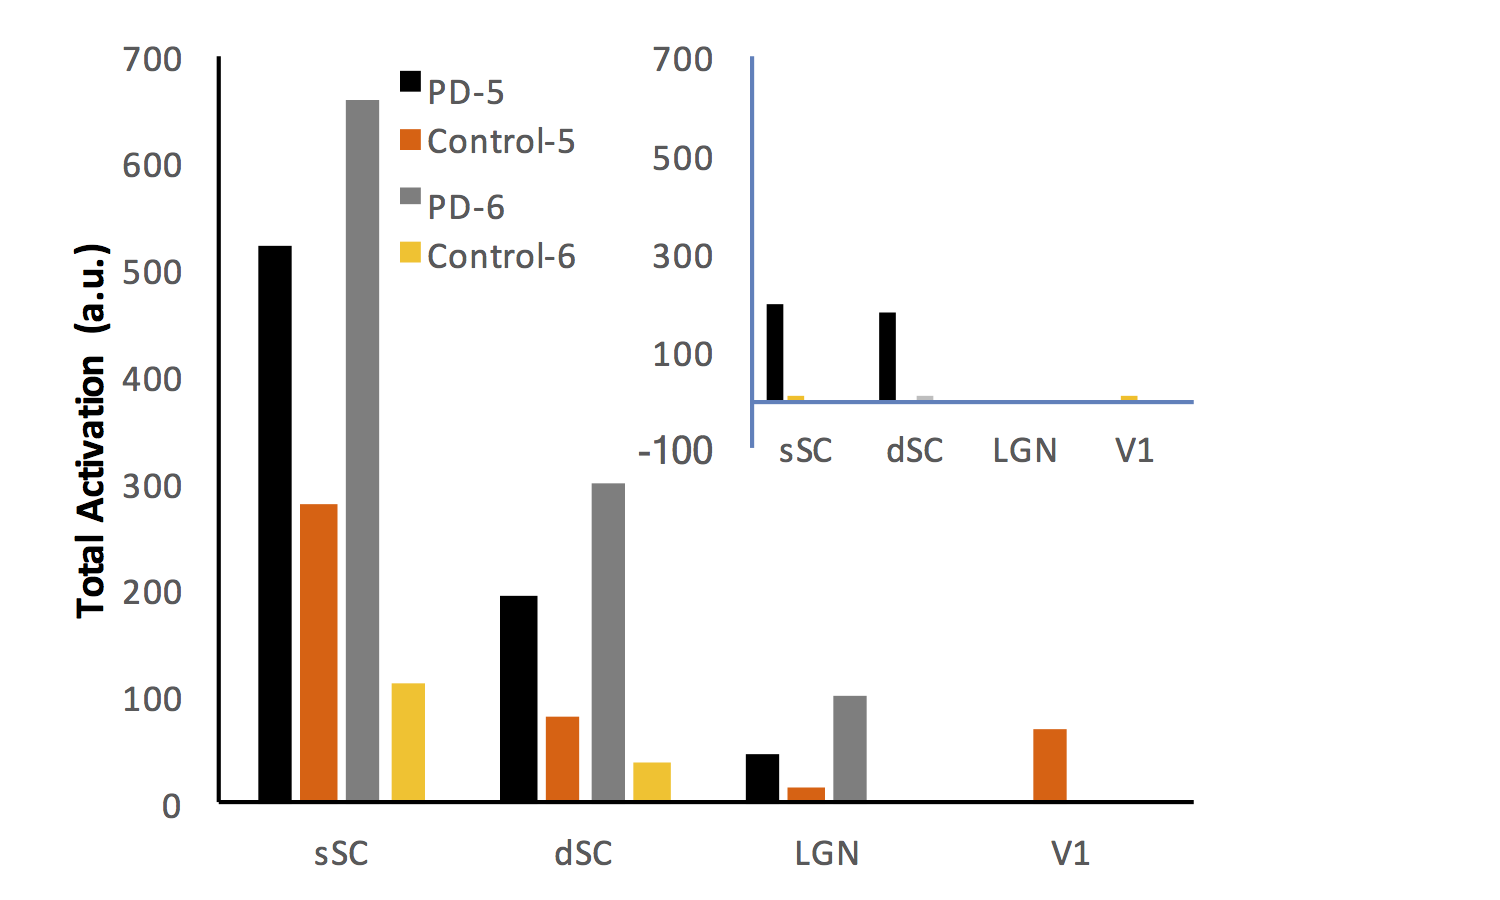
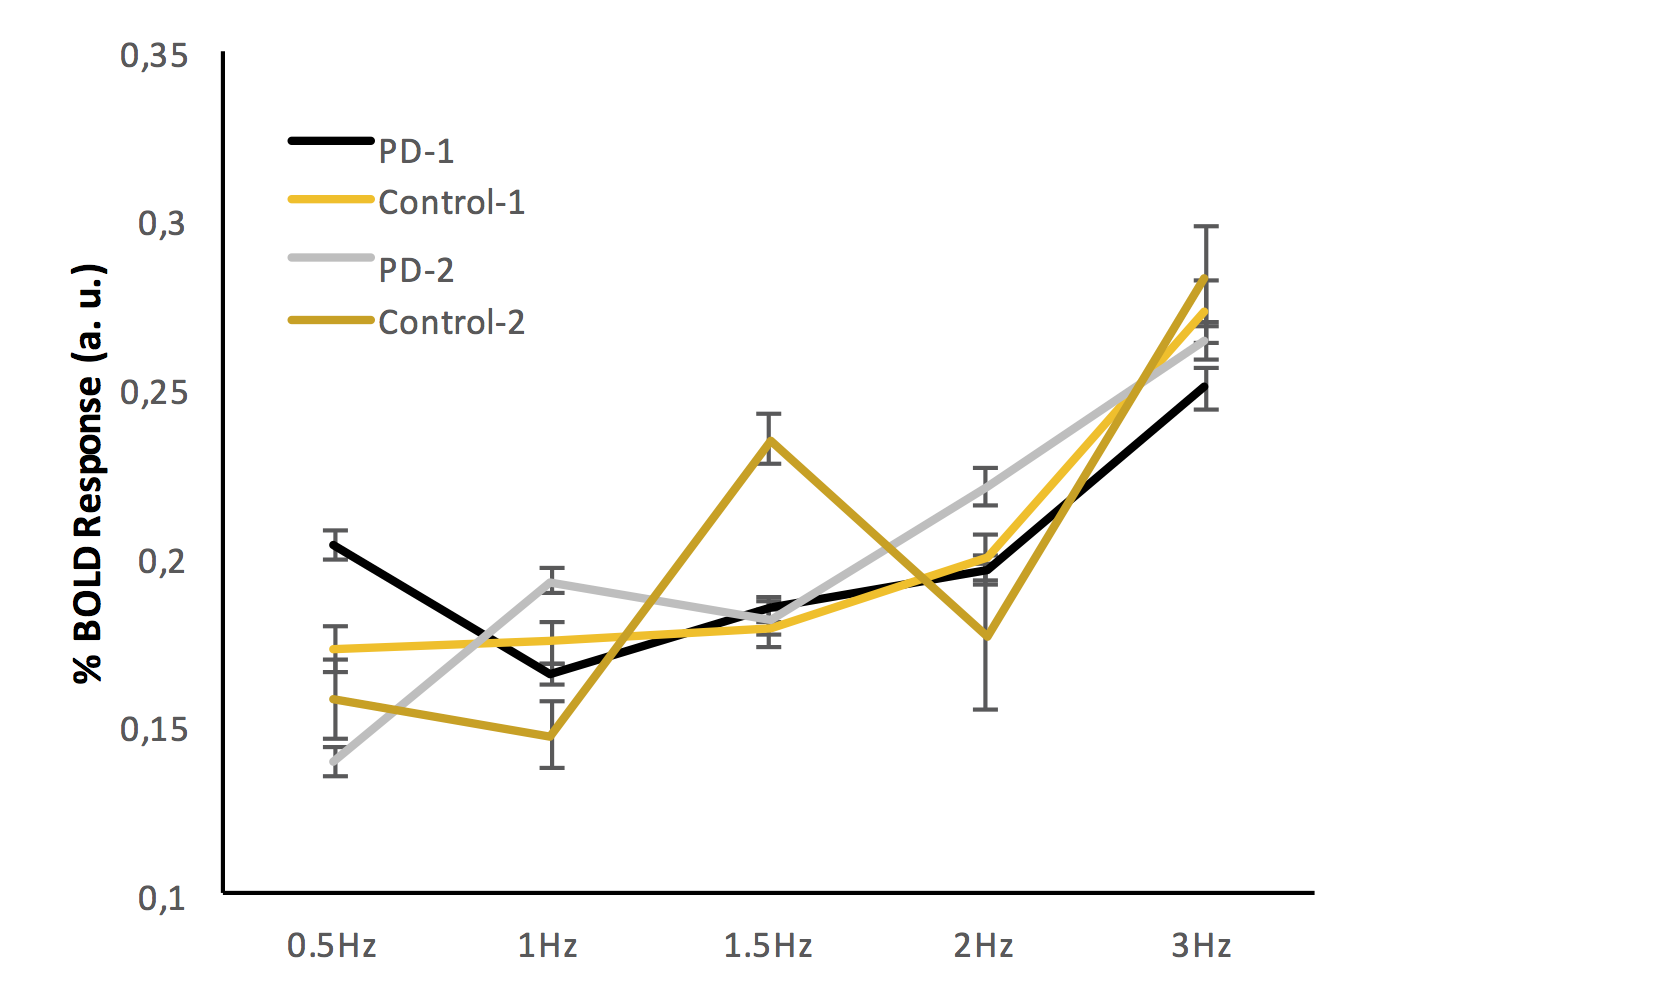
Following the retinotopic property of the first steps of the visual pathway, a monocular left visual stimulation led to activation in the right hemisphere (see Figure 1) and few ipsilateral activation (see inset Figure 2). In Exp1., ROI activation was higher for the control group compared to the PD group (see Figure 2). The most sensitive regions were SC and LGN: 87% (sSC=45%, dSC=42%) and 88% of their voxels were respectively activated in controls vs 51% and 46% in PDs. As shown in Figure 3, the SC response was linearly dependent of light frequency with a saturation at 8Hz for controls. For PDs, the SC response was sharper and more rapidly saturated (5Hz). However, when light frequency varied between 0.5-3Hz (Exp2), BOLD activation was higher in PDs, SC being the most activated region (92%, sSC=77%, dSC=15% of voxels), then LGN (47%) compared to controls (42% and 10% respectively). Similarly to 3 we noted that BOLD signal was attenuated in the cortex compared to subcortex. Figure 5 shows the corresponding modulated BOLD responses in SC.Discussion
This work represents the first fMRI study of light frequency dependence of activity in the visual pathway of a PD rat model. On controls it complements previous work on SC activity in response to changes in light frequency 3,4. This response is linear in the 1-10Hz range in normal conditions. With PD, SC response is enhanced and rapidly saturated. This may reflects a mechanism to compensate for the inhibition exerted by the degeneration of the dopaminergic neurons of the SNr. The next step is to assess whether a dopaminergic treatment may restore the SC function. This results confirm the possible role of SC as an early PD biomarker 5.Acknowledgements
E. Bellot was recipient of a grant from the France Parkinson foundation and from the Université Grenoble Alpes. A. Pautrat is financially supported by a grant from the Auvergne-Rhône-Alpes region. This work was partly supported by a grant from ‘La Fondation de l’Avenir’ (France). The Grenoble MRI facility IRMaGe was partly funded by the French program ‘Investissement d’Avenir’ run by the Agence Nationale pour la Recherche (ANR-11-INBS-0006).References
1. Rolland M, Carcenac C, Overton PG, Savasta M, Coizet V. Enhanced visual responses in the superior colliculus and subthalamic nucleus in an animal model of Parkinson's disease. Neuroscience. 2013;252:277-88.
2. Schneider KA, Kastner S. Visual responses of the human superior colliculus: a high-resolution functional magnetic resonance imaging study. J Neurophysiol. 2005;94(4):2491-503.
3. Pawela CP, Hudetz AG, Ward BD, Schulte ML, Li R, Kao DS, et al. Modeling of region-specific fMRI BOLD neurovascular response functions in rat brain reveals residual differences that correlate with the differences in regional evoked potentials. Neuroimage. 2008;41(2):525-34.
4. Van Camp N, Verhoye M, De Zeeuw CI, Van der Linden A. Light stimulus frequency dependence of activity in the rat visual system as studied with high-resolution BOLD fMRI. J Neurophysiol. 2006;95(5):3164-70.
5. Bellot E, Coizet V, Meoni S, Pellissier P, Debu B, Dojat M, et al. The Superior Colliculus is impaired in de novo Parkinson’s disease patients. 21st International Congress of Parkinson’s Disease and Movement Disorders; Vancouver (Ca)2017.
Figures