1938
Validation of a 1.5T FSE NM-sensitive MRI sequence1Bioengineering Department / Institute for Systems and Robotics, Instituto Superior Técnico, University of Lisbon, Lisbon, Portugal, 2Neurological Imaging Department, Hospital de Santa Maria, Centro Hospitalar Lisboa Norte, Lisbon, Portugal, 3Clinical Pharmacology Unit, Instituto de Medicina Molecular, Faculdade de Medicina, University of Lisbon, Lisbon, Portugal, 4Neurology Department, Hospital de Santa Maria, Centro Hospitalar Lisboa Norte, Lisbon, Portugal
Synopsis
Neuromelanin(NM)-sensitive MRI is a promising technique for enlightening pathological changes in NM-containing structures. Fast-Spin-Echo (FSE) based NM-MRI sequences have been applied at 3T for improved resolution and signal-to-noise ratio but scanner availability and safety concerns may prevent imaging at this field strength. A 1.5T NM-MRI FSE sequence was developed and compared to the standard 3T NM-MRI sequence. Semi-automatic segmentation of the Substantia Nigra (SN) was performed with good reliability at both fields. The Bland-Altman method was used to compare SN areas between field strengths showing good agreement, supporting the possibility for using NM-MRI at 1.5T, widening its scope of applicability.
Introduction
Neuromelanin(NM)-sensitive MRI has been used to investigate pathological changes in NM-containing tissues.1,2 These images have been applied mainly in movement disorders, such as Parkinson’s Disease (PD), characterized by a reduction of NM-containing neurons in the Substantia Nigra (SN). NM-MRI has been mostly performed using multi-slice T1-weighted Fast Spin Echo (FSE) sequences, depicting the SN as a hyper-intense region.3 Most studies were performed at 3T3,4 for increased contrast, associated to the longer T1 and increased incidental Magnetization Transfer effects5, and improved signal-to-noise ratio (SNR). One of the available treatments for PD is to implant deep brain stimulation systems; an implication is that these patients can no longer be imaged at 3T for safety reasons.6 To enable patient follow-up, it is necessary to implement a 1.5T NM-MRI sequence and assess its reliability for evaluating SN changes, given the expected reductions in contrast and SNR. The aim of this study was therefore to investigate the repeatability of SN measurements obtained using a T1-weighted FSE sequence at 1.5T and compare it with a similar 3T sequence currently used in the clinic.Methods
12 subjects were imaged at 1.5T and 3T using FSE T1-weighted sequences. The 3T sequence had a repetition time (TR)/echo time (TE) of 606/10ms, turbo factor 3, field of view (FOV) 220×190 mm2, pixel size 0.40×0.40 mm2, parallel imaging (PI) with reduction factor 1.5 and acquisition time 8:35 min; 1.5T parameters: TR/TE 600/10ms, turbo factor 3, FOV 220×180 mm2, pixel size 0.50×0.50 mm2, no PI and scan duration 9:45 min. To evaluate repeatability, SN segmentation was performed three times by a single researcher, using a semi-automatic region growing algorithm with the OsiriX software as in7. Manual segmentation was used as a gold standard and the Dice similarity coefficient (DSC) calculated to evaluate spatial overlap between methods (Eq. 1):
$$Eq. 1: DSC=2\frac{area(SN_{sa}\bigcap SN_{m})}{area(SN_{sa})+area(SN_{m})},$$
where SNsa and SNm represent the SN regions-of-interest (ROI) semi-automatically and manually segmented. The contrast-to-noise ratio (CR) was estimated using Eq. 2:
$$Eq. 2: CR=\frac{I_{SN}}{I_{DP}},$$
where ISN represents the mean signal intensity of two 6.0 mm2 square ROI (one for each brain hemisphere) located in the SN and IDP is the mean signal intensity in a circular reference ROI (4.0 mm diameter) located in the decussation of the superior cerebellar peduncles. The Intraclass correlation coefficients (ICC) and their 95% confidence intervals (CI) were used to assess the repeatability of the semi-automatic segmentation procedure. Wilcoxon tests were used to compare between manual and semi-automatic SN areas and CR between fields. The Bland-Altman method was used to evaluate SN area agreement between field strengths. The R software was used for statistical analysis.
Results
Representative NM-MR images are shown in Fig. 1, illustrating the manual and semi-automatically segmented regions. Boxplots for the SN areas are shown in Fig. 2. A high ICC was obtained for the semi-automatic SN areas at both fields; according to the criteria in8, at 3T an almost perfect agreement (ICCArea,3T: 0.913, p<0.001) with a very narrow CI (0.84-0.96) was obtained; 1.5T SN areas presented a substantial agreement despite the wider CI (ICCArea,1.5T: 0.815, p<0.001, CI: 0.68-0.91). There was a good spatial overlap between semi-automatic and corresponding manual segmentations (median DSC of 0.72 for 1.5T and 0.77 for 3T) – Fig. 3. ICC for DSC measurements indicated a substantial agreement at 3T (ICCDSC,3T: 0.777, p<0.001) and an almost perfect agreement at 1.5T (ICCDSC,1.5T: 0.817, p<0.001). No differences were detected between the first semi-automatic and manually determined SN areas at 1.5T (p-value=0.1747) or 3T (p-value=0.0574). The Bland-Altman plot showed good agreement between semi-automatic SN areas obtained at different magnetic fields (Fig. 4) with a small positive bias of 1.56 mm2. However, its limits of agreement ranged from -13.07 mm2 to 16.2 mm2. No significant CR differences were detected (p-value=0.0523) although the median CR at 1.5T (1.16) was lower than at 3T (1.19) - Fig. 5.Discussion
High ICC and good spatial overlap revealed a good reliability of the semi-automatic method. Wider SN area ranges were obtained at 1.5T, most likely due to the lower CR which could have influenced the region growing segmentation. The bias observed with the Bland-Altman method revealed that the segmented areas were similar although the 1.5T areas tended to be slightly larger. The wide limits of agreement could be due to several factors (differences in CR, SNR, head positioning, motion artifacts).Conclusion
Semi-automatic segmentation of the SN area and its overlap with a manual reference region presented an excellent test-retest repeatability at both fields. SN measurements showed good agreement between field strengths although the CR tended to be lower at 1.5T.Acknowledgements
Grant from Fundação para a Ciência e a Tecnologia (UID/EEA/50009/2013).References
1. Nakamura K, Sugaya K. Neuromelanin-sensitive magnetic resonance imaging: a promising technique for depicting tissue characteristics containing neuromelanin. NRR. 2014; 9(7): 759-760.
2. Isaias IU, Trujillo P, Summers P, et al. Neuromelanin Imaging and Dopaminergic Loss in Parkinson's Disease. Front. Aging Neurosci. 2016; 8(196):1-12.
3. Sasaki M, Shibata E, Tohyama K, et al. Neuromelanin magnetic resonance imaging of locus ceruleus and substantia nigra in Parkinson's disease. Neuroreport. 2006; 17(11): 1215-1218.
4. Ohtsuka C, Sasaki M, Konno K, et al. Changes in substantia nigra and locus coeruleus in patients with early-stage Parkinson's disease using neuromelanin-sensitive MR imaging. Neurosci Lett. 2013; 541: 93-98.
5. Chang Y, Bae SJ, Lee YJ, et al. Incidental magnetization transfer effects in multislice brain MRI at 3.0 T. J Magn Reson Imaging. 2007; 25(4): 862-865.
6. Dempsey MF, Condon, B, Hadley, DM. Investigation of the factors responsible for burns during MRI. J Magn Reson Imaging. 2001; 13(4): 627-631.
7. Fabbri M, Reimão S, Carvalho M, et al. Substantia Nigra Neuromelanin as an Imaging Biomarker of Disease Progression in Parkinson’s Disease. J Parkinsons Dis. 2017; 7(3): 491-501.
8. Landis JR, Koch GG. The measurement of observer agreement for categorical data. Biometrics. 1977; 33(1): 159-174.
Figures
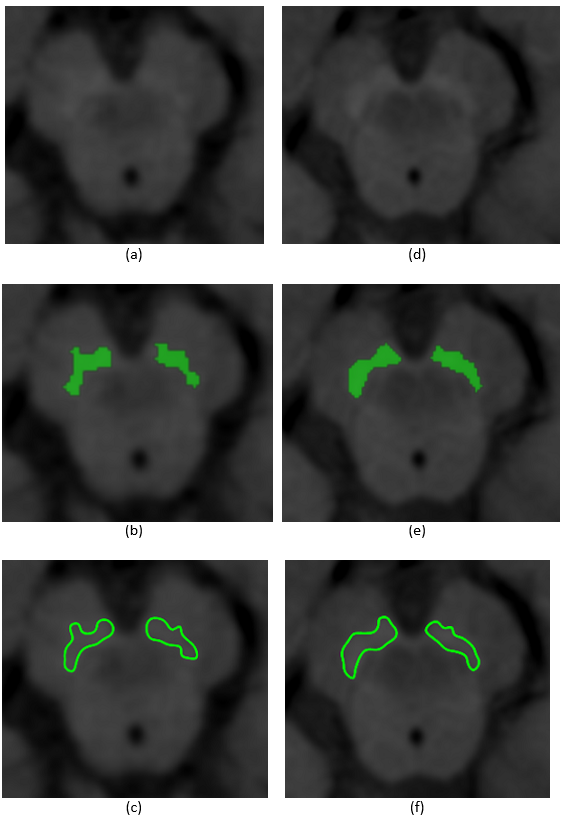
Fig. 1. SN NM-MR measurements
Representative images of the SN taken with a 1.5T machine (a, b, c) and a 3T machine (d, e, f) in a 38-year-old male patient. In images (b) and (e) are presented the SN ROI (one for each side of the brain) estimated with the semi-automatic segmentation algorithm and in (c) and (f) with the manual procedure.
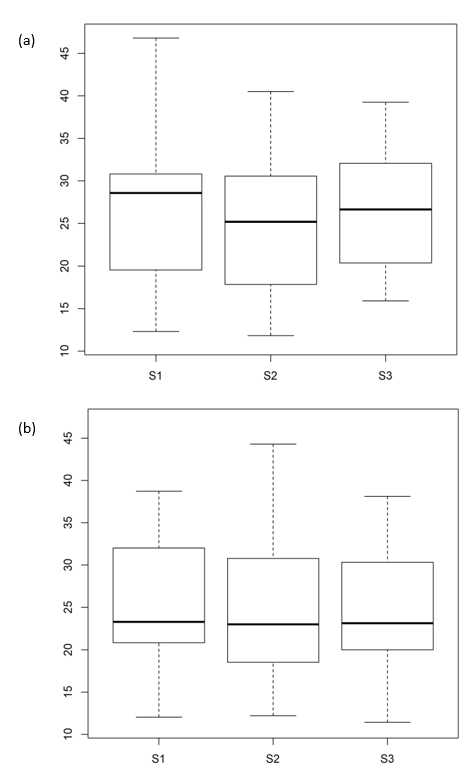
Fig. 2. Box-and-whisker plot of SN areas
Distribution of the SN areas (mm2) estimated with the semi-automatic algorithm (three repeats represented by S1, S2 and S3) for 1.5T (a) and 3T (b).
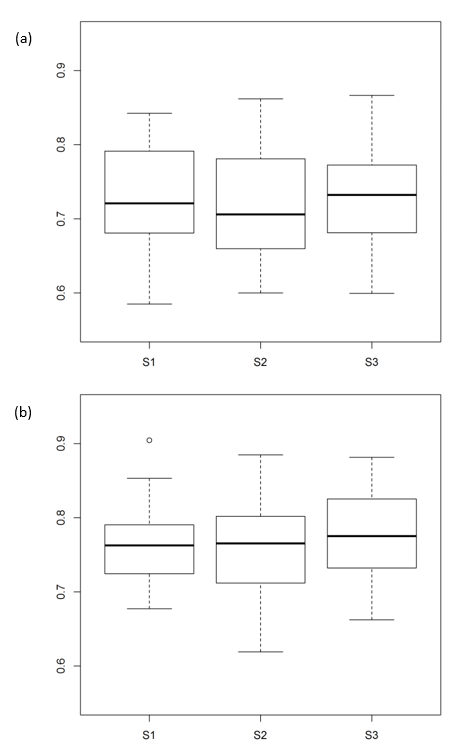
Fig. 3. Box-and-whisker plot of DSC
Distribution of DSC representing overlap between the segmented SN areas, estimated with the semi-automatic algorithm (three repeats represented by S1, S2 and S3) and the manual ROI - for 1.5T (a) and 3T (b).
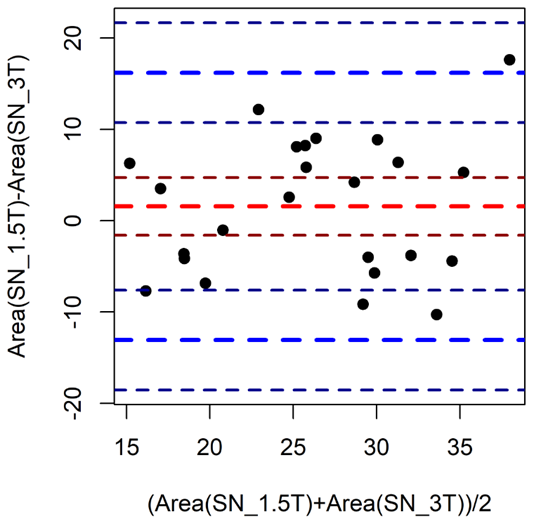
Fig. 4. Bland-Altman plot comparing SN areas between fields
Agreement analysis of SN areas between the two different sequences – 1.5T and 3T. The plot shows a small bias of 1.56 mm2 indicating slightly larger SN areas at 1.5T, and a 95% confidence agreement interval ranging from -13.07 mm2 to 16.20 mm2.
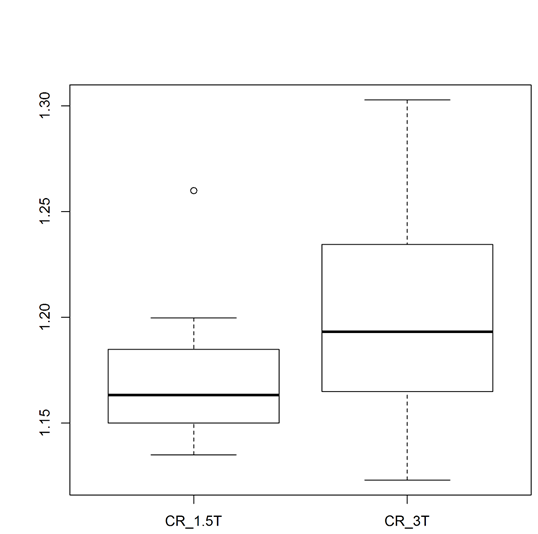
Fig. 5. Box-and-whisker plot for Contrast Ratio in the SN
Contrast ratio (CR) distributions in the SN at 1.5T and 3T. No significant difference was found although the median CR tended to be lower at 1.5T.