1936
Brain Motor Asymmetry in PD using Positron Emission Tomography and Diffusion Tensor ImagingDan Stein1, Natalia Goldberg1, Liran Domachevsky 1, Hanna Bernstine1,2, Meital Nidam1, David Groshar1, Mordechai Lorberboym 1,3, Simon Israeli-Korn 4, Moshe Gomori5, Yaniv Assaf6, and Sharon Hassin-Baer2,7
1Assuta Medical Center, Tel-Aviv, Israel, 2Sackler Faculty of Medicine, Tel Aviv University, Tel-Aviv, Israel, 3Tel-Aviv University, Tel-Aviv, Israel, 4Movement Disorders Institute, Sagol Neuroscience Center and Department of Neurology, Chaim Sheba Medical Center, Tel Hashomer, Tel-Aviv, Israel, 5Department of Radiology, Hadassah-Hebrew University Medical Center, Jerusalem, Israel., Jerusalem, Israel, 6Sagol School of Neuroscience, Tel Aviv University, Tel-Aviv, Israel, 7Movement Disorders Institute, Sagol Neuroscience Center and Department of Neurology, Chaim Sheba Medical Center, Tel Hashomer, Israel, Tel-Aviv, Israel
Synopsis
The accuracy of clinical diagnosis of Parkinson disease is currently not satisfying, particularly in early Parkinson disease where clinical signs are not yet fully present. Imaging nigral structures has been proposed as a biomarker for PD but fails to provide effective differential diagnosis. In this study we compared motor brain regions between hemispheres in patients with asymmetrical motor symptoms using voxel based analysis and network analysis and have found significant regional differences between the more and less affected hemispheres as well as connectivity differences in frontal and cerebral regions as the main hubs.
Introduction: PD (PD) is characterized by the classical "parkinsonian" motor features of rigidity, bradykinesia and tremor, associated with loss of dopaminergic neurons in the substantia nigra. However, the symptomatology of PD is heterogeneous, representing other areas and neurotransmitter system pathology. PD patients with asymmetrical presentation of the motor features suggest a more affected hemisphere (MAH) and a less affected hemisphere (LAH). The goal of this study was to compare motor areas between the two hemisphere in early asymmetrical motor disturbances in PD patients using 18F -DOPA uptake and DTI via voxel based morphometry (VBM) analysis and network connectivity analysis. Methods: Fourteen patients with idiopathic PD according to the UK Brain Bank criteria (age 60.87±7.35, 3.33± 2.23 years from onset of symptoms, not treated with levodopa) exhibiting persistent asymmetric motor signs from time of presentation, were included. Patients received 200 MBq of 18F -DOPA intravenously and were scanned using a 3T PET/ MR scanner. PET data was acquired simultaneously to DTI images using a spin-echo echo planar imaging sequence with a 2x2x2 mm resolution, b-value =1000 s/mm2 and 30 non-collinear directions. DTI images underwent whole brain constrained spherical deconvolution (CSD) and a network based statistical analysis produced structural connectivity maps. A paired t-test was performed between the more and less affected hemispheres generating a p-value matrix of connectivity for each subject. VBM was carried out for each patient, for both PET and DTI indices including correction for multiple comparisons. Results: Significant differences were demonstrated with VBM analysis between the more and less affected hemispheres in the basal ganglia, frontal regions, the thalamus and cerebral regions in both microstructure and metabolism via 18F-DOPA uptake (Fig. 1). Network analysis for FA provided significant differences between the two hemispheres in tracts between the cerebellum and the frontal areas, the cerebellum crus, the caudate and the thalamus (Fig. 2). Discussion: PD heavily impacts the motor system, thus asymmetry between more and less damaged hemispheres is expected. Despite the hemispheric variations, 18F-DOPA uptake and FA values both show close correlation between homologues regions in the two hemispheres (Fig. 1).The basal ganglia show an expected reduction in FA as well as in18F-DOPA uptake. However, our study has showed mixed results in the frontal motor areas where 18F-DOPA and FA were both higher with lower MD in the LAH only in the precentral gyrus. The other frontal motor regions all show surprising results of lower FA and 18F-DOPA in the LAH. One possibility is that the elastic brain optimizes function via compensatory mechanisms in the face of a slow progressing disease. The thalamus, involved in generating rest tremor, showed lower FA in the MAH, but did not show a significant metabolic difference. FA changes in the cerebellum region are in line with previous reports of lower FA and higher MD in PD patients compared with controls, however the lower 18F-DOPA uptake in the LAH is perhaps indicating that structural changes may precede metabolic changes both in the thalamus and cerebellum. Network analysis showed significant differences between hemispheres, primarily with cerebral involvement. The FA change in tracts connecting the cerebellum to the supplementary motor cortex strengthen the affect seen in the frontal cortex in the VBM, indicating again that frontal motor regions may be involved in a unique compensatory process in the initial stages of PD. Conclusion: As far as we know this is the first study to use diffusion tensor imaging and F-DOPA PET imaging simultaneously for comparing both hemispheres of PD patients with asymmetrical motor involvement. This study suggests a more complex picture of the initial onset and progression of PD than previously reported. In particular the differences between the motor areas of the two hemispheres within patients suggest that a detailed examination of motor areas may play an important role in the diagnosis and monitoring of PD.
Acknowledgements
We thank Zohar Nitzan, Inbal Machat and Hagay Baruch for excellent technical assistance in image acquisitions and Limor Shahrabani-Gargir for her dedicated patient management. In addition we thank the participants for their time and commitment to the research.References
No reference found.Figures
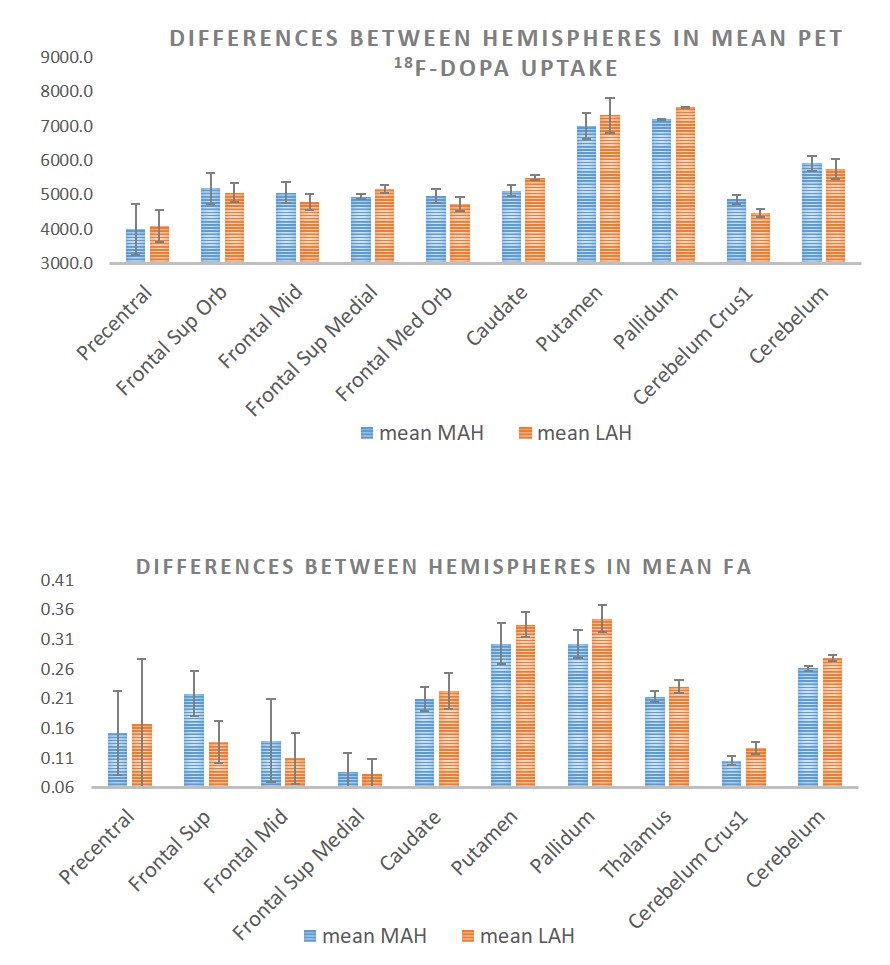
Figure 1: VBM Mean
differences between the LAH and the MAH in 18F –DOPA uptake and in FA.
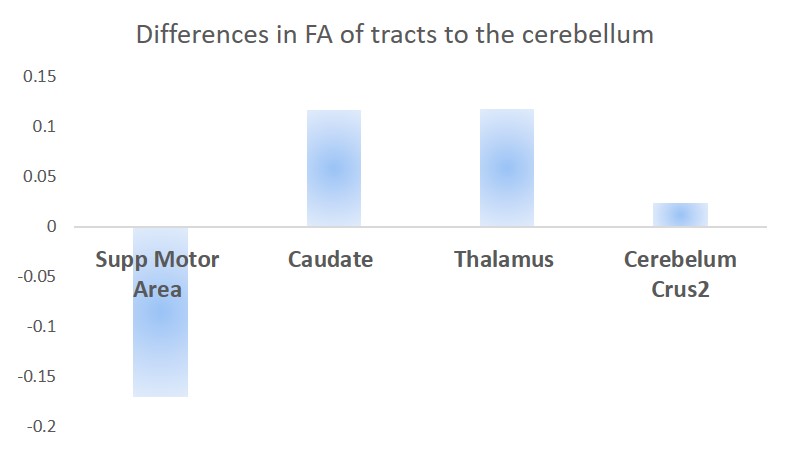
Figure. 2: Network
analysis mean differences between hemispheres in FA of tracts to the cerebellum.