1935
Studying the neural correlates of motor fatiguability in controls and people with Parkinson’s Disease1Radiological Sciences, Division of clinical neuroscience, University of Nottingham, Nottingham, United Kingdom, 2Sir Peter Mansfield Imaging Centre, University of Nottingham, Nottingham, United Kingdom, 3Division of Neurology, University of Nottingham, Nottingham, United Kingdom, 4Nottingham NIHR Biomedical Research Centre, University of Nottingham, Nottingham, United Kingdom
Synopsis
Fatiguability, an objective decline in the amplitude of movements during sustained or fast repetitive motor tasks, is one of the primary clinical features demonstrated in Parkinson’s disease (PD). However, our understanding of its underlying pathophysiology is still limited. Here, we propose a fMRI protocol to study the neuronal correlates of fatiguability and present preliminary data in PD and control subjects while performing sustained finger tapping. There was significant reduction of tapping-related activation in the primary motor cortex, somatosensory cortex, premotor cortex and middle frontal gyrus in the fatiguing vs. no-or-less fatiguing subgroups, suggesting that those regions were involved in fatigue.
Purpose
Fatiguability, a progressive decline in the amplitude of movements during sustained or fast repetitive motor tasks, is An obligatory criterion for the diagnosis of Parkinson’s disease (PD). However, our understanding of its underlying pathophysiology is still limited. Here, we propose a fMRI protocol to study the neuronal correlates of fatiguability and present preliminary data in people with PD and control subjects while performing sustained finger tapping.Methods
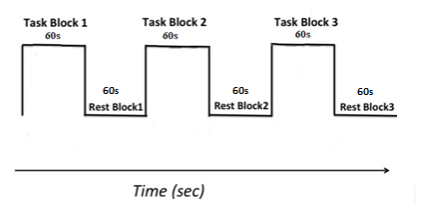
Participants: 18 medicated patients with idiopathic PD (age: mean±std, 66.40 ± 9.99 years; Male, 9; H&Y 1.47 ± 0.57) and 19 healthy participants (65.73 ± 8.59 years; Male, 11) were recruited. Disease severity was evaluated using the MDS-UPDRS (22.25 ± 16.27). Image acquisition: One high-resolution T1 structural scan and two motor task BOLD fMRI scans were performed using 3T GE MRI with a 32-channel head coil. The task paradigm is illustrated in figure1. Image analysis: Analysis was performed using the SPM8 toolbox. fMRI images were adjusted for motion correction and co-registered with individual T1 images. Normalization to MNI space and smoothing(5mm Gaussian kernel) were conducted. Images were flipped to keep the laterality consistent. First-level analysis was performed to locate individual task-dependent brain activation using a fixed-effect-boxcar design convolved with canonical haemodynamic response function based on general linear model. Second analysis were used to examine the disease effect on the motor task by comparing HC vs. PD. To study the fatiguability, we scored the behavioural data block-wise, allocating 1 point for each block with decreased TapR (response time as a function of number of taps was fitted linearly and positive slope indicated decreased TapR over time). We used a cut-off value of 4 to divide our participants into fatigue (F) (≥4/6) and no-or-less fatigue (NLF) groups (<4/6) (Demographics in Table1), followed by a F vs. NLF group comparison. Within the F group, HC vs PD was also compared for active>rest. IBM SPSS version 22.0 was used to perform statistical analysis for our behavioural data.
Results
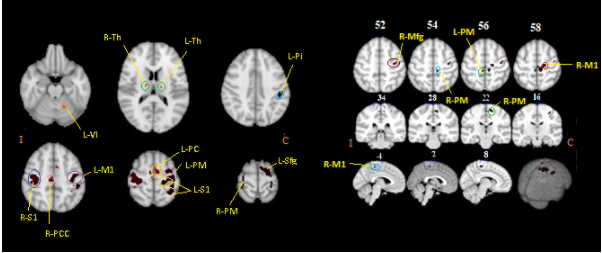
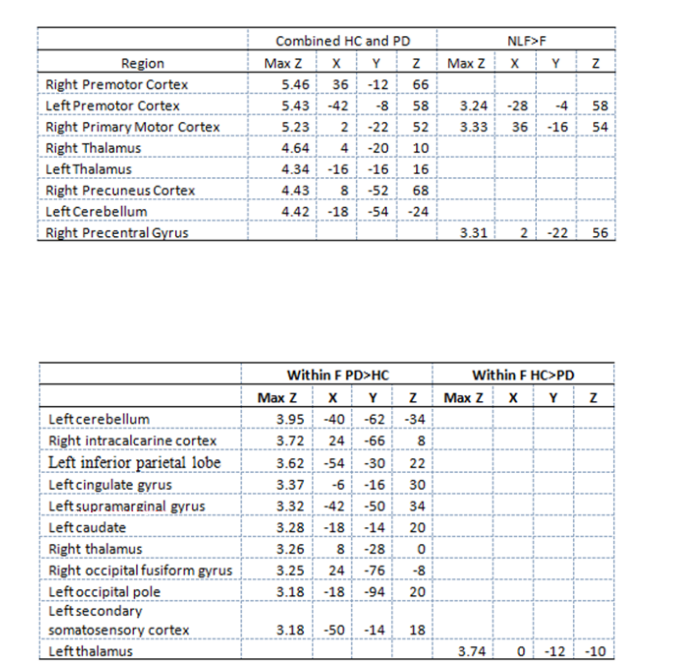
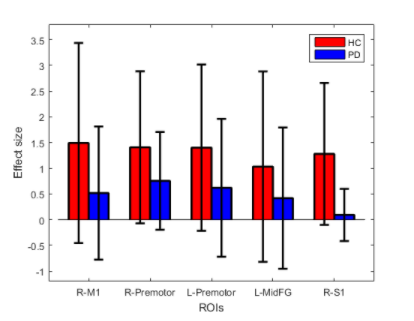
Behaviour: We found no significant difference in TapR between HC and PD, except HC showed a higher TapR in the last block. Changes of TapR was elaborated in Table1. F group (HC+PD) showed significant lower TapR compared to NLF for blocks2 (P=0.042) and 3 (P=0.00001). Motor fMRI: One dataset was excluded due to excessive motion, but comparable motion was revealed between PD and HC (p>0.05). No group difference of brain activation induced by motor task was demonstrated between HC and PD. Thus, we studied the neural effect of fatiguability by concatenating HC and PD to increase our statistical power. Figure2-left showed the effect of tapping across the two groups. Figure2-right illustrates the brain regions that showed higher activation in NLF compared to F. The effect size of the NLF vs. F in HC and PD, respectively after a post-hoc test of areas that were differentially less active in fatigue group(ROIs illustrated in Figure2-right) were shown in Figure4. Within F(active>rest) limiting to only the 3rd blocks, we found differential activation in the regions shown in Table2-2.Discussion
To our knowledge, this is the first study reporting on fatiguing motor task fMRI in PD. Our protocol elicited fatigue assessed as decreased TapR in a subgroup of controls and patients without a disease-specific effect. Our group-concatenated results showed motor-related regions consistent with previous studies. There was significant reduction of tapping-related activation in the contralateral M1, premotor cortex and S1, and ipsilateral premotor cortex and middle frontal gyrus in F vs. NLF subgroups. Similar regions showed increased activation following a sustained motor task in a recent study investigating central fatigue in multiple sclerosis(MS), suggesting that those regions were involved in fatigue, and yet, no MSvsHC was performed in that study(1). Our behavioural data demonstrated that PD TapR was significantly lower than HC in the third block, but surprisingly, we found hyperactivation in PD, which is likely attributed to sample-size difference, and possibly partially affected by medication effect. However, the difference may indicate the compensatory role of those regions. Another possibility of this hyperactivation might be that HC also fatigued, which could be due to use of their non-dominant hand. Future work will focus on the difference of temporal dynamics within blocks by considering early and later fatigue to increase the sensitivity of exploring the neural correlates of fatigue specific to disease, while controlling the hand dominance in the HC, with larger sample size.Conclusion
Our behavioural and preliminary imaging evidence suggest that our repetitive finger-tapping fMRI protocol may offer an objective technique to quantify fatiguability and pave the way for studying the neural correlates of motor fatigue.Acknowledgements
Yue Xing is funded by Parkinson's UK. Saadnah Naidu is funded by Michael J Fox Foundation for Parkinson's Research.References
Bonzano L, Pardini M, Roccatagliata L, Mancardi L, Bove M et al. How people with multiple sclerosis cope with a sustained finger motor task: A behavioural and fMRI study. Behav Brain Res. 2017; 63-71.Figures