1932
Sensorimotor resting-state functional connectivity at 7T: contrasting Huntington's and Parkinson's disease.1FMRIB Centre, WIN, University of Oxford, Oxford, United Kingdom, 2NDCN, University of Oxford, Oxford, United Kingdom
Synopsis
This preliminary study aims to explore high-resolution functional sensorimotor connectivity using resting-state fMRI in healthy controls (HC), Parkinson's (PD) and Huntington's (HD) disease patients. This 7T study therefore includes subjects showing all three states of the basal ganglia inhibitory function. Group ICA and dual regression analyses identified 2 sensorimotor networks: one in which PD and HD showed the same lower cortical connectivity pattern compared with HC in M1 (face area), but opposite pattern in the subthalamic nucleus; and another in which PD and HD showed opposite pattern in M1 and S1 (hand area). This demonstrates the capacity of 7T rs-fMRI to identify with remarkable detail meaningful differences between these two movement disorders.
Introduction
Key discoveries in animal studies have recently challenged the established model of the basal ganglia connections and their involvement in Parkinson's and Huntington's disease (PD, HD). However, conventional human MRI studies (1.5T or 3T) lack the resolution and contrast to study all of the basal ganglia structures.
State-of-the-art 7T MRI imaging makes it possible to directly identify and distinguish the smaller subcortical structures, such as the substantia nigra (SN), subthalamic nucleus (STN), globus pallidus internus (GPi) and externus (GPe).
This preliminary 7T study aims to explore sensorimotor connectivity, including in these structures, using resting state functional MRI in healthy controls (HC), PD and HD patients, therefore including in the same MRI study subjects showing all three states of the basal ganglia inhibitory function: normal (HC), increased (PD) and decreased (HD).
Methods
* Acquisition:
Scans were acquired on a Siemens Magnetom syngo B17 7T MRI scanner, using a 32-channel head coil.
Structural: T1 (0.9x0.9x0.9 mm) + PD (proton density, 0.9x0.9x0.9 mm).
Diffusion: Two sessions AP and PA/ blip-up and blip-down, 64 directions, 1.2x1.2x1.2 mm, TE=68.2ms, TR=5382ms, flip angle 90°, multiband factor 2.
Resting state functional MRI: rsfMRI, 7 minutes, 14 seconds, 1.2x1.2x1.2 mm, TE=25 ms, TR=1853 ms, flip angle 40°, multiband factor 4.
* Preprocessing in FSL:
Structural: After rigid registration, T1 was divided by PD to enhance CNR, then GM-segmented.
Diffusion: Diffusion data was registered and unwarped using EDDY and TOPUP.
Resting state functional MRI: Resting state data was motion corrected using MCFLIRT, unwarped using fieldmaps calculated from a set of blip-up blip-down b0 images (see above), brain extracted, "denoised" using manually classified single subject ICA based cleaning and smoothed at 3mm FWHM.
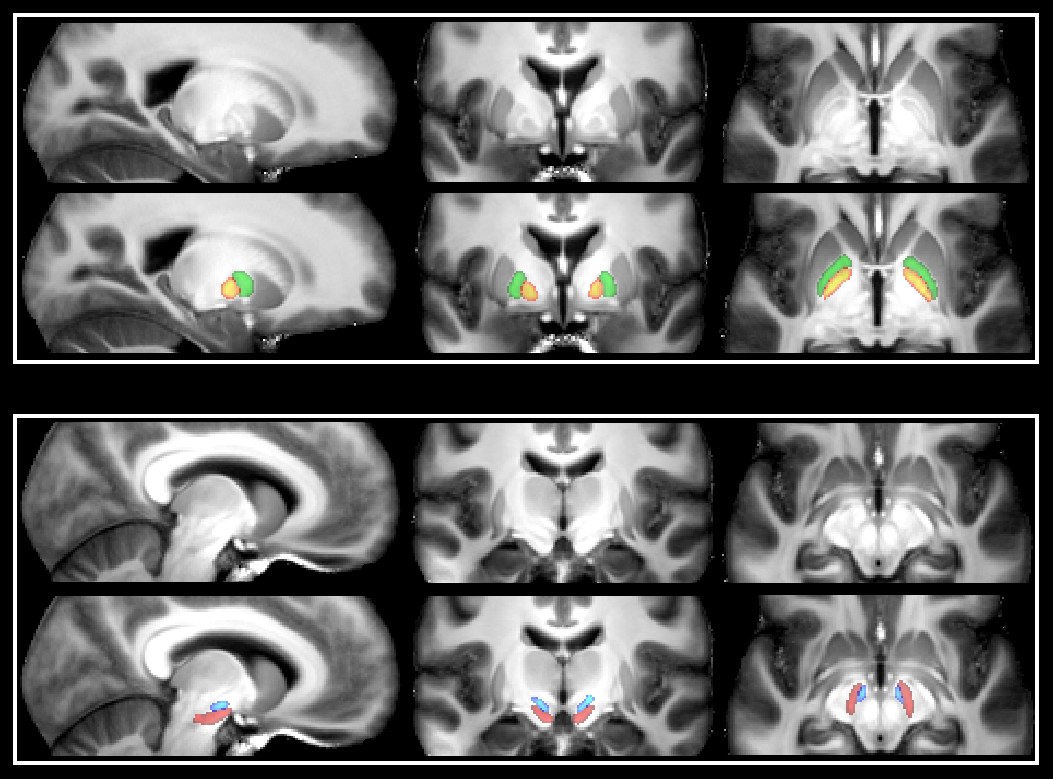
* Identification of the basal ganglia structures:
This
was done for each participant using MIST, a multi-modal automatic segmentation
tool. Each ROI was then manually inspected and corrected if needed
(caudate, putamen, ventral striatum, thalamus and globus pallidus). GPe
and GPi were further delineated using the T1/PD scan for each
individual, as there is a clear distinction between the two structures
on these scans (Figure 1). SN and STN were directly identified on the EPI for each
subject, as the contrast and resolution made it possible to distinguish
the two in these scans.
* Participants:
12 presymptomatic or very early stage HD participants (8 preclinical, 4 stage I), mean age: 40±11
16 very early stage PD patients (2 unmedicated, 14 H&Y 1, 2 H&Y 2 including one unmedicated). Those medicated were asked to withhold medication on the morning of the scan (last medication taken as normal before sleep). Mean age: 59±8
24 HC, matched in age to both HD and PD participants, mean age: 45±17
* Functional connectivity group comparison:
Preprocessed
functional images were registered to a study specific template in MNI
space using an optimised, unbiased VBM approach (using GM segmentation
from T1/PD scans).
Group
level ICA was run to extract data-driven resting-state
networks.
Dual
regression was then performed to obtain subject specific timeseries and
voxelwise spatial maps associated with each network. In addition, we used the hand drawn individual masks of GPe, GPi, SN and
STN (co-registered to each standard individual space) to extract the mean connectivity values. Age was regressed out from both voxelwise and ROI analyses.
Results and Conclusions
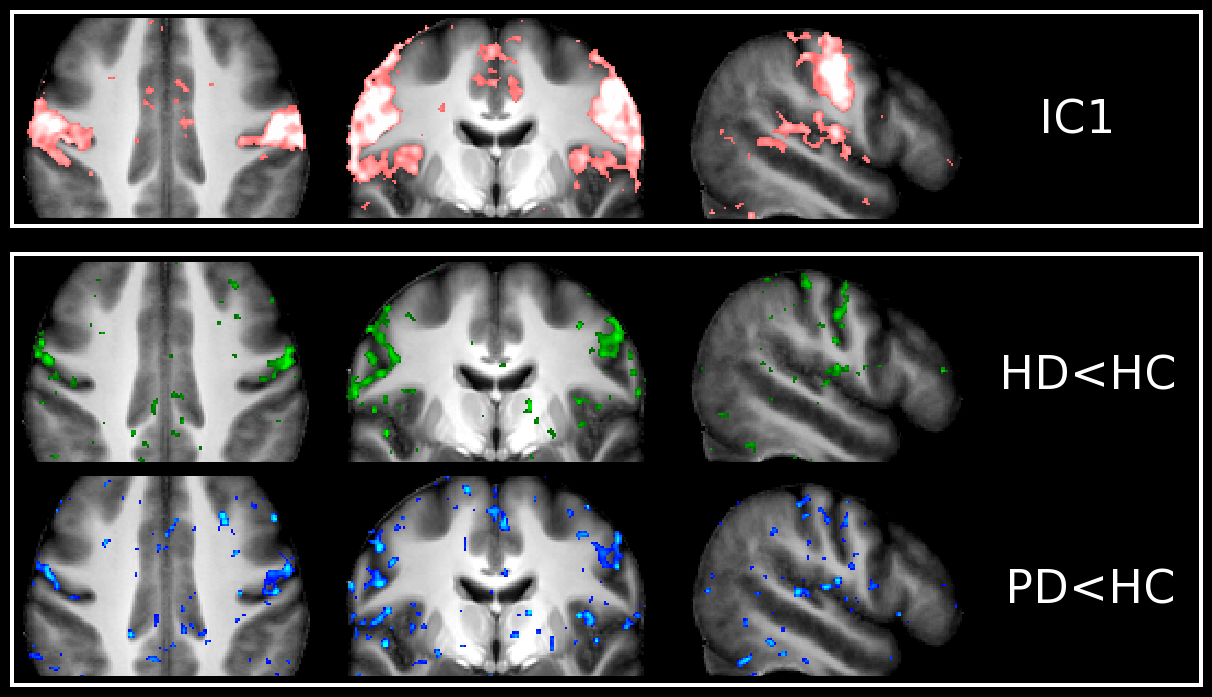
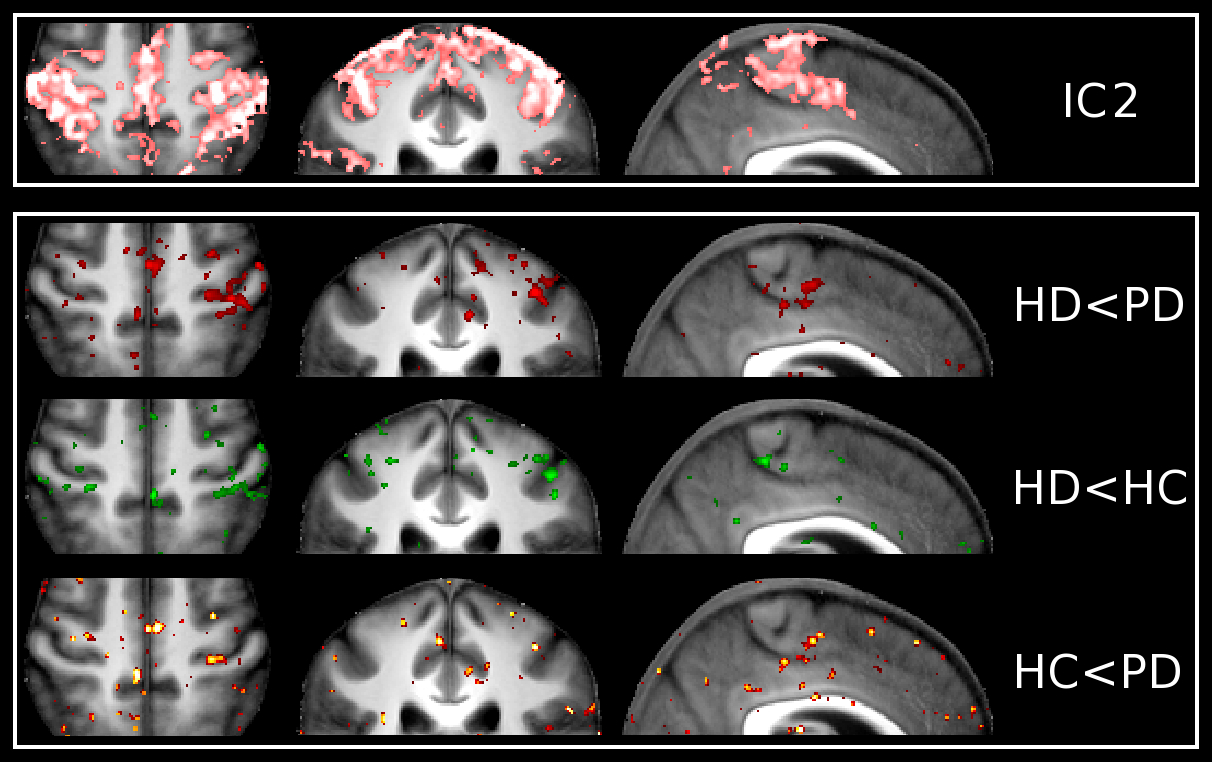
Unbiased group ICA (d=30) yielded 9 ICs which were clear signal networks. For the purpose of this preliminary study, we focused on the 2 sensorimotor networks identified (Figures 2 and 3). IC1 described the lateral primary motor cortex, from the face area down to more ventral regions. IC2 described regions which encompassed both the primary somatosensory and motor cortex, as well as premotor regions, all more dorsal to IC1(from hand area up to more dorsal and medial regions).
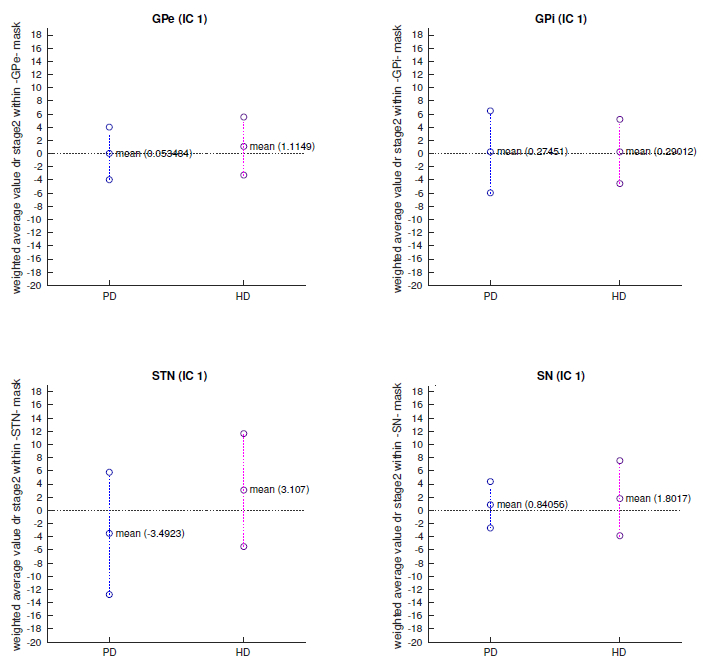
In IC1, the (pre)HD group showed a reduction of functional connectivity clearly following M1 around the face area compared with HC. PD roughly presented the same pattern. Our additional ROI analysis also revealed a trend for lower connectivity values in the STN of PD patients, compared with higher values in the HD participants (p<0.1, Figure 4).
In IC2 however, HD and PD group showed opposite patterns in the primary sensorimotor cortex around the hand area, with HD demonstrating lower connectivity compared with HC, but PD showing higher connectivity. This contrast seemed to be more pronounced on the left hemisphere (not formally tested).
These are very preliminary results, but they illustrate clearly the capacity of 7T rsfMRI to identify with remarkable detail differences in sensorimotor functional connectivity in HD and in PD, but also crucially between these two contrasting movement disorders.
Acknowledgements
GD acknowledges funding for this work11 from the Medical Research Council UK (MR/K006673/1). We are grateful to Mark Jenkinson, Eelke Visser and Eugene Duff for advice on tissue segmentation, automatic subcortical segmentation and resting-state analysis.References
Figures