1930
Disrupted Functional Connectivity and Network Topology in Early Parkinson’s Disease1Cleveland Clinic Lou Ruvo Center for Brain Health, Las Vegas, NV, United States, 2University of Colorado Boulder, Boulder, CO, United States, 3Muhammad Ali Parkinson Center at Barrow Neurological Institute, Phoenix, AZ, United States
Synopsis
Imaging biomarkers that reliably capture the impact of the spreading pathology of Parkinson’s disease (PD), including its impact on both white and graymatter, remain elusive. In this study, we applied graph-theoretical techniques to multi-site resting-state fMRI data from a cohort of unmedicated early PD-subjects in Parkinson’s Progressive Markers Initiative (PPMI) database. Altered functional connectivity and disrupted topological brain organization was seen in early PD-subjects. Our study opens new avenues to understanding disease progression and severity of PD from graph-theoretical approach.
Introduction
Parkinson's disease (PD) is a progressive movement disorder of the central nervous system, which is characterized by altered motor and non-motor aspects of function. Imaging biomarkers that capture the impact of this spreading pathology in both white and gray matter remain elusive [1, 2]. Graph theoretical approaches have the ability to characterize connectivity at both global and local levels and can provide useful information about functional organization of the brain [3]. Several studies have reported altered topology of brain function in patients with PD [4, 5], but this has not been validated in unmedicated patients nor in a multi-site cohort of early PD-subjects to the best of our knowledge. Hence, we applied graph theoretical approaches to resting-state functional MRI data from Parkinson’s Progressive Markers Initiative (PPMI) database to determine how the functional network is altered in early stages of PD prior to receiving medication.Methods
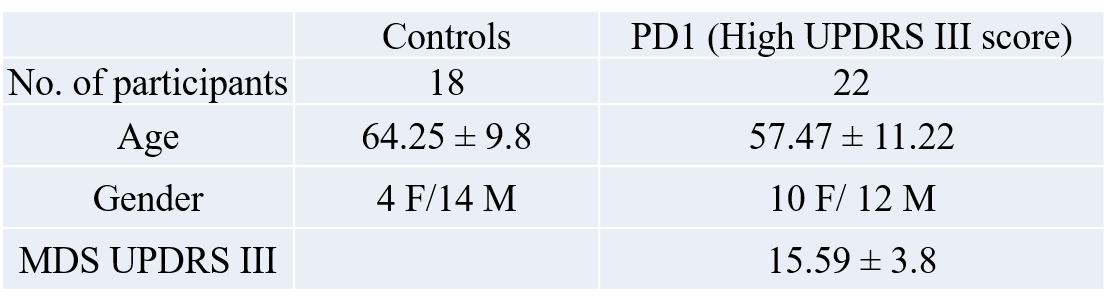
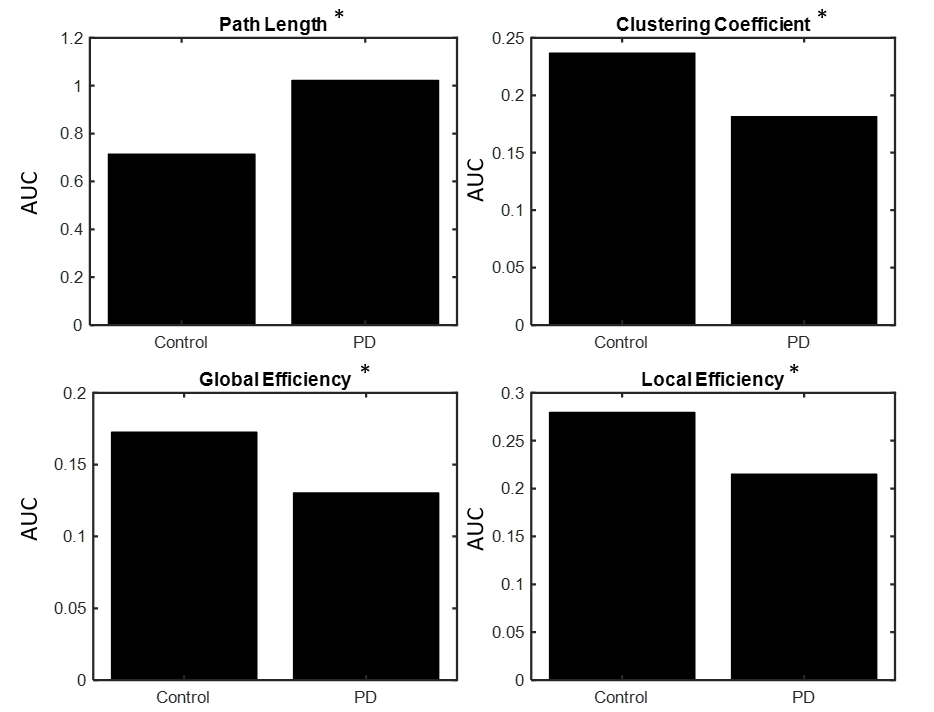
The data used in the preparation of this article were obtained from the Parkinson’s Progression Markers Initiative (PPMI) database (www.ppmi-info.org/data). For up-to-date information on the study, visit www.ppmi-info.org. Functional-MRI data for 18 healthy controls and 22 unmedicated PD-subjects were obtained from the PPMI database (see Table 1 for demographics). Imaging parameters are described in detail at http://www.ppmi-info.org/. After standard preprocessing, mean time series were obtained from 90 ROIs based on the AAL atlas (excluding cerebellum and vermis). The connectivity between two ROIs was estimated using Pearson’s correlation between their averaged time-series, and subsequently a connectivity matrix (90 x 90) was obtained for each subject. Two-sample t-tests were used to compare the functional connectivity between the two groups regressing out age. Pathlength (Lp), clustering coefficient (Cp), Global (GE) and local efficiency (LE), were computed for each subject at various sparsity thresholds (S 0.05-0.4, ∆S=0.01). Graph theory measures were obtained using GRETNA toolbox [6]. Nodal measures of GE, LE, Lp, and Cp were extracted at a sparsity at which the network was fully connected for both groups [7]. Two-sample t-tests with age as covariate were used to see if area under the curve for any of the above metrics were significantly different between the two groups.Results
Fig. 1 shows the paths that were significantly greater in controls when compared to the PD group. We found 11 connections that were significantly (p<0.01) greater in controls compared to the unmedicated PD, primarily comprising the pallidum, frontal superior orbital gyrus, superior and inferior temporal gyrus and few other regions. Results were visualized with the BrainNet Viewer (http://www.nitrc.org/projects/bnv/) [8]. There were no paths with greater connectivity in the PD group compared to controls. Fig. 2 and Fig. 3 show the graph theory results. The evaluation of the AUC values revealed significantly (p<0.05) lower Lp (Fig. 2a) and higher Cp (Fig. 2b) in the control group when compared to PD. Nodal analysis revealed no nodes with a longer Lp in controls and no nodes with higher Cp in PD (Fig.3a & Fig. 3b). Nodes with higher Lp in PD were located at olfactory cortex, hippocampus, inferior parietal lobule and superior temporal gyrus. (Fig.3a). Nodes with higher Cp in controls were located at frontal mid orbital, olfactory, hippocampus, middle occipital gyrus, fusiform gyrus, superior and inferior parietal cortex (Fig.3b). The area under the curve for GE (Fig. 2c) and LE (Fig. 2d) were significantly (p<0.05) greater in the controls when compared to the PD group. Nodal comparisons of GE and LE revealed several nodes that showed significantly higher global and local efficiency in controls when compared to the PD group (Fig.3c and Fig.3d).Discussion
The current study revealed altered functional connectivity and topological properties of networks in unmedicated early PD. Our results show decreased functional connectivity in the PD group when compared to controls between regions known to be implicated in PD, but importantly these differences were detected using an unbiased whole-brain approach. Furthermore, PD group showed reduced Cp, GE, and LE, and increased Lp, when compared to controls. These observations point to a shift toward a disrupted network topology with altered integration and segregation.Conclusion
Graph theoretical study of early PD subjects revealed disrupted topological organization in PD subjects. These findings expand upon prior such investigations in that 1) overall functional connectivity reduction is recapitulated, 2) connectivity is impaired in both integration and segregation in PD pathologic ROIs, and 3) these findings are evident in newly diagnosed unmedicated patients with only mild disease severity and avoiding a priori ROI assumptions by using a whole-brain unbiased approach, validating this approach in PD.Acknowledgements
This study was partially supported by the NIH COBRE grant 1P20GM109025-01A1 and the Elaine P Wynn and Family Foundation. The Michael J. Fox Foundation supports the PPMI study for Parkinson’s Research. Other funding partners include a consortium of industry players, non-profit organizations and private individuals.References
[1] Hall JM, Ehgoetz Martens KA, Walton CC, et al. Diffusion alterations associated with Parkinson’s disease symptomatology: A review of the literature. Parkinsonism Relat Disord 2016; published online Sept. DOI:10.1016/j.parkreldis.2016.09.026.
[2] Pyatigorskaya N, Gallea C, Garcia-Lorenzo D, Vidailhet M, Lehericy S. A review of the use of magnetic resonance imaging in Parkinson’s disease. Ther Adv Neurol Disord 2014; 7: 206–20.
[3] Bullmore E, Sporns O. Complex brain networks: graph theoretical analysis of structural and functional systems. Nat Rev Neurosci 2009; 10: 186–98.
[4] Baggio, H.-C., Sala-Llonch, R., Segura, B., Marti, M.-J., Valldeoriola, F., Compta, Y., Tolosa, E. and Junqué, C. (2014), Functional brain networks and cognitive deficits in Parkinson's disease. Hum. Brain Mapp., 35: 4620–4634. doi:10.1002/hbm.22499
[5] Luo CY, Guo XY, Song W, Chen Q, Cao B, Yang J, Gong QY, Shang HF. (2015), Functional connectome assessed using graph theory in drug-naive Parkinson's disease. J. Neurol. 262(6):1557-67. doi: 10.1007/s00415-015-7750-3.
[6] Wang J, Wang X, Xia M, Liao X, Evans A and He Y (2015), GRETNA: a graph theoretical network analysis toolbox for imaging connectomics. Front. Hum. Neurosci., 30 June 2015 | http://dx.doi.org/10.3389/fnhum.2015.00386
[7] He Y, Chen Z, Evans A. Structural insights into aberrant topological patterns of large-scale cortical networks in Alzheimer’s disease. J Neurosci 2008;28: 4756–66.
[8] Xia M, Wang J, He Y (2013) BrainNet Viewer: A Network Visualization Tool for Human Brain Connectomics. PLoS ONE 8(7): e68910. doi:10.1371/journal.pone.0068910
Figures