1927
Characterizing Neuronal Loss To Differentiate Parkinsonian Subtypes Using Automated Deep Grey Nuclear Volumetry1National Neuroscience Institute, Singapore, Singapore, 2Advanced Clinical Imaging Technology, Siemens Healthcare AG, Lausanne, Switzerland, 3Department of Radiology, CHUV, Lausanne, Switzerland, 4LTS5, EPFL, Lausanne, Switzerland, 5Singapore General Hospital, Singapore, Singapore, 6Nanyang Technological University, Singapore, Singapore, 7Siemens Healthcare, Singapore, Singapore, 8Duke-NUS Medical School, Singapore, Singapore
Synopsis
Postural Instability Gait Disorder (PIGD), a Parkinson's Disease (PD) motor subtype, progresses rapidly with a higher prevalence of neurobehavioural changes. Using automated deep grey nuclear tissue classification combined with atlas-based segmentation, we investigated the performance of resulting estimated lesion load to aid differential diagnosis. Caudate lesion load in PIGD and idiopathic PD subtypes correlated with clinical balance and gait assessment. Combining caudate with abnormal white matter volumetric characterization further improved the discriminative power and could potentially support differential diagnosis of PD.
Introduction
Clinically heterogeneous Parkinson’s Disease (PD) phenotypes suggest complex underlying microstructural alterations involving multiple brain regions and different networks1-4. Pathological changes are not limited to the substantia nigra, and also extend beyond the extrapyramidal areas3,4. Focal grey matter (GM) lesions within the basal ganglia and iron deposition contribute to the pathophysiology of Parkinsonism5-9. Various brain morphometric studies reported cortical GM atrophy with cognitive decline in PD8,9. However, few studies have examined deep GM changes and relevance to motor dysfunction across PD subtypes such as Postural Instability Gait Disorder (PIGD). Using automated deep GM tissue classification combined with atlas-based segmentation , we evaluated the performance of resulting estimated lesion load to differentiate PD and PIGD subtypes as well as its clinical correlates.Methods
Whole-brain MR imaging was performed at 3T (MAGNETOM Trio, Siemens Healthcare, Erlangen, Germany) on a case-control cohort of 66 subjects (25 PIGD, 21 PD, and 20 age-matched healthy controls (HC)). Automated segmentation was performed on MPRAGE images (TR/TI 2200/900ms; 240mm FOV; 256x256 matrix; 0.9mm slice thickness; 192 slices) using the MorphoBox prototype10, 11. Novel GM abnormality (GMab) volumes in each deep grey nucleus were obtained by summing up CSF a posteriori probabilities over the corresponding masks obtained by atlas propagation. White matter abnormalities (WMab) were detected by thresholding the difference between the posterior and prior probability maps10, according to a constant value of 0.6. Segmentation quality was reviewed using ITK-Snap12 by two of the authors trained in neuroanatomical landmarks, in correlation with corresponding T2-FLAIR images and clinical neuroradiological reports. Hence, two PIGD patients were excluded due to significant misclassification of GM lesions in the basal ganglia. Statistical analysis was performed using R 3.4.113 (significance level of 0.05). Unless otherwise indicated, regional brain volumes are expressed and analysed as a percentage of total grey and white matter to correct for global brain atrophy. Kruskal–Wallis test with Bonferroni-corrected pairwise comparisons was used to assess significant differences between brain volumetry and clinical parameters across subgroups. Subsequently, a multivariate regression model, controlled by age and gender, was utilized to assess the relationship between estimated volumetry and clinical scores. Additionally, discriminative reliability was determined using receiver operating characteristics (ROC) analysis.Results
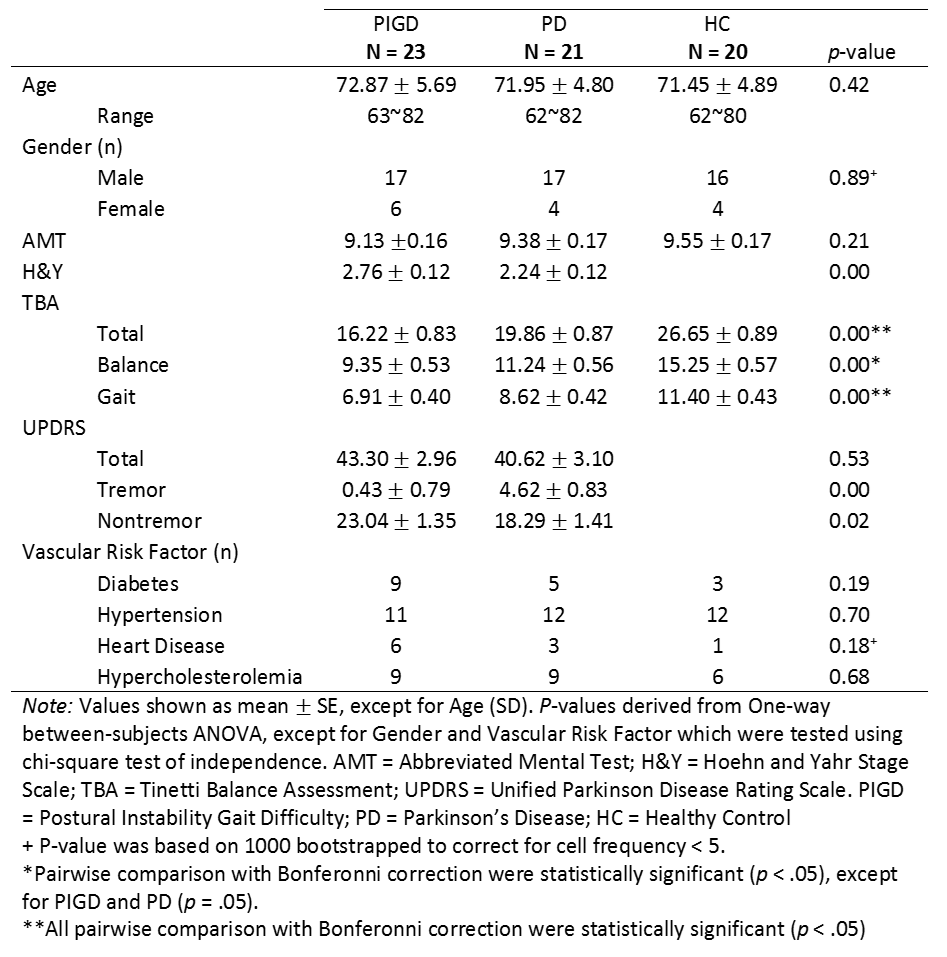
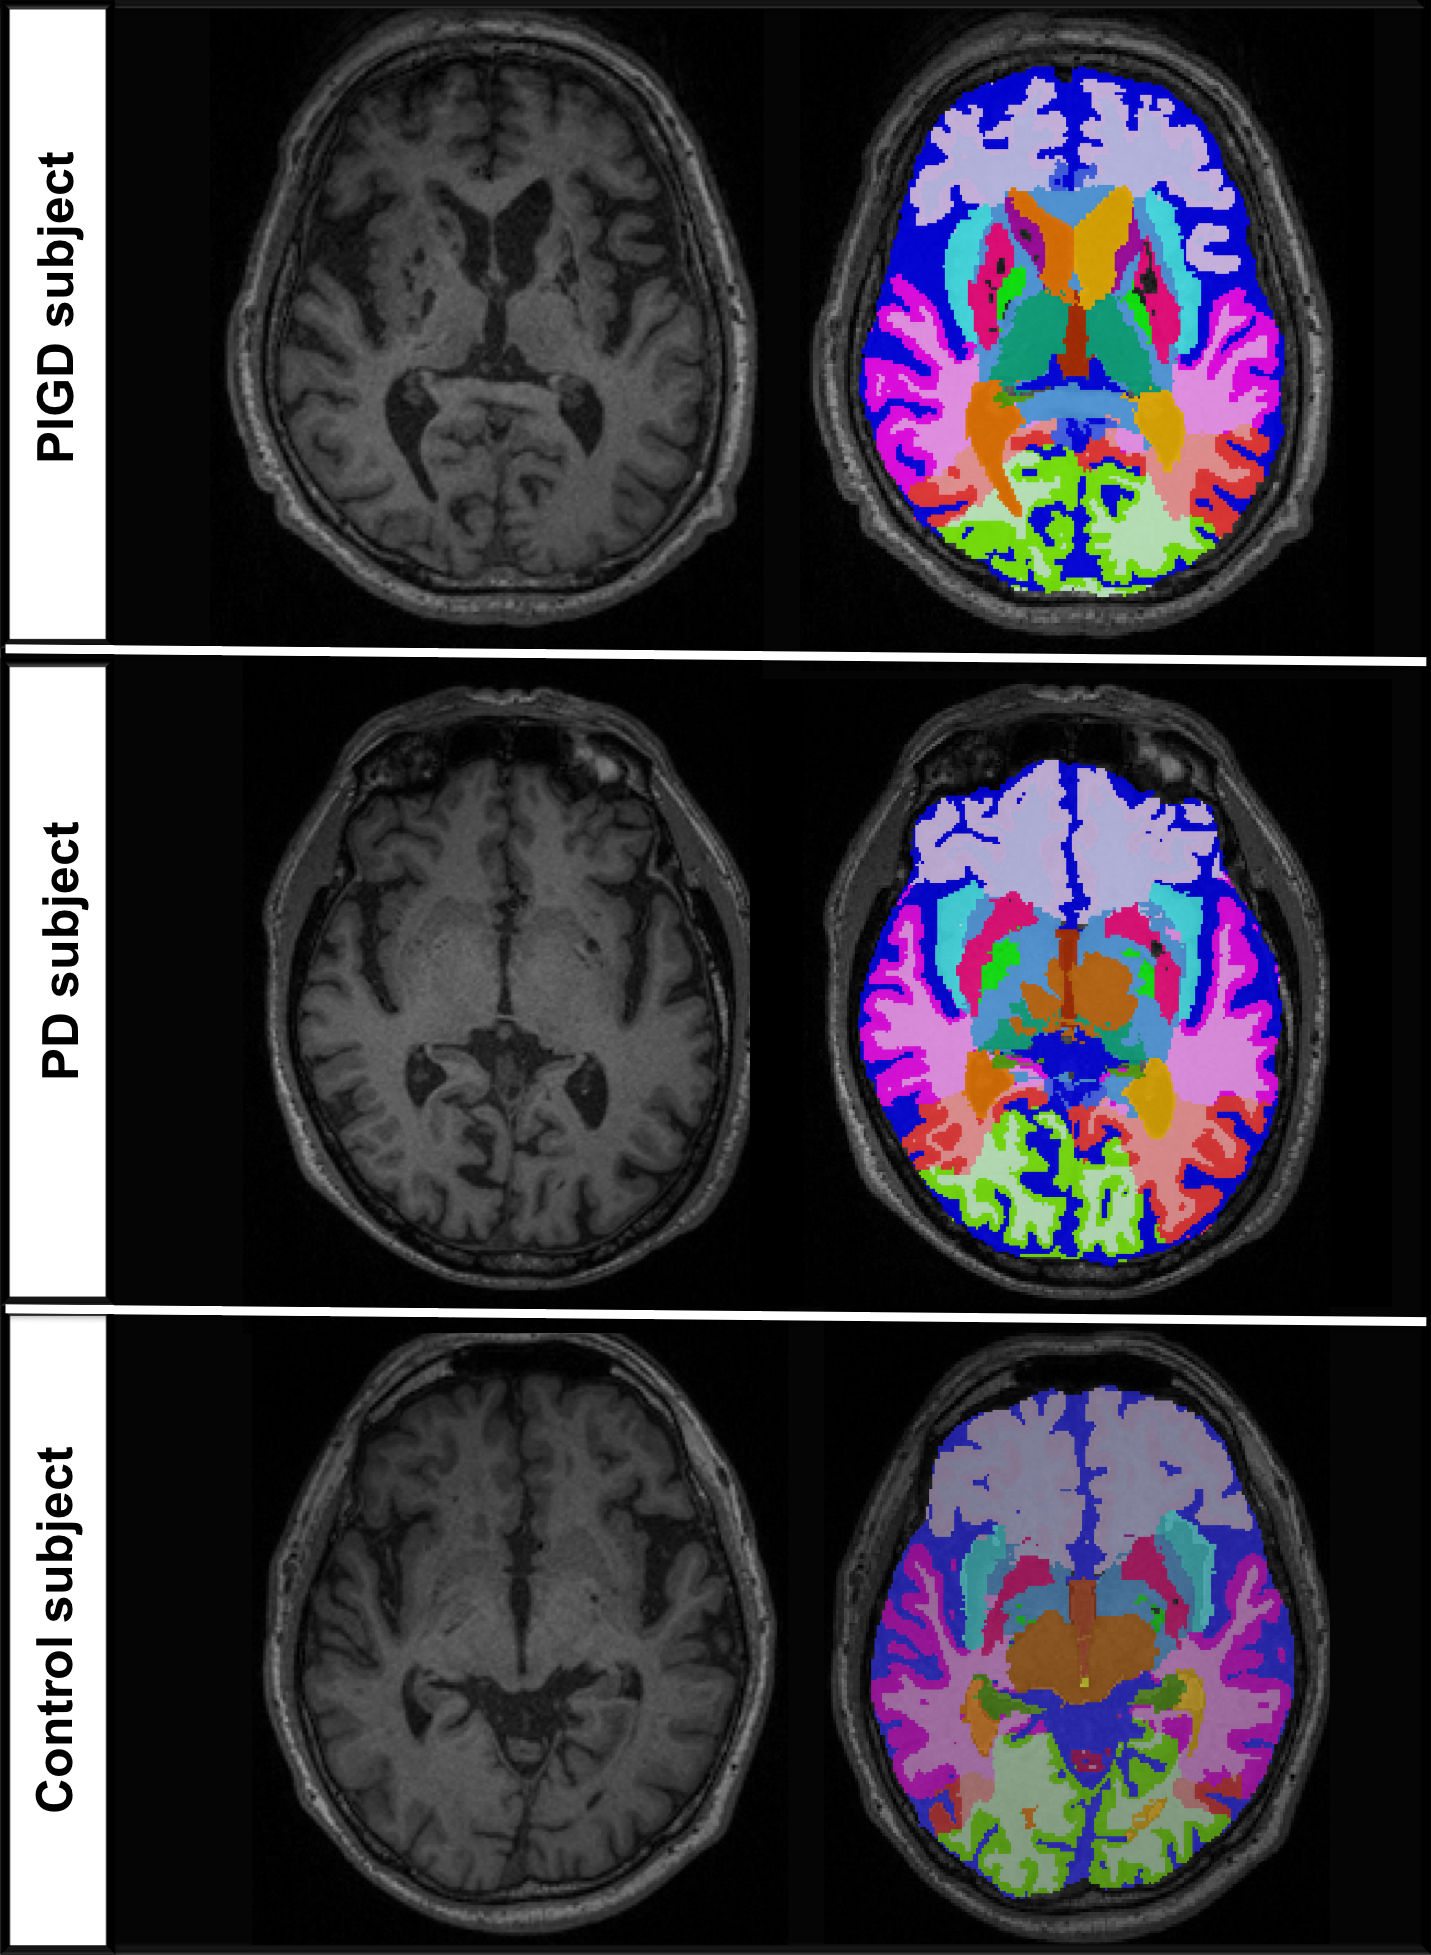
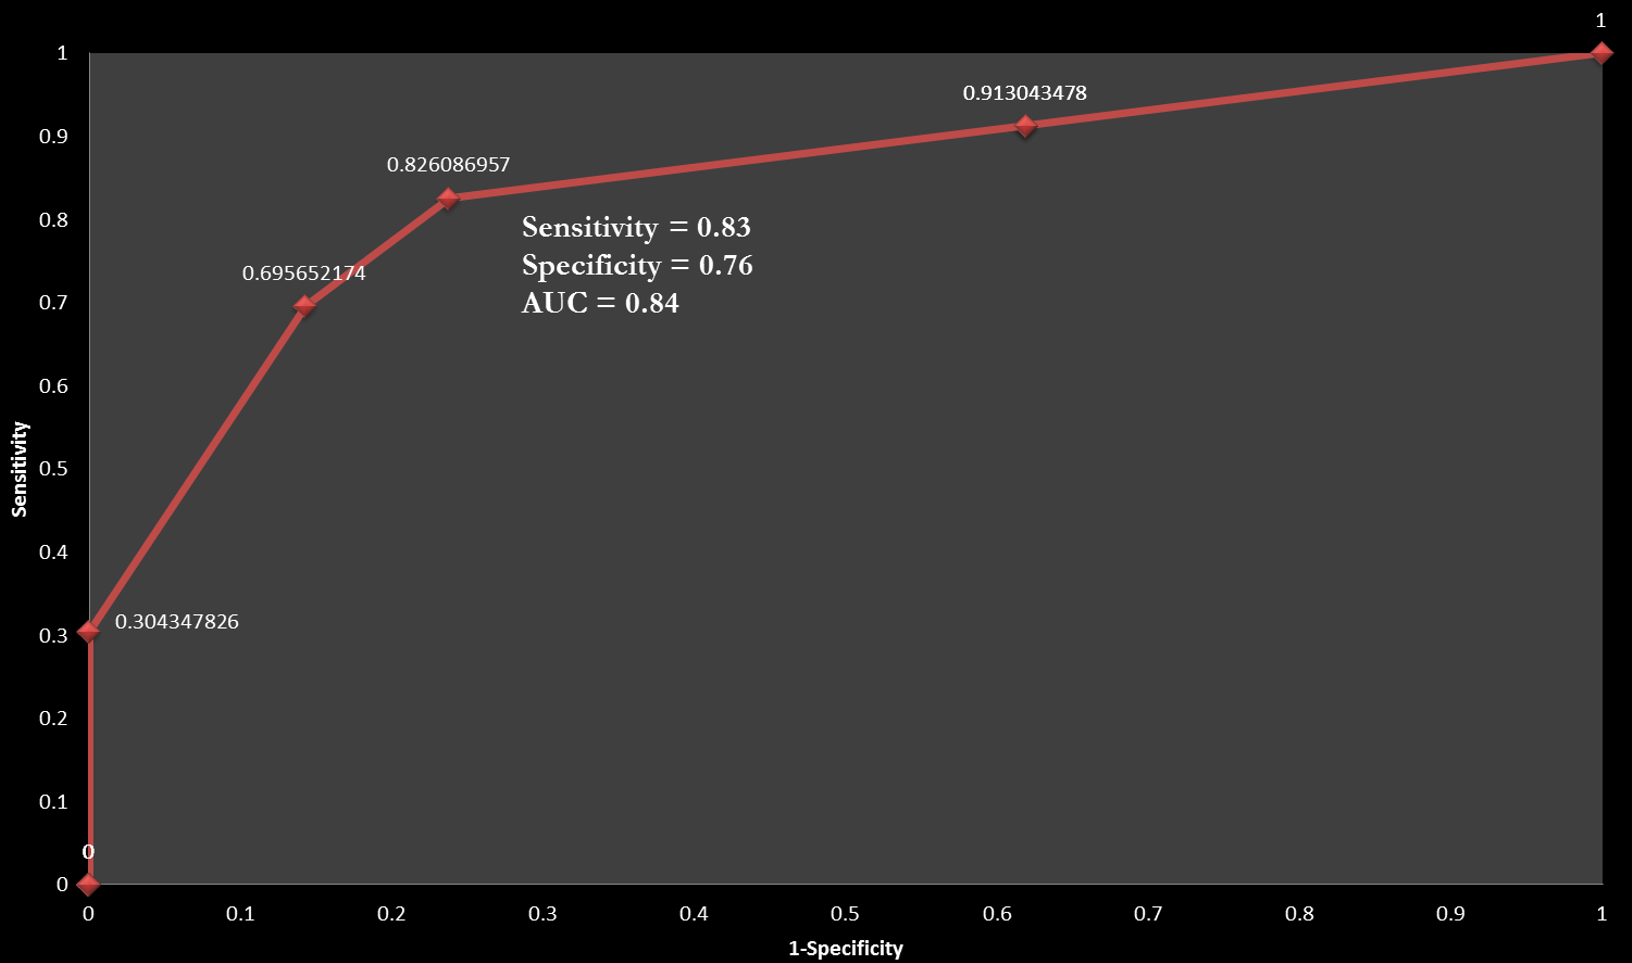
Subject demographics and clinical measures are summarized in Table 1. Caudate GMab (p<.01), thalamus GMab (p<.05), abnormal WM (p<.01), and ventricular (p<.05) relative volumes were significantly higher in PIGD, compared to PD and HC (see exemplary segmentation results in Figure 1). Reduced GM% in caudate and thalamus was noted in PIGD compared to both PD (p<.05) and HC (p<.05). Stepwise regression showed that caudate GMab significantly predicted Tinetti Balance Scale scores (b=3.93, t(58)=2.450, p= .017). ROC analysis of selected composite volumetry incorporating caudate GMab, caudate GM and WMab discriminated PIGD from PD with sensitivity=0.83 and specificity=0.76 (AUC=0.84, see Figure 2).Discussion
Periventricular WM abnormalities on MRI are more prevalent8 and correlate with severity of gait imbalance14 in PIGD than in PD and controls. These manifest as significantly abnormal WM relative volumes in our PIGD subgroup. Our findings of reduced GM% (GM atrophy) in both caudate and thalamus reflect dominant neuronal loss in key relay nuclei of the nigrostriatal pathway in PIGD, and likely pathological loss of caudate dopaminergic terminals and pallidal neurons in advanced PD15, 16. Our novel estimation of lesion load (GMab) revealed differential deep nuclear involvement and improved discriminative power in the ROC analysis, suggesting GMab as a better measure of nigrostriatal pathway disruption than relative GM% volumetry in PIGD. There is potential application and validation of this novel GMab volumetric measure in other neurological disorders affecting the basal ganglia. Further research is needed to investigate how periventricular WM lesions and caudate abnormalities increase disruption to the neuromodulator projection systems and have a greater adverse impact on clinical motor scores.Conclusion
Automated deep grey nuclear volumetry helped identifying differential neuronal loss in key relay nuclei and WM circuitry, discriminated PIGD from PD subtypes, and correlated with clinical balance assessment. The speed and unbiased discriminatory power of automated brain morphometry makes it a powerful complement to clinical assessments and may support diagnosis and stratification of PD patients into relevant subtypes for better disease management.Acknowledgements
* equal contributions
We thank the National Medical Research Council and Siemens Healthcare for their support.
References
1. Burn DJ, Rowan EN, Allan LM, Molloy S, O’Brien JT, McKeith IG. Motor subtype and cognitive decline in Parkinson’s disease, Parkinson’s disease with dementia, and dementia with Lewy bodies. Journal of Neurology, Neurosurgery, and Psychiatry. 2006;77(5):585-589. doi:10.1136/jnnp.2005.081711.
2. Hutchinson M, Raff U. Structural Changes of the Substantia Nigra in Parkinson's Disease as Revealed by MR Imaging. American Journal of Neuroradiology. April 1, 2000 2000;21(4):697-701.
3. Nagae LM, Honce JM, Tanabe J, Shelton E, Sillau SH, Berman BD. Microstructural Changes within the Basal Ganglia Differ between Parkinson Disease Subtypes. Frontiers in Neuroanatomy. 2016;10:17. doi:10.3389/fnana.2016.00017.
4. Henderson JM, Carpenter K, Cartwright H, Halliday GM. Loss of thalamic intralaminar nuclei in progressive supranuclear palsy and Parkinson's disease: clinical and therapeutic implications. Brain. 2000;123(7):1410-1421.
5. Graham JM, Paley MNJ, Grünewald RA, Hoggard N, Griffiths PD. Brain iron deposition in Parkinson's disease imaged using the PRIME magnetic resonance sequence. Brain. 2000;123(12):2423-2431.
6. Bhatia KP, Marsden CD. The behavioural and motor consequences of focal lesions of the basal ganglia in man. Brain. 1994;117(4):859-876.
7. Wang J-Y, Zhuang Q-Q, Zhu L-B, et al. Meta-analysis of brain iron levels of Parkinson’s disease patients determined by postmortem and MRI measurements. Scientific Reports. 2016;6:36669.
8. Zhang J, Zhang Y-T, Hu W-D, Li L, Liu G-Y, Bai Y-P. Gray matter atrophy in patients with Parkinson’s disease and those with mild cognitive impairment: a voxel-based morphometry study. International Journal of Clinical and Experimental Medicine. 2015;8(9):15383-15392.
9. Jia X, Liang P, Li Y, Shi L, Wang D, Li K. Longitudinal Study of Gray Matter Changes in Parkinson Disease. American Journal of Neuroradiology. 2015;36(12):2219-2226. 1
10. Schmitter D, Roche A, Maréchal B, et al. An evaluation of volume-based morphometry for prediction of mild cognitive impairment and Alzheimer’s disease. NeuroImage : Clinical. 2015;7:7-17.
11. Maréchal B, Roche A, Kober T, et al. Automated evaluation of deep gray matter neuronal damage in multiple sclerosis patients. 25th meeting of the International Society of magnetic Resonance in Medicine, Honolulu, 2017
12. Paul A. Yushkevich, Joseph Piven, Heather Cody Hazlett, Rachel Gimpel Smith, Sean Ho, James C. Gee, and Guido Gerig. User-guided 3D active contour segmentation of anatomical structures: Significantly improved efficiency and reliability. Neuroimage 2006 Jul 1;31(3):1116-28.
13. R Core Team (2013). R: A language and environment for statistical computing. R Foundation for Statistical Computing, Vienna, Austria. ISBN 3-900051-07-0, URL http://www.R-project.org/.
14. Lee SJ, et al. The severity of leukoaraiosis correlates with the clinical phenotype of Parkinson's disease. Arch Gerontol Geriatr. 2009;49:255–259.
15. Kish SJ, Shannak K, Hornykiewicz O. Uneven Pattern of Dopamine Loss in the Striatum of Patients with Idiopathic Parkinson's Disease. New England Journal of Medicine. 1988;318(14):876-880.
16. Geng DY, Li YX, & Zee CS (2006) Magnetic resonance imaging-based volumetric analysis of basal ganglia nuclei and substantia nigra in patients with Parkinson’s disease. Neurosurgery, 58, 256-262; discussion 256-262.
Figures