1921
Silent Susceptibility Weighted MR Angiography; Clinical and Phantom Study1Diagnostic and Interventional Radiology, Osaka University Graduate School of Medicine, Suita, Japan, 2GE Healthcare, MR Collaboration and Development, Tokyo, Japan, 3GE Global Research, Niskayuna, NY, United States
Synopsis
We compared silent susceptibility-weighted angiography (SWAN) with conventional SWAN (cSWAN) in the depiction of hemorrhagic lesions. We measured acoustic noise and performed phantom and clinical study using silent SWAN, cSWAN, and T2*-weighted images (T2*-WI). Acoustic noise of silent SWAN was significantly lower compared to cSWAN. In clinical and phantom study, the contrast-noise ratio (CNR) for silent SWAN and cSWAN were similar. The CNR for T2*-WI was lower than them. In clinical study, imaging quality was almost the same. T2*-WI had more artifact. Conventional SWAN may be replaced with silent SWAN which yields comparable imaging quality and lower acoustic noise.
Introduction
Susceptibility-weighted angiography (SWAN) is a high-resolution 3D encoding multi-echo gradient echo sequence. Silent SWAN has been developed to reduce the acoustic noise during scan (1). We compared silent SWAN with conventional SWAN (cSWAN) in the depiction of hemorrhagic lesions.Methods
All MRI scans were performed on a 3T MRI system (Discovery 750; General Electric Healthcare, Milwaukee, WI, USA) including Silent SWAN (repetition time (TR)= 63.2ms, first echo time (TE)= 40.3ms, flip angle (FA)= 15°, field of view (FOV)= 22×22cm, slice thickness= 2.0mm, matrix size= 320×224, time= 4m29s), cSWAN (TR= 52.2ms, first TE= 40.3ms, FA= 15°, FOV= 22×22cm, slice thickness= 2.0mm, matrix size= 320×224, time= 3m42s), and T2*-weighted image (T2*-WI).
-Noise reduction
We measured acoustic and background noise during silent SWAN and cSWAN imaging 10 times at a distance of 2 meters from the scanner. We evaluated the image quality of silent SWAN and cSWAN with reference to a previous report of SWI (2).
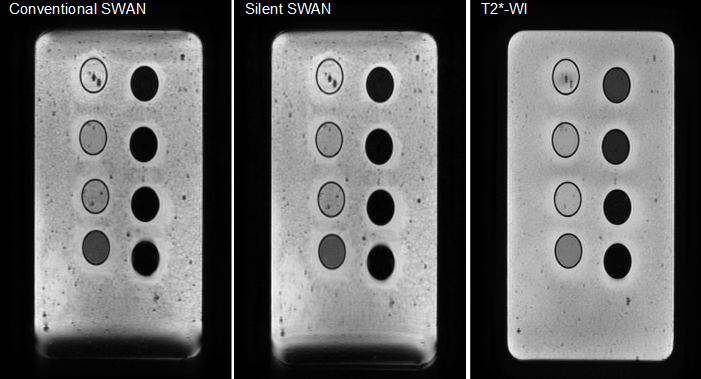
-Phantom study
The phantom agar consisted of eight chambers with different concentrations of superparamagnetic iron oxide (SPIO:Ferucarbotran (Resovist® FUJIFILM RI Pharma, Tokyo, Japan)) (figure 1). To calculate contrast-to-noise ratio (CNR), we measured the signal intensity of lesions using region of interest (ROI). To evaluate the relative sensitivity we calculated for standardized CNR (CNR= (SIWM – SIL) / SD, where SIL is the mean signal intensity of the ROI within the lesion; SIWM, the mean signal intensity of the white matter; and SD, the standard deviation of noise along the phase-encoding direction. CNR divided by the maximum CNR of the chambers on each image). We used paired t-test for statistical analysis.
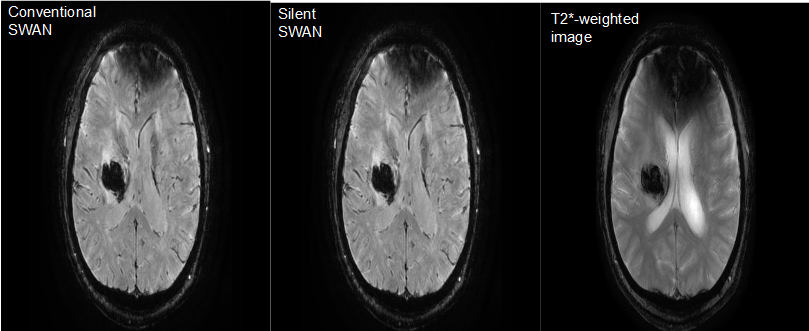
-Clinical study
We obtained MR images of 8 patients with intracerebral hemorrhage. MR images include silent SWAN, cSWAN, and T2*-WI (figure 2). Two neuroradiologists evaluated the images for detectability and artifact of lesions and scored them on a 4-point scale. We also evaluated whether hypointense areas on silent SWAN or cSWAN increased in size from T2*-WI. They counted the number of microbleeds on each image.
Results
-Noise reduction
Acoustic noise for silent SWAN were significantly reduced 57.7 ± 0.32 dB (background noise 51.0 dB), 89.1 ± 0.22 dB (background noise 50.9 dB) for cSWAN.
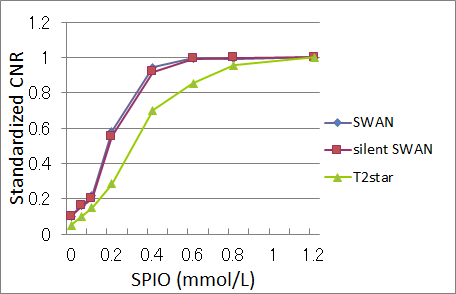
-Phantom study
The standardized CNRs for silent SWAN were similar to that for cSWAN (0.16, 0.22, 0.58, 0.94, 0.99, and 0.99, and for cSWAN 0.16, 0.20, 0.56, 0.92, 0.99, and 0.99 at SPIO concentration of 0.05, 0.1, 0.2, 0.4, 0.6, 0.8, and 1.2 mmol/L) (figure 3).
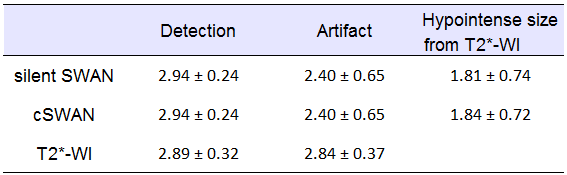
-Clinical study
There
were no significant differences between silent SWAN and cSWAN with
respect to the scores of detection, artifact, and change of
hypointense size from T2*-WI (table 1).
T2*-WI
had significantly more artifact (P = 0.042) than silent SWAN and
cSWAN
The
numbers of microbleeds were 176 in silent SWAN, 172 in cSWAN, 123 in
T2*-WI.
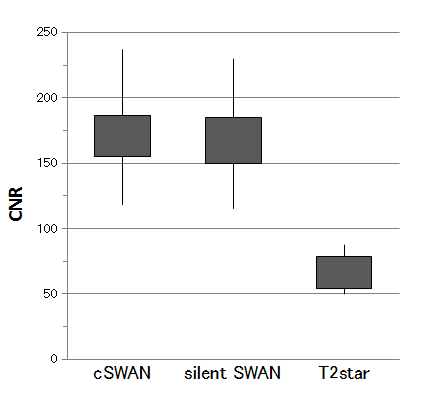
The
CNRs were 169.1 ± 35.9 for silent SWAN, 166.4 ± 39.0 for cSWAN, and
62.2 ± 14.4 for T2*-WI.
The
CNR of silent SWAN was not significantly higher than that of cSWAN
(P=0.360) but higher than that of T2*-WI (P < 0.001) (figure 4).
Discussion
We compared silent SWAN with cSWAN on the basis of detecting hemorrhagic lesions. Silent SWAN, a newly developed silent multi-echo 3D GRE sequence, uses sinusoidal gradients in place of trapezoidal waveforms. On T1-, T2-, and diffusion-weighted images, there are some reports comparing silent sequences and conventional images with respect to such as the normal brain parenchyma and myelination of children (3-6). To the best of our knowledge, evaluation of silent SWAN with for detecting hemorrhagic lesions compared with cSWAN have never been reported. This study demonstrated that the acoustic noise during silent SWAN was about 80% lower than cSWAN. In the phantom study, the standardized CNRs of silent SWAN and cSWAN were almost the same. Even in the clinical study the CNRs were not significantly different. The number of microbleeds of silent SWAN and cSWAN were almost the same. They detected about 1.5 times more lesions compared withT2*-WI. Some papers reported that susceptibility-weighted imaging (SWI) or SWAN detected more intracranial hemorrhagic lesions than T2*-WI (7-9) did. The reason why the number of microbleeds of silent SWAN and cSWAN are not exactly the same is because two microbleeds appear to be one depending on the position of MinIP or because they are not visible due to skull base artifacts.Conclusion
Silent SWAN was substantially equal to conventional SWAN in the depiction of hemorrhagic lesions. cSWAN may be replaced with silent SWAN which yields a substantially comparable imaging quality and lower acoustic noise.Acknowledgements
No acknowledgement found.References
(1) PW Worters, D Beque, RD Peters, et al. Quantitative Susceptibility Mapping – Comparison of Silent and Conventional Acquisitions. Proc. Intl. Soc. Mag. Reson. Med. 2016; 24: 4099.
(2) Akter M, Hirai T, Hiai Y, et al. Detection of hemorrhagic hypointense foci in the brain on susceptibility-weighted imaging clinical and phantom studies. Acad Radiol. 2007;14(9):1011-9
(3) Rösch J, Ott M, Heismann B, et al. Quiet diffusion-weighted head scanning: Initial clinical evaluation in ischemic stroke patients at 1.5T. J Magn Reson Imaging. 2016;44(5):1238-1243.
(4) Aida N, Niwa T, Fujii Y, et al. Quiet T1-Weighted Pointwise Encoding Time Reduction with Radial Acquisition for Assessing Myelination in the Pediatric Brain. AJNR Am J Neuroradiol. 2016;37(8):1528-34.
(5) Matsuo-Hagiyama C, Watanabe Y, Tanaka H, et al. Comparison of Silent and Conventional MR Imaging for the Evaluation of Myelination in Children. Magn Reson Med Sci. 2017;16(3):209-216.
(6) Ohlmann-Knafo S, Morlo M, Tarnoki DL, et al. Comparison of image quality characteristics on Silent MR versus conventional MR imaging of brain lesions at 3 Tesla. Br J Radiol. 2016 Oct 5:20150801. [Epub ahead of print]
(7) Hayashida Y, Kakeda S, Hiai Y, et al. Diagnosis of intracranial hemorrhagic lesions: comparison between 3D-SWAN (3D T2*-weighted imaging with multi-echo acquisition) and 2D-T2*-weighted imaging. Acta Radiol. 2014;55(2):201-7.
(8) Mori N, Miki Y, Kikuta K, et al. Microbleeds in moyamoya disease: susceptibility-weighted imaging versus T2*-weighted imagingat 3 Tesla. Invest Radiol. 2008;43(8):574-9.
(9) de Souza JM, Domingues RC, Cruz LC Jr, et al. Susceptibility-weighted imaging for the evaluation of patients with familial cerebral cavernous malformations: a comparison with t2-weighted fast spin-echo and gradient-echo sequences. AJNR Am J Neuroradiol. 2008;29(1):154-8.
Figures