1918
Pseudo Continuous ASL for Quantification of Regional Cerebral Hypoperfusion in Chronic Fatigue1Electronic and Electrical Engineering, University of Sheffield, Sheffield, United Kingdom, 2Department of Neuroscience, University of Sheffield, Sheffield, United Kingdom, 3Department of Clinical Medical Sciences, University of the West Indies, St Augustine, Trinidad and Tobago, 4Academic Radiology, University of Sheffield, Sheffield, United Kingdom
Synopsis
In this study pseudo continuous arterial spin labelling (pCASL) was employed to measure cerebral blood flow (CBF) in chronic fatigue syndrome (CFS) patients and healthy volunteers, to determine if CBF was reduced in CFS and in post-exertional malaise. Normalised regional CBF was found to be reduced in CFS for 11 brain regions, predominantly in the left hemisphere, including 8 previously identified regions, along with the left paracentral lobe, and the left and right posterior cingulate. Patients were asked to return for a second scan during post-exertional malaise, in which rCBF was found to be reduced in the left temporal pole.
Purpose
Chronic fatigue syndrome (CFS), or Myalgic Encephalomyelitis (ME) (1), is a poorly understood condition involving long-term relapsing fatigue and neurological symptoms. Previous studies have reported lower cerebral blood flow (CBF) in CFS (2-8), but the data so far is inconclusive. Using pseudo continuous arterial spin labelling (pCASL) (9) this pilot study aimed to determine whether CBF varies in CFS, and also in post-exertional malaise, which is a main feature of CFS (1).
Methods
Recruitment: CFS patients were recruited (n=9, ages 29-48 yrs, mean age 40 yrs, all female) with mild-moderate severity, onset of symptoms within the previous 24 months, and diagnosis according to international consensus criteria (1), along with matched healthy volunteers (n=10, ages 26-52 yrs, mean age 39 yrs, all female). All subjects were invited to attend two MRI scan sessions separated by several weeks. Patients were instructed to rest prior to the first scan and return for the second scan during post-exertional malaise. However, only 6 patients returned, and of these only 4 reported post-exertional malaise. Imaging: MRI was performed at 3 T (Ingenia, Philips, Netherlands) using a 15-channel receive-only head coil. For pCASL an echo planar imaging (EPI) sequence was employed with parameters: TR = 4000 ms; TE = 14 ms; EPI factor = 35; FOV = 240×240 mm; matrix = 80×80; NEX= 1; pairs of control/label images = 73; slices = 17; slice thickness = 8 mm; pCASL label time = 1.65 s; pCASL post label delay time = 1.525 s; scan duration = 9 min 52 s. Proton density (M0) maps were acquired (same geometry, resolution and EPI sequence) with no labelling and with TR = 10 s. 3D T1-weighted imaging (T1w) was carried out with a magnetisation prepared rapid gradient echo (MPRAGE) sequence with parameters: TR = 8.26 ms; TE = 3.82 ms; resolution = 1 mm × 1 mm × 1 mm; scan duration = 5 min 26 s. Post-processing: To correct for head motion, the pCASL control/label pair image volumes were aligned to the first pCASL image volume using ASLToolbox (10). Brain regions were segmented from the T1w data using FreeSurfer (v.5.3) (11). The mask images were registered to the pCASL image volume using Statistical Parametric Mapping (SPM8) (12). Mean regional CBF (rCBF) values were calculated for the registered regions using Matlab (R2012, Mathworks, Natick, MA). To reduce the influence of global physiological fluctuations the rCBF values were normalised by the mean global CBF (gCBF) (13). Statistical Analysis: Paired t-tests were used to compare gCBF between visits, and two-sample t-tests to compare gCBF between groups. Multivariate Analysis of variance (MANOVA) was used to compare rCBF values between groups and visits (IBM SPSS Statistics, Version 22.0, IBM Corp, Armonk, NY, USA). Significance was tested throughout at the 0.05 level.
Results
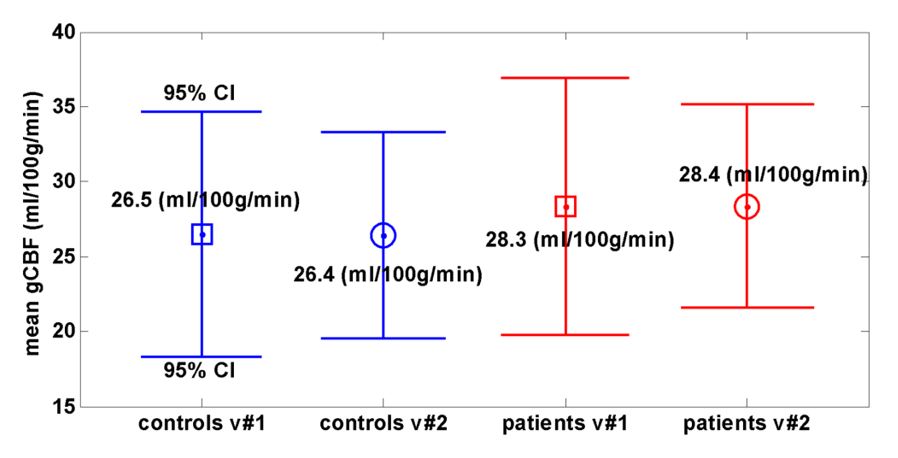
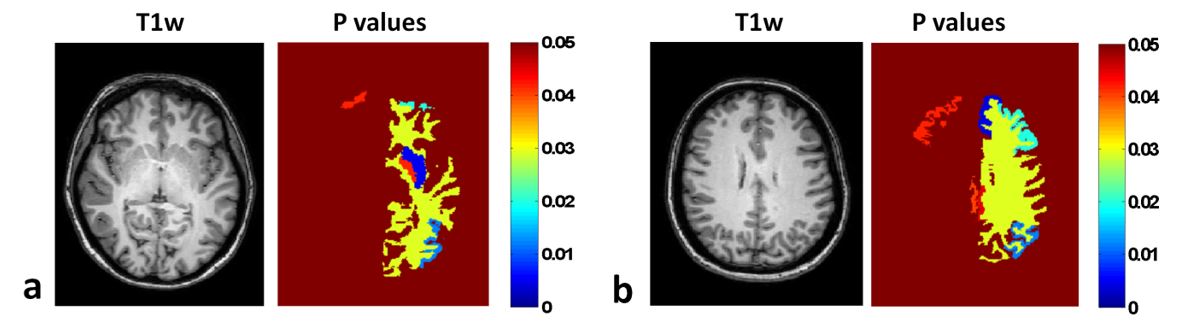
gCBF: No significant differences were found between groups or visits (Fig.1). Absolute rCBF: For visit #1 there was a significant difference between controls and patients (F(17,1)=5,084; p=0.011; Pillai’s Trace=1), but there were no significant “between-subject effects” (effect of CFS for individual brain regions). There was no significant difference between visits for controls or patients. However for patients, there was a significant “between-subject effect” (between visit #1 and #2) for the left temporal pole of the cortex (p=0.035), in which rCBF was lower for visit #2, by 5.3 ml/100g/min. Normalised rCBF (nrCBF): There was a statistical trend towards a mean difference between controls and patients on visit #1: F(17,1)=209; p=0.054; Pillai’s Trace=1. Furthermore, 11 brain regions had significant between-subject effects and lower nrCBF in CFS (Left: white matter, putamen, pallidum, inferior parietal lobe, paracentral lobe, posterior cingulate, rostral middle frontal lobe, superior frontal lobe; Right: caudal middle frontal lobe, posterior cingulate, rostral middle frontal lobe) (Fig. 2). For controls there was no significant difference between visits, however the left thalamus showed a significant between-subject effect (p=0.046), with a reduced nrCBF on visit #2. For patients there was again no significant difference between visits, but the left temporal pole again had a significant between-subject effect (p=0.033), and a reduced nrCBF on visit #2.
Conclusion
This study has made new findings, as while others (2,4-6,8) have reported hypoperfusion in CFS in some of the brain regions identified, the left paracentral lobe, and the left and right posterior cingulate were not previously reported. Furthermore, the lower rCBF in the left temporal pole on the patients’ second visit may be associated with post-exertional malaise. While the cohorts of this pilot study were small, the results are important to the understanding of CFS, and will inform future larger studies.
Acknowledgements
Financial support for this study was provided by Action for M.E. IDW acknowledges support from the Wellcome Trust and NIHR Sheffield Biomedical Research Centre. DMcG was supported by the European Union Seventh Framework Programme (FP7/2007–2013) grant number: 601055.References
1. Carruthers BM, van de Sande MI, De Meirleir KL, Klimas NG, Broderick G, Mitchell T, Staines D, Powles AC, Speight N, Vallings R, Bateman L, Baumgarten-Austrheim B, Bell DS, Carlo-Stella N, Chia J, Darragh A, Jo D, Lewis D, Light AR, Marshall-Gradisbik S, Mena I, Mikovits JA, Miwa K, Murovska M, Pall ML, Stevens S. Myalgic encephalomyelitis: International Consensus Criteria. J Intern Med 2011;270(4):327-338.
2. Schwartz RB, Komaroff AL, Garada BM, Gleit M, Doolittle TH, Bates DW, Vasile RG, Holman BL. SPECT imaging of the brain: comparison of findings in patients with chronic fatigue syndrome, AIDS dementia complex, and major unipolar depression. AJR Am J Roentgenol 1994;162(4):943-951.
3. Fischler B, D'Haenen H, Cluydts R, Michiels V, Demets K, Bossuyt A, Kaufman L, De Meirleir K. Comparison of 99m Tc HMPAO SPECT scan between chronic fatigue syndrome, major depression and healthy controls: an exploratory study of clinical correlates of regional cerebral blood flow. Neuropsychobiology 1996;34(4):175-183.
4. Yoshiuchi K, Farkas J, Natelson BH. Patients with chronic fatigue syndrome have reduced absolute cortical blood flow. Clin Physiol Funct Imaging 2006;26(2):83-86.
5. Biswal B, Kunwar P, Natelson BH. Cerebral blood flow is reduced in chronic fatigue syndrome as assessed by arterial spin labeling. J Neurol Sci 2011;301(1-2):9-11.
6. Shungu DC, Weiduschat N, Murrough JW, Mao X, Pillemer S, Dyke JP, Medow MS, Natelson BH, Stewart JM, Mathew SJ. Increased ventricular lactate in chronic fatigue syndrome. III. Relationships to cortical glutathione and clinical symptoms implicate oxidative stress in disorder pathophysiology. NMR Biomed 2012;25(9):1073-1087.
7. Ichise M, Salit IE, Abbey SE, Chung DG, Gray B, Kirsh JC, Freedman M. Assessment of regional cerebral perfusion by 99Tcm-HMPAO SPECT in chronic fatigue syndrome. Nucl Med Commun 1992;13(10):767-772.
8. Schwartz RB, Garada BM, Komaroff AL, Tice HM, Gleit M, Jolesz FA, Holman BL. Detection of intracranial abnormalities in patients with chronic fatigue syndrome: comparison of MR imaging and SPECT. AJR Am J Roentgenol 1994;162(4):935-941.
9. Alsop DC, Detre JA, Golay X, Gunther M, Hendrikse J, Hernandez-Garcia L, Lu H, Macintosh BJ, Parkes LM, Smits M, van Osch MJ, Wang DJ, Wong EC, Zaharchuk G. Recommended implementation of arterial spin-labeled perfusion MRI for clinical applications: A consensus of the ISMRM perfusion study group and the European consortium for ASL in dementia. Magn Reson Med 2015;73(1):102-116.
10. Wang Z, Aguirre GK, Rao H, Wang J, Fernandez-Seara MA, Childress AR, Detre JA. Empirical optimization of ASL data analysis using an ASL data processing toolbox: ASLtbx. Magn Reson Imaging 2008;26(2):261-269.
11. http://surfer.nmr.mgh.harvard.edu/.
12. http://www.fil.ion.ucl.ac.uk/spm. Wellcome Department of University College London, UK.
13. Aslan S, H. L. On the sensitivity of ASL MRI in detecting regional differences in cerebral blood flow. Magn Reson Imaging 2010;28(7):928-935.
Figures