1911
Visualization of lenticulostriate arteries by high-resolution vessel wall imaging on a 3T MRI system: a comparison study between subjects with and without lacunar infarction in the basal ganglia region1First Central Clinical College of TianJin Medical University, Tianjin, China, 2Department of Radiology,Tianjin First Central Hospital, Tianjin, China, 3MR Collaboration NEA, Siemens Healthcare, Beijing, China
Synopsis
The lenticulostriate artery may be associated with lacunar infarction. We aimed to visualize the lenticulostriate artery and explore the correlation between the number and length of lenticulostriate arteries and the number and volume of lacunar infarctions using High-Resolution Vessel Wall Imaging (HR-VWI) on a 3T MR scanner. The results indicated that the length of the lenticulostriate artery was associated with the number of lacunar infarctions. The lenticulostriate artery can be well visualized with HR-VWI, and the length of the artery may be associated with lacunar infarction.
Background and Purpose
Lacunar infarctions commonly occur in the basal ganglia and have an impact on neurological function. The lenticulostriate arteries (LSAs) are the vessels associated with lacunar infarctions.1,2 Conventional imaging approaches, like time-of-flight MRA and even DSA, have a limited ability to visualize the LSAs. They can not visualize the LSAs completely and clearly. And other detailed information would not be available. High-Resolution Vessel Wall Imaging (HR-VWI) has a proven capacity to define vessel wall characteristics well.3,4 Therefore, we conducted this study to visualize the LSA using HR-VWI on a 3T system and explore the correlation between the number and length of LSAs and the number and volume of lacunar infarctions.Materials and Methods
Thirty-four patients (23 men, 11 women; mean age, 59.88±10.31 years) with lacunar infarctions in the basal ganglia, and 25 age-matched control subjects (11 men, 14 women; mean age, 58.96±8.57 years) were enrolled and scanned on a 3T MAGNETOM Trio a Tim system (Siemens Healthcare, Erlangen, Germany). After regrouping, all subjects were divided into 50 lacunar infarction hemispheres and 68 non-lacunar infarction hemispheres groups for further analysis. HR-VWI was acquired using a high-resolution T1-SPACE sequence with the following parameters: TR/TE = 900/14 ms; flip angle = 120°; acquisition matrix size = 384×300; field of view (FOV) = 210 mm×178 mm; bandwidth = 465 Hz/voxel; and 0.55 mm slice thickness with scan time of 7 minutes, 43 seconds. T2-weighted images were obtained using the following parameters: TR/TE = 25/7.5 ms; flip angle = 6°; acquisition matrix size = 384×288; FOV = 256 mm×192 mm; bandwidth = 241 Hz/voxel; and slice thickness = 2 mm. The 3D axial image volumes were subsequently reoriented into a coronal direction by minimum intensity projection. The counting and measuring of the LSAs were conducted using a post-processing routine implemented on the workstation(Syngo Via). The clinical characteristics and the imaging findings of the LSAs and lacunar infarctions were evaluated. The imaging findings included the number and total length of the LSAs in the coronal images, the number and volume of the lacunar infarctions, and the number of slices of visible infarctions on T2WI. The conditions of the LSAs were evaluated visually using a 3-point scale (0: not visualized; 1: poor; 2: good and excellent) for the HR-VWI. The quantitative data were tested using the t-test if they were normally distributed and homogeneous; if not, the Mann-Whitney U test was used. The qualitative data were tested using the Pearson Chi-Squared test. A P value < 0.05 was considered statistically significant.Results
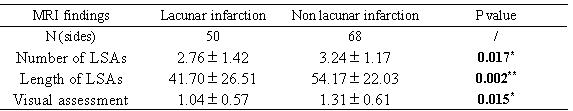
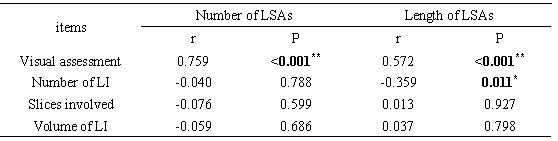
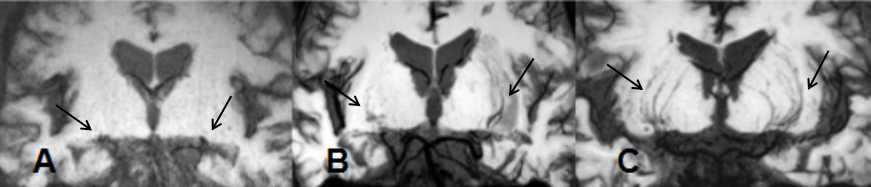
Representative images of the LAS with different scale points are shown in Figure 1. In the univariate analysis, the number (2.76 ± 1.42 and 3.24 ± 1.17, respectively, P = 0.017) and total length (41.70 ± 26.51 and 54.17 ±22.03, respectively, P = 0.002) of the LSAs were significantly different between lacunar infarctions and non-lacunar infarctions. These findings could be validated from the visual assessment (1.04 ± 0.57 and 1.31 ± 0.61, respectively, P = 0.015) (Table 1). In the correlation analysis, the number of LSAs was only found to be significant to the visual assessment of the vessels (r = 0.759, P < 0.001); the length of the LSAs was significant correlated to the visual assessment of the vessels (r = 0.572, P < 0.001) and the number of lacunar infarctions (r = -0.359, P = 0.011) (Table 2 and Fig 2). Lastly, the volume of the lacunar infarctions was not found to be significant.Discussion and Conclusions
HR-VWI provides detailed information about the LSA, such as the number and length of LSAs and the number and volume of lacunar infarctions in the basal ganglia. In this study, the number of lacunar infarctions was found to be an important factor in patients with lacunar infarction in the basal ganglia. Lacunar infarctions in the basal ganglia would lead to a reduction in LSAs. The volume of the lacunar infarctions was not found to be significant, and we postulate that the volume of the lacunar infarctions decreases as they are absorbed over time.Acknowledgements
No acknowledgements found.References
1. Ki Jeong Lee, Hyeyoung Jung, Yoon-Sang Oh, et al. The Fate of Acute Lacunar Lesions in Terms of Shape and Size. J Stroke Cerebrovasc Dis, 26(6), 1254-1257. DOI: 10.1016/j.jstrokecerebrovasdis.2017.01.017
2. Lei Yang,Wei Qin,Xiaoyu Zhang, et al. Infarct Size May Distinguish the Pathogenesis of Lacunar Infarction of the Middle Cerebral Artery Territory. Med Sci Monit, 2016; 22: 211-218. DOI: 10.12659/MSM.896898
3. Yibin Xie, Qi Yang, Guoxi Xie, et al. Improved black-blood imaging using DANTE-SPACE for simultaneous carotid and intracranial vessel wall evaluation. Magn Reson Med. 2016 June; 75(6): 2286–2294. doi:10.1002/mrm.25785.
4. Okuchi S, Okada T, Fujimoto K, et al. Visualization of lenticulostriate arteries at 3T: Optimization of slice-selective off-resonance sinc pulse-prepared TOF-MRA and its comparison with flow-sensitive black-blood MRA. Acad Radiol, 2014;21(6), 812-816. doi: 10.1016/j.acra.2014.03.007
Figures