1907
The effect of small vessel disease lesions on structural brain network1Department of Diagnostic Radiology, The University of Hong Kong, HKSAR, China, 2Department of Medicine, The University of Hong Kong, HKSAR, China, 3The State Key Laboratory of Brain and Cognitive Sciences, The University of Hong Kong, HKSAR, China, 4Philips Healthcare, HKSAR, China
Synopsis
We aim to explore the influences of cerebral small vessel disease (SVD) lesion on the structural brain network of patients with transient ischemic attack or acute stroke. Our results demonstrated that the efficiency of both global and regional network of patients with SVD were lower compared to those without, and that higher total SVD burden was significantly associated with decreased network efficiency. These results suggested that both presence and severity of SVD related lesion load is associated with disrupted network organization, and brain network analysis is a sensitive method to monitor and assess SVD.
Purpose
Non-demented elderly with cerebral small vessel disease (SVD) were found to have impaired structural brain connectivity, and subtle cognitive deficits were associated with the thereof 1,2. Considering the significant role of small vessel disease (SVD) in Alzheimer disease and vascular dementia 3, that in the patients with stroke and transient ischemic attack (TIA) should also be investigated. We therefore aim to investigate the effect of SVD lesions on the structural brain network of these patients, and the association between SVD lesion burden and the thereof.Materials and Methods
Participants Patients with TIA or acute stroke (n = 95) were recruited, with n = 59 having SVD lesions, and n = 36 without, whom are considered as controls. Both groups were matched by age, gender, and stroke diagnosis.
Experiments and Brain Network Construction DWIs were acquired using single-shot EPI with b values of 1000 and 2000 s/mm2 along 32 gradient directions using a 3.0T MRI scanner (Achieva TX scanner, Philips Healthcare). 3D-MPRAGE images were segmented into 90 brain regions according to AAL atlas. Whole-brain tractography was obtained using Diffusion Toolkit (trackvis.org/dtk/). Fiber tracts traversing two regions were counted, resulting in a connectivity matrix. Global and regional network measures were obtained using the Brain Connectivity Toolbox4.
Image analysis SWI, T2-weighted images and FLAIR images were used to detect the presence of cerebral microbleeds, lacunar infarcts, high-grade white matter hyperintensities, and high-grade perivascular spaces. The SVD burden was assessed for each subject by using the total SVD score that is on an ordinal scale from 0 to 4 5.
Statistical analysis Independent-samples t-test was used to test the difference in network measures between patients with and without SVD lesions. The associations between network measures and total SVD score were investigated using Pearson correlation. Correction for multiple comparison was performed using Bonferroni-correction.
Results
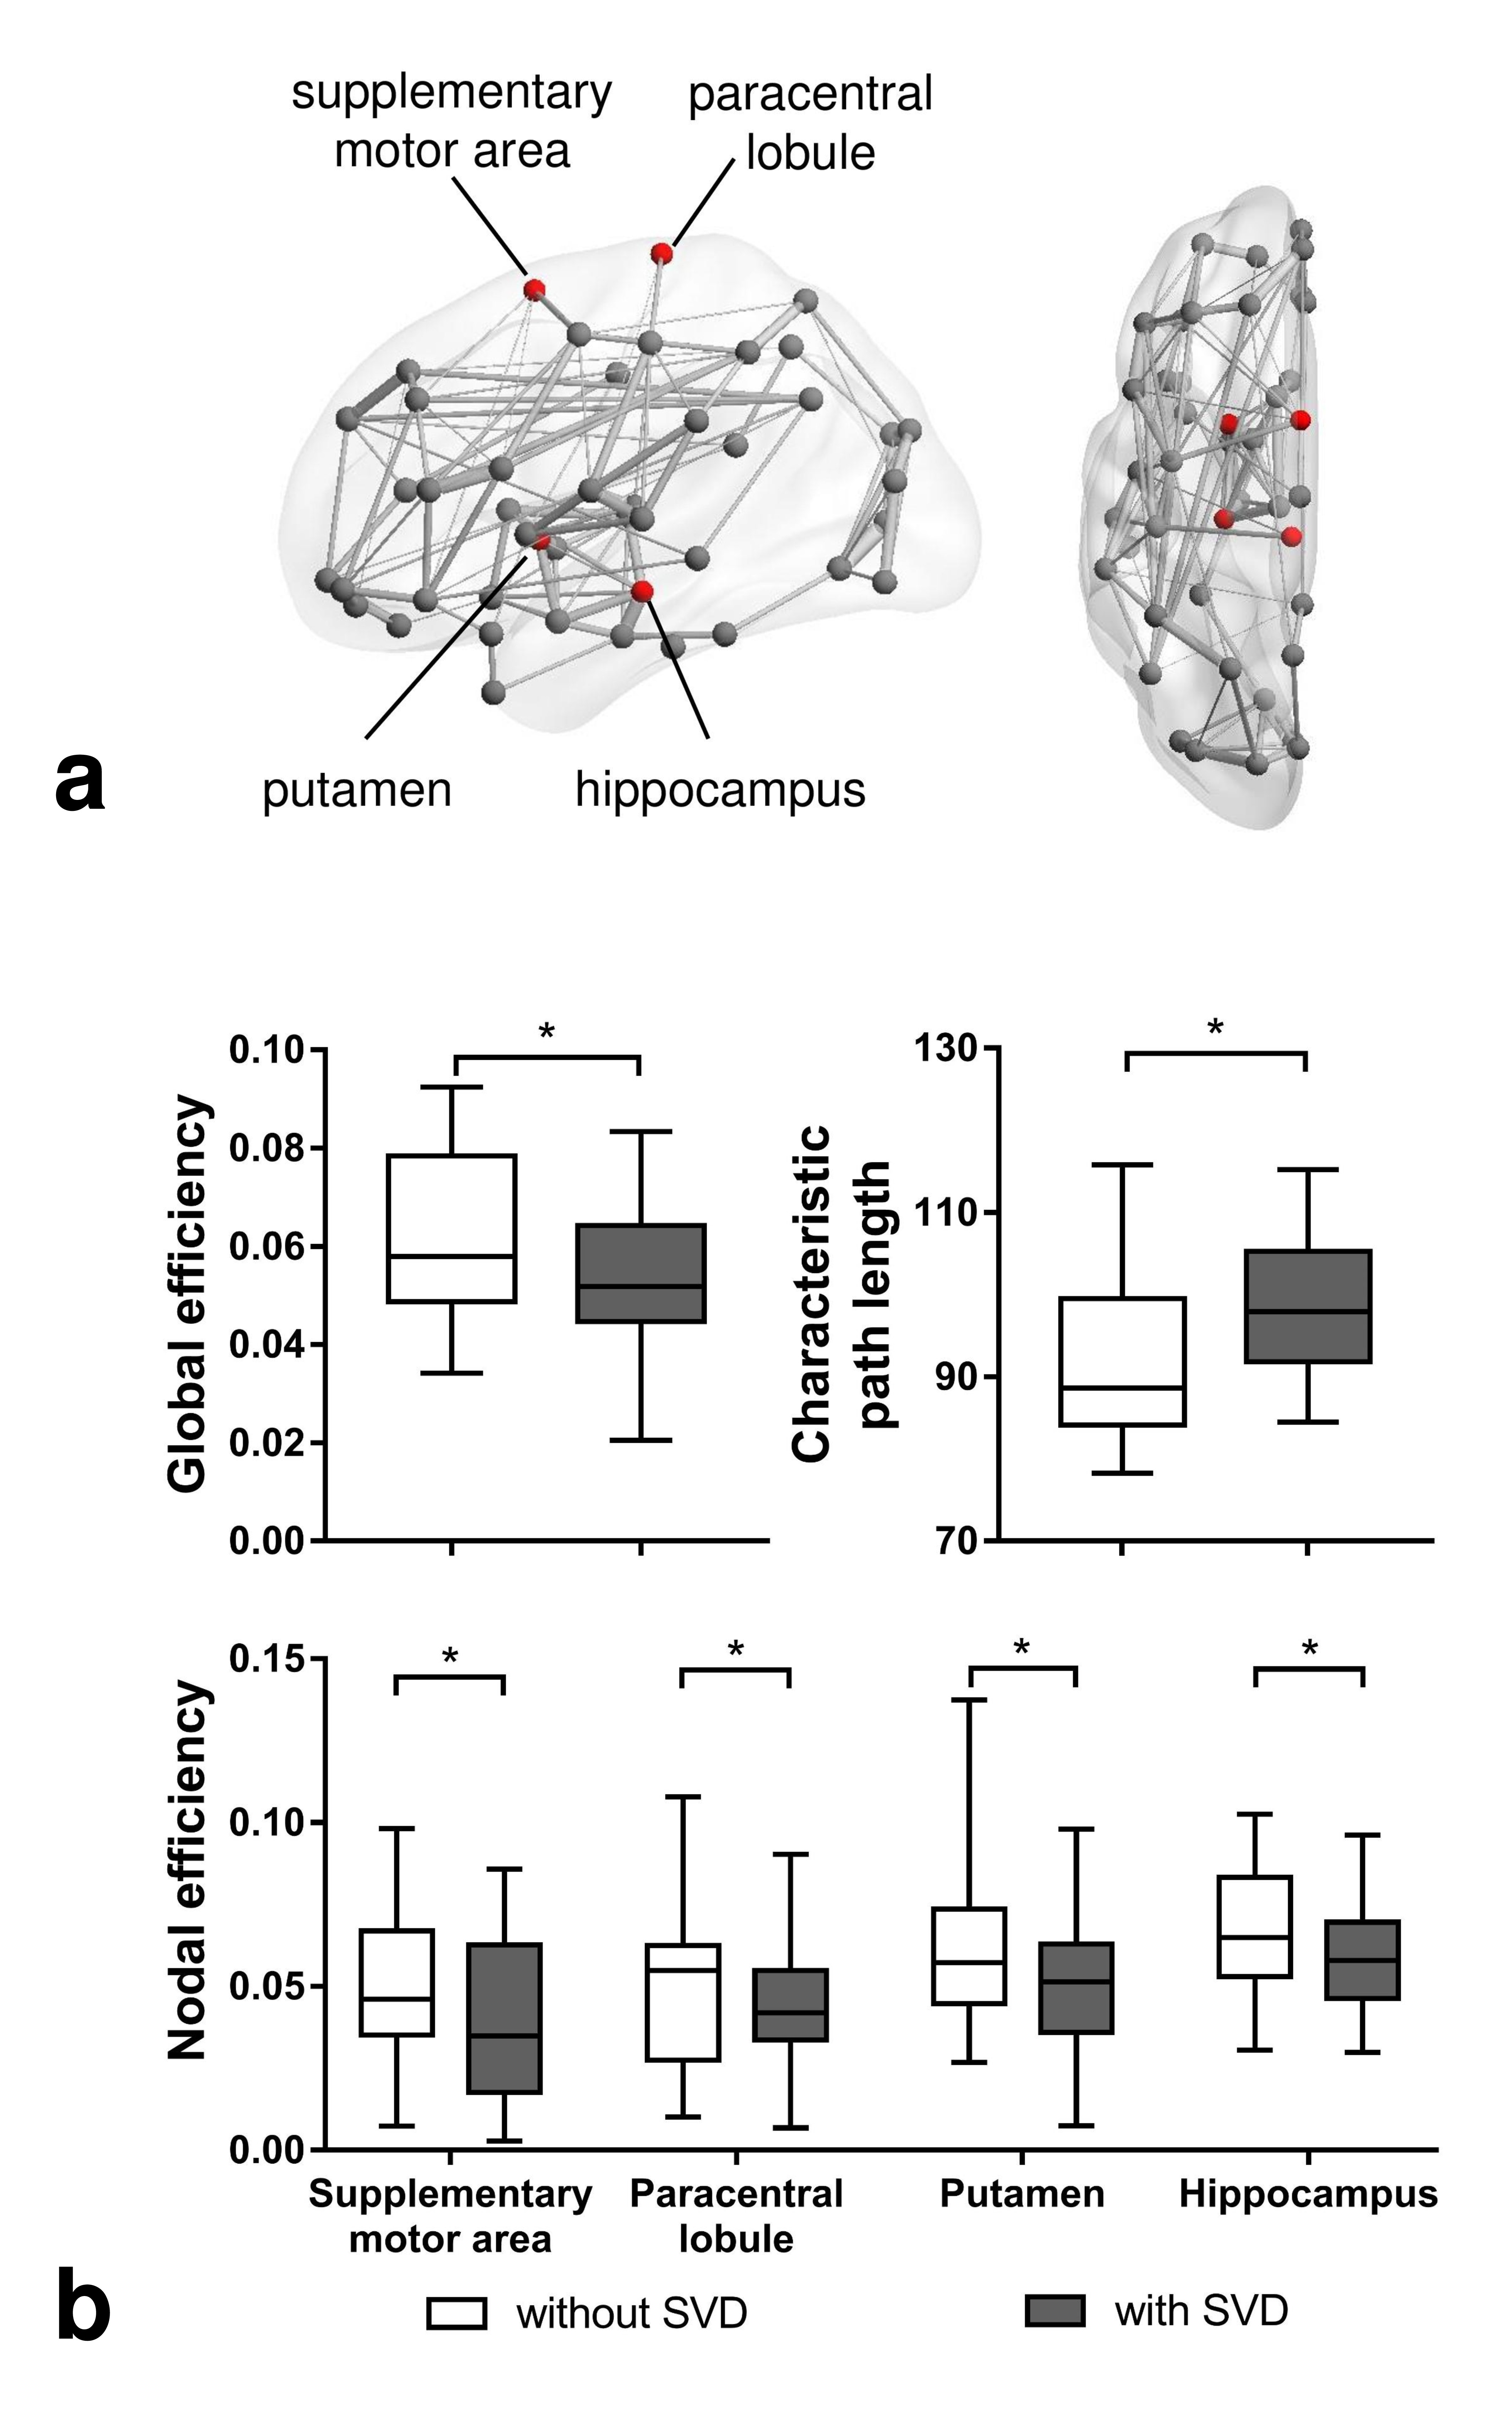
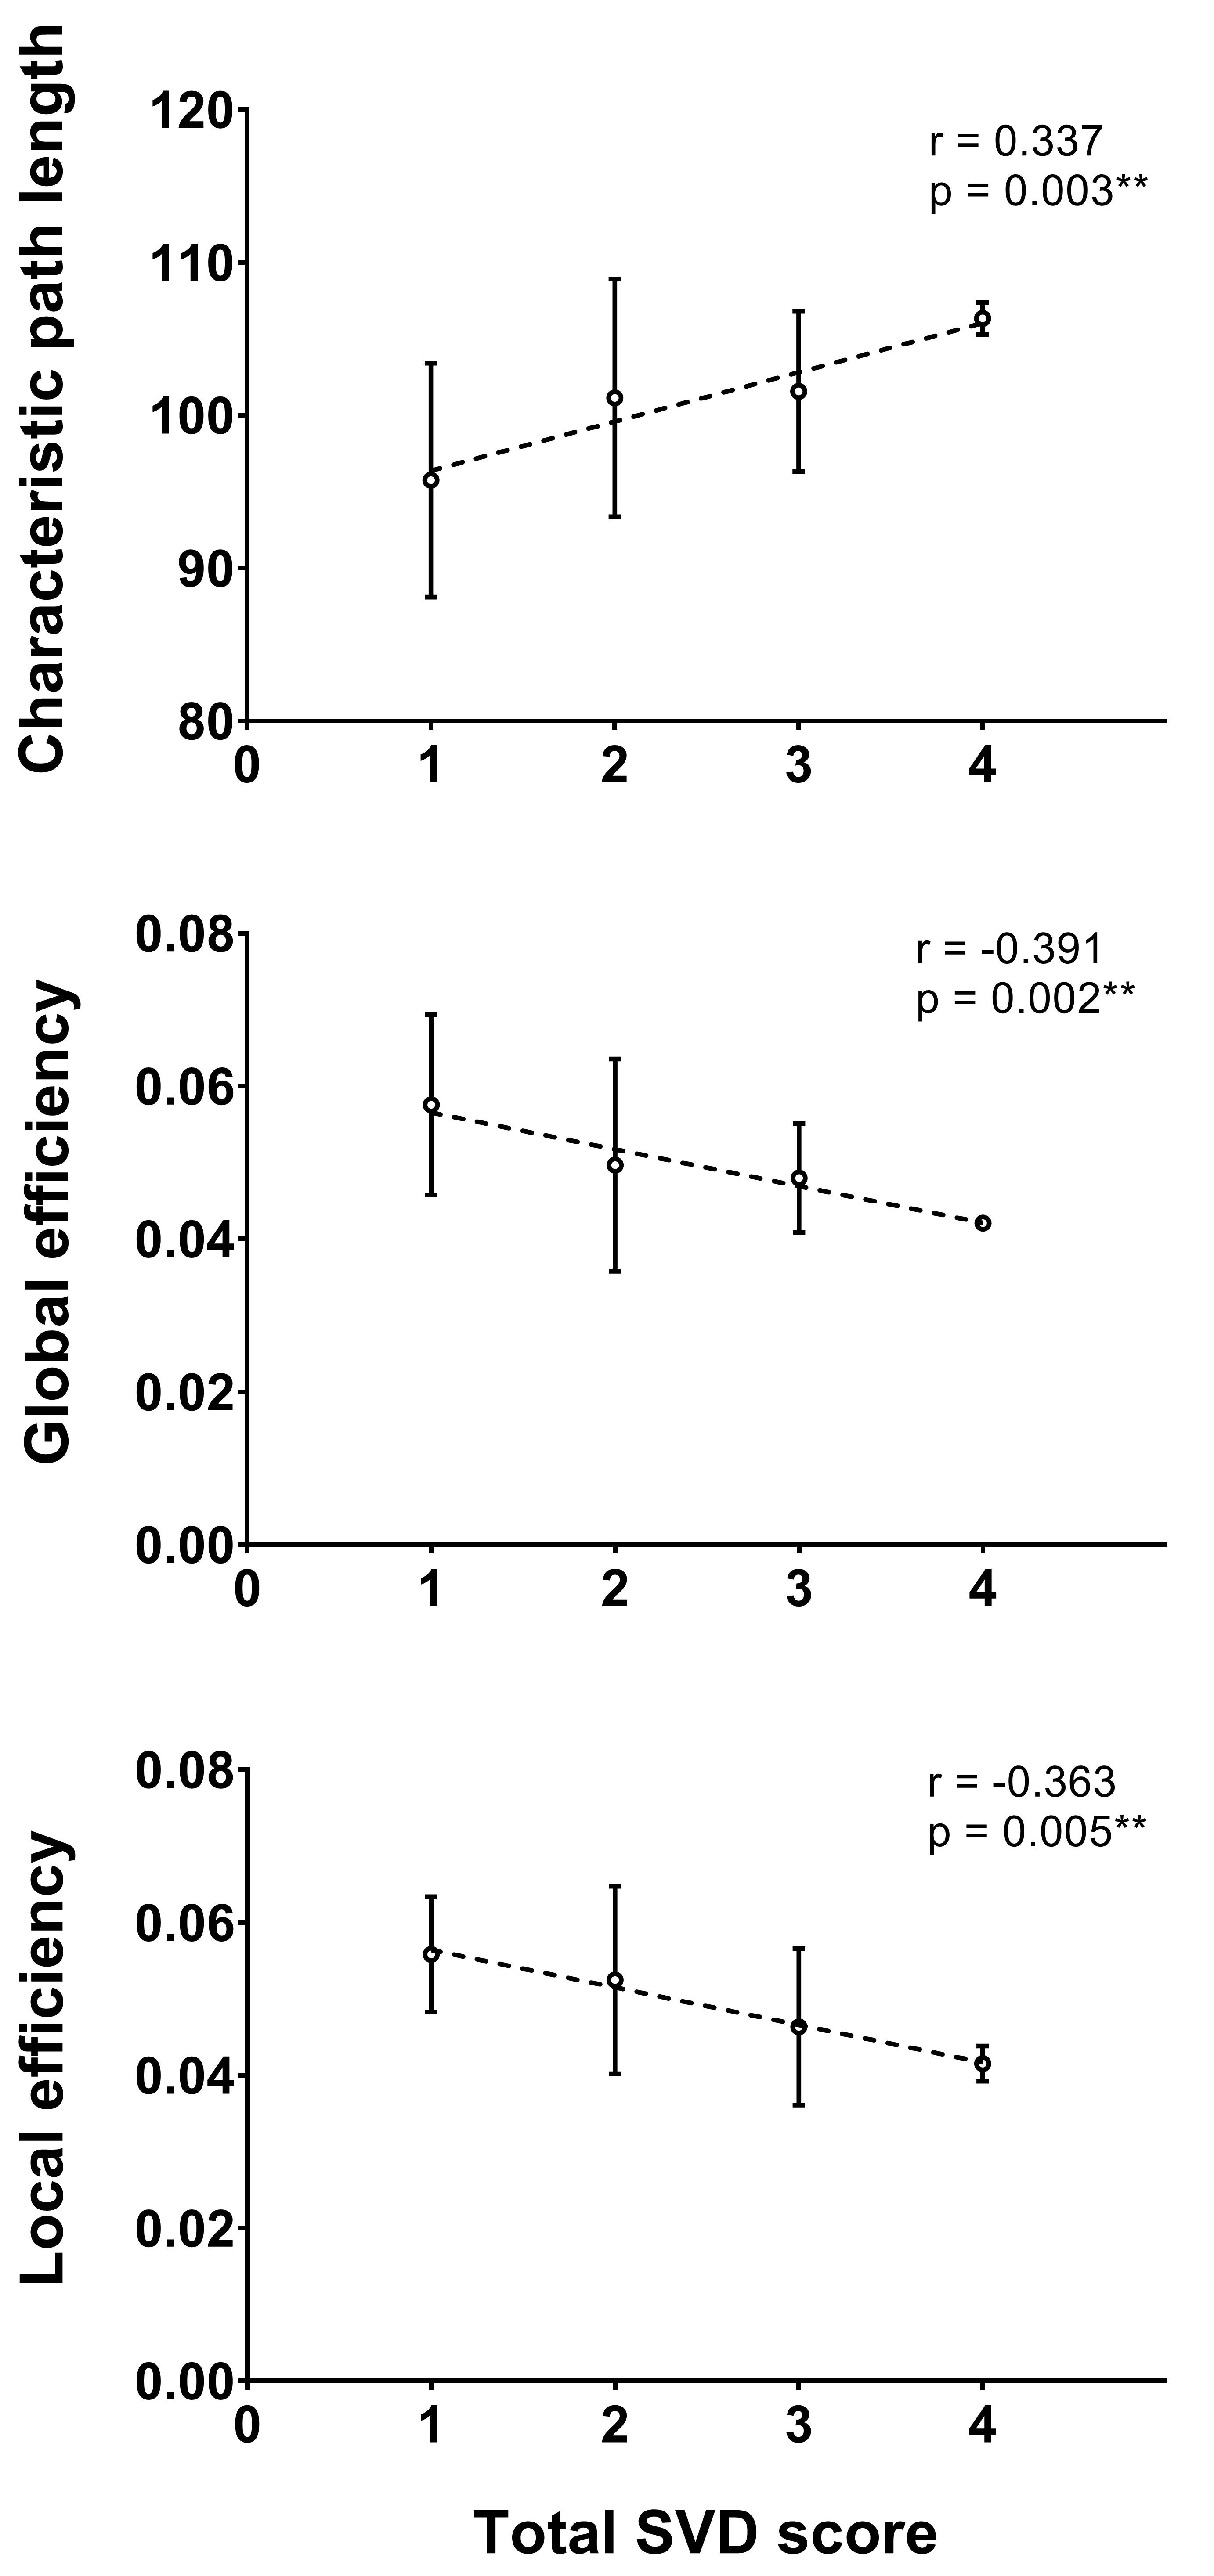
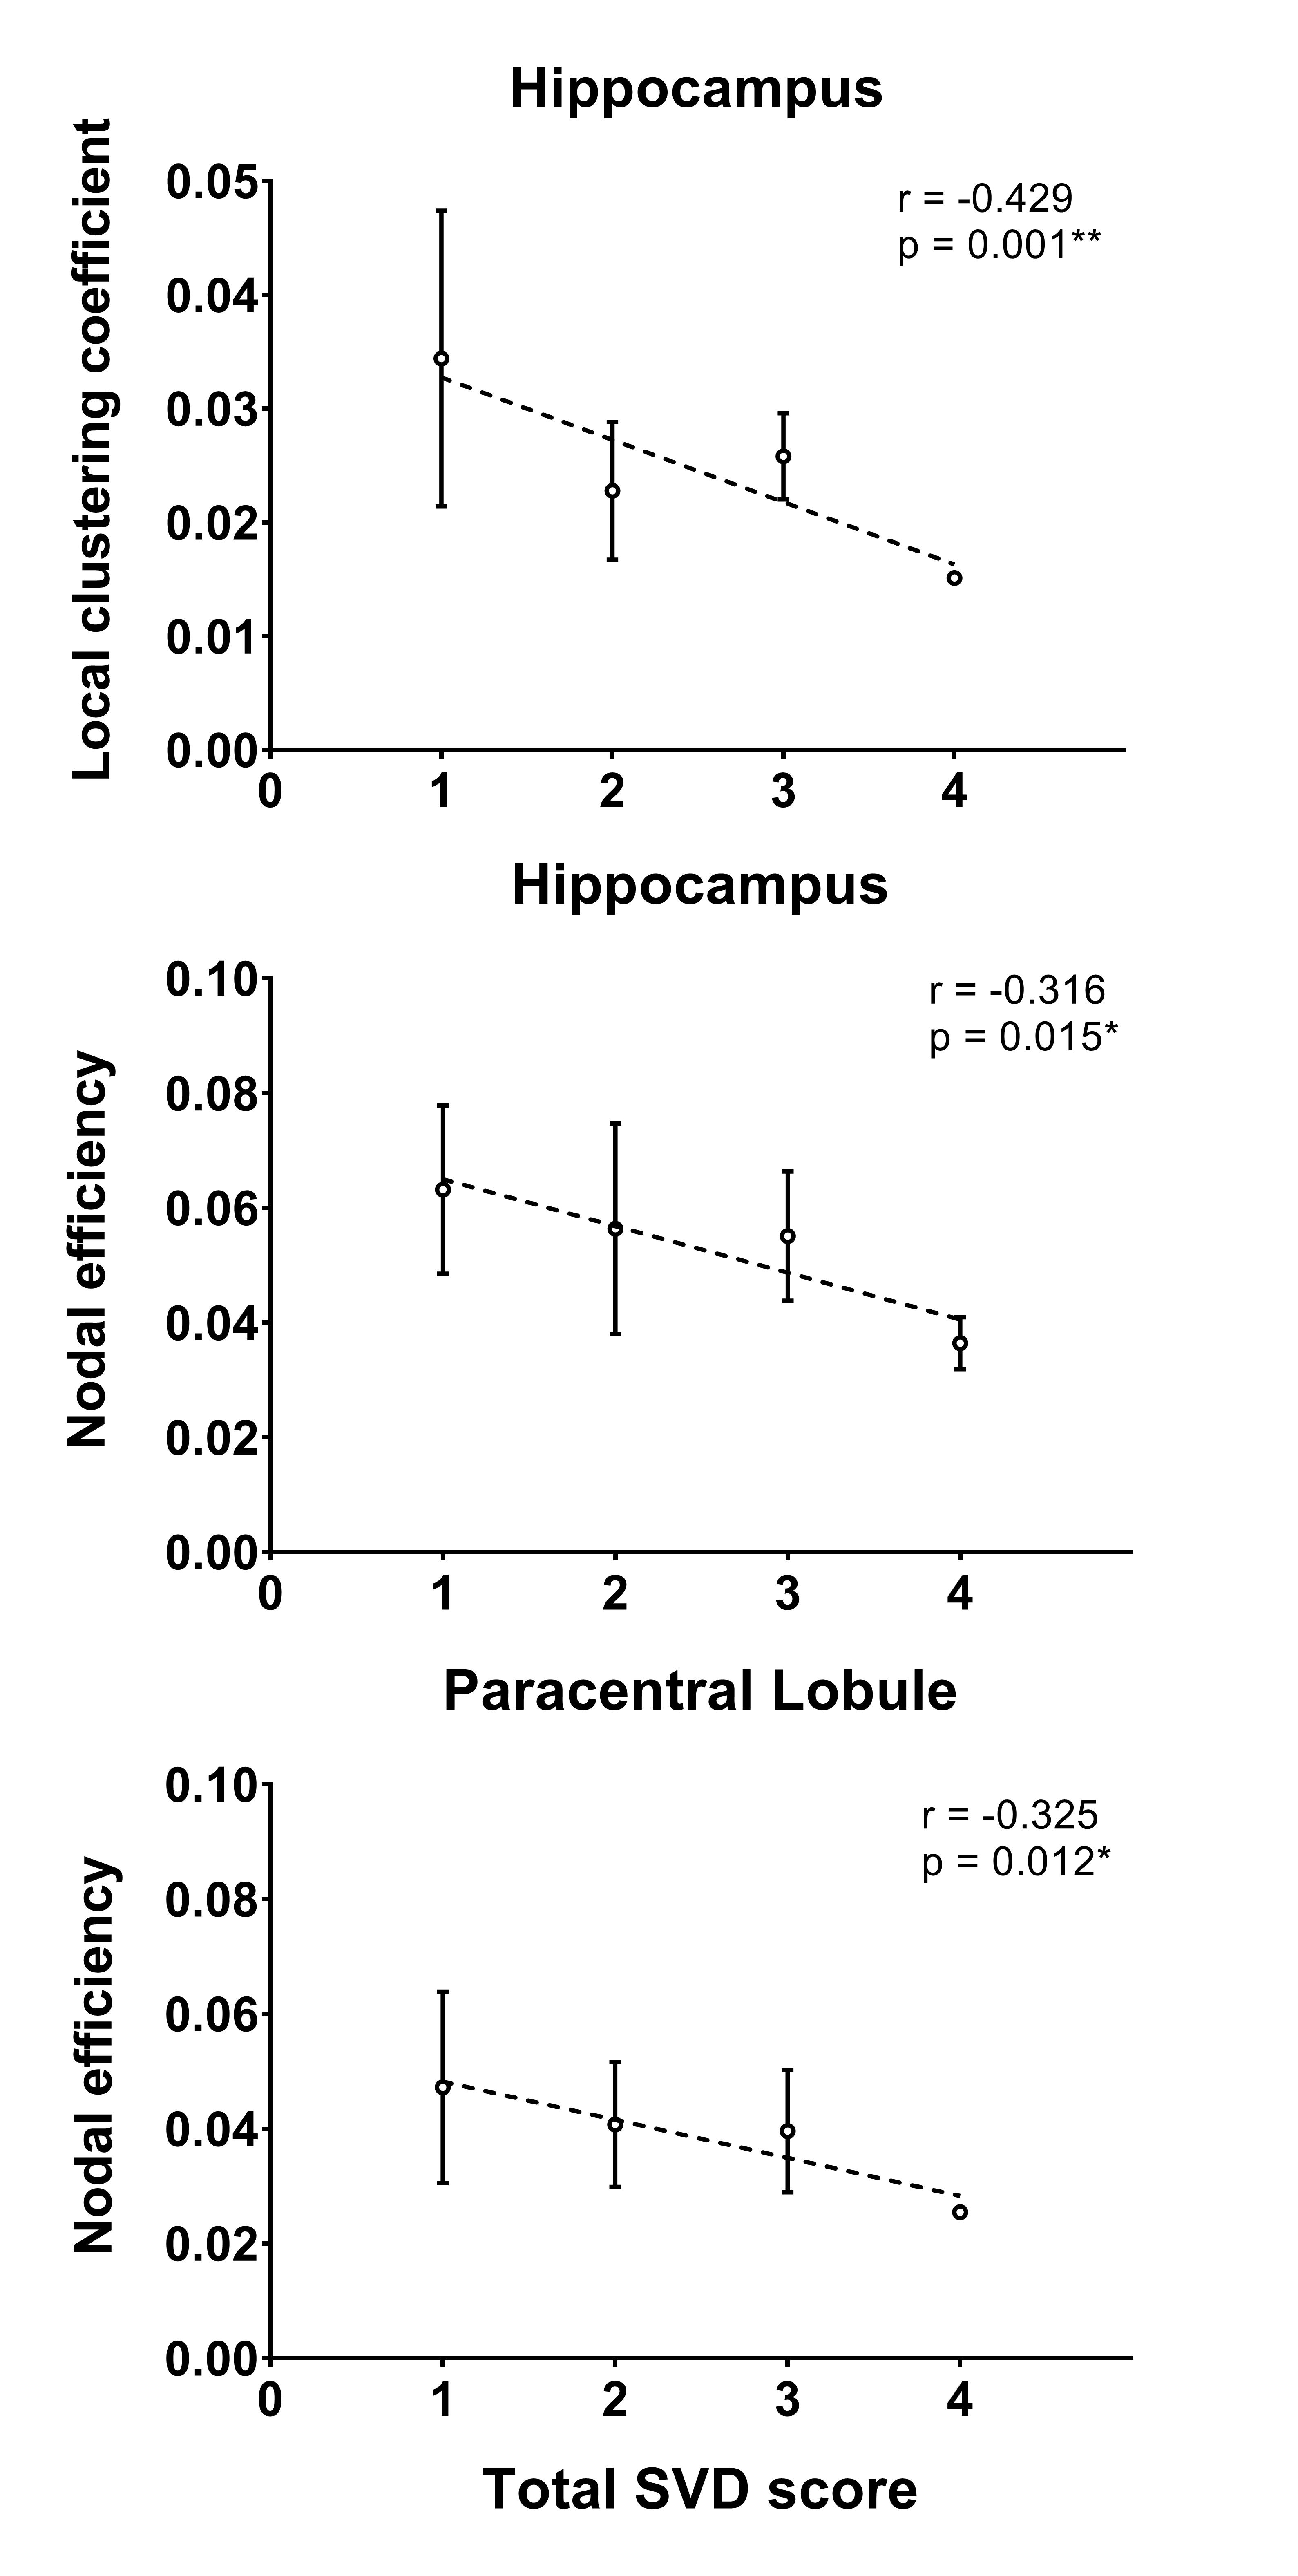
Significantly longer characteristic path length (p = 0.003) and lower global efficiency (p = 0.005) were observed in patients with SVD compared to those without. Lower local clustering coefficient in hippocampus (p = 0.005), lower betweenness centrality in insular (p = 0.039) and precuneus (p = 0.036), as well as decreased nodal efficiency in supplementary motor area (p = 0.021), paracentral lobule (p = 0.045), putamen (p = 0.048) and hippocampus (p = 0.021) were also found in patients with SVD (Figure 1). Characteristic path length (r = 0.337, p = 0.003), global efficiency (r = -0.391, p = 0.002) and local efficiency (r = -0.363, p = 0.005) were correlated with total SVD score (Figure 2). The local clustering coefficient of hippocampus (r = -0.429, p = 0.001), and the nodal efficiency of hippocampus (r = -0.316, p = 0.015) and paracentral lobule (r = -0.325, p = 0.012) were associated with the total SVD score (Figure 3).
Discussions
Functional integration is one of the most essential goals a brain network needs to maintain for supporting cognition and behavior 6. In the current study, the network of stroke or TIA patients with SVD had significantly larger characteristic path length and lower global efficiency, indicating that the ability of rapid information exchange between globally distributed brain regions was compromised 7, potentially related to the impaired general cognitive function of these patients 8. Our results are in line with a previous study, which demonstrated reduced network efficiency in symptomatic SVD 1. In addition to global network changes, disrupted nodal characteristics were also found in multiple brain regions that reside in the limbic system, default mode network and motor system. These local network changes may explain the motor 9 and cognitive disturbance 10 in these patients, and further supported the idea that disrupted structural brain connections might be the most important underlying mechanism behind SVD 11. On the other hand, we found that lower global and regional network efficiency were associated with greater SVD lesion burden or disease severity. Considering that total SVD score is significantly associated with cognitive ability 12 and is predictive of cognitive decline 13, the association between network measures and total SVD score that we observe may serve as corroborative evidence for the notion that structural brain network disruption would lead to cognitive impairment 1,2.Conclusion
Our findings showed that SVD related lesions could lead to widespread disruption in both global and regional network. More importantly, higher SVD burden was associated with greater network disruption, suggesting that network analysis is a potential method to monitor and assess patients with SVD.Acknowledgements
This work was fully supported by the Research Grants Council of the Hong Kong Special Administrative Region, China, HKU 17108514References
1. Lawrence AJ, Chung AW, Morris RG, et al. Structural network efficiency is associated with cognitive impairment in small-vessel disease. Neurology 2014;83:304–11.
2. Tuladhar AM, van Dijk E, Zwiers MP, et al. Structural network connectivity and cognition in cerebral small vessel disease. Hum Brain Mapp 2016;37:300–10.
3. Attems J, Jellinger KA. The overlap between vascular disease and Alzheimer’s disease--lessons from pathology. BMC Med 2014;12:206.
4. Bullmore E, Sporns O. Complex brain networks: graph theoretical analysis of structural and functional systems. Nat Rev Neurosci 2009;10:186–98.
5. Staals J, Makin SDJ, Doubal FN, et al. Stroke subtype, vascular risk factors, and total MRI brain small-vessel disease burden. Neurology 2014;83:1228–34.
6. Sporns O. Network attributes for segregation and integration in the human brain. Curr Opin Neurobiol 2013;23:162–71.
7. Achard S, Bullmore E. Efficiency and Cost of Economical Brain Functional Networks. PLoS Comput Biol 2007;3:e17.
8. Bullmore E, Sporns O. The economy of brain network organization. Nat Rev Neurosci 2012;13:336–49.
9. De Laat KF, Van Norden AGW, Gons RAR, et al. Gait in elderly with cerebral small vessel disease. Stroke 2010;41:1652–8.
10. Love S, Miners JS. Small vessel disease, neurovascular regulation and cognitive impairment: post-mortem studies reveal a complex relationship, still poorly understood. Clin Sci 2017;131.
11. De Laat KF, Tuladhar AM, Van Norden AGW, et al. Loss of white matter integrity is associated with gait disorders in cerebral small vessel disease. Brain 2011;134:73–83.
12. Dromain C, Déandréis D, Scoazec J-Y, et al. Imaging of neuroendocrine tumors of the pancreas. Diagn Interv Imaging 2016;97:1241–57.
13. Uiterwijk R, van Oostenbrugge RJ, Huijts M, et al. Total cerebral small vessel disease MRI score is associated with cognitive decline in executive function in patients with hypertension. Front Aging Neurosci 2016;8:1–8.
Figures