1898
Cross-vendor comparison of cerebrovascular reactivity MRI using hypercapnia challenge1Johns Hopkins University School of Medicine, Baltimore, MD, United States
Synopsis
Cerebrovascular reactivity (CVR) is an important marker of the brain’s vascular health. BOLD MRI with hypercapnia challenge has been shown to be a promising method to measure CVR in various cerebrovascular conditions. To prepare this method for larger-scale multi-site studies, a cross-vendor comparison was performed to evaluate the variability of this CVR mapping method across different scanner platforms. CVR, bolus arrival time and functional connectivity networks were found to be measured reliably from both Philips and Siemens 3T scanners using this method. Although CVR was highly correlated between the two scanners, there was slight difference in CVR values between them.
Introduction
Cerebrovascular reactivity (CVR), a measure of dilatory capacity of blood vessels, is increasingly used in research and clinical studies of cerebrovascular and neurodegenerative diseases1-3. Furthermore, recent studies suggested that a suite of other physiological and functional parameters can be obtained from the CVR data4. To date, all prior CVR reports were based on single-vendor or single-scanner studies. However, in the era of “big-data” medicine, virtually all major studies of diseases and clinical trials such as ADNI, ABCD, and UK Biobank studies are based on a multi-site setting. Thus, MRI techniques must make themselves scalable across sites and vendors in order to adapt to this new trend. Therefore, the goal of this study is to conduct a harmonization study to evaluate the variability of CVR mapping across two major vendors of MRI, providing benchmarks for future large-scale multi-site applications of this highly promising technique.Methods
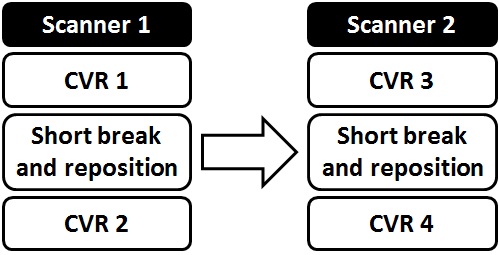
Study design: Ten healthy subjects (4 females, age 24.0±3.2y) participated in this study. Each subject was scanned on a Philips (Achieva) and a Siemens (Prisma) 3T scanner within a 2.5-hour period (Figure 1). On each scanner, CVR scans were performed twice with repositioning. Results were compared both within vendors and across vendors.
CVR scan: The subject breathed room-air and 5% CO2 (with 21% O2 and 74% N2) in an interleaved fashion while BOLD EPI images were acquired continuously. End-tidal CO2, the CO2 concentration in the lung and thus arterial blood, was recorded throughout the breathing task. The BOLD EPI protocols were maximally matched between the two scanners: FOV=205x205mm2, resolution=3.2x3.2mm2, TR/TE/FA=1500ms/21ms/90°, scan duration=7min. For these TR and TE values, the maximum number of slices allowed was found to be different across scanners: 36 for Philips, and 33 for Siemens. We therefore adjusted the slice thicknesses to ensure that the total spatial coverage was comparable.
Data analysis: Following the analysis methods described previously4, three sets of physiological maps were obtained from this single scan. First, a map of bolus-arrival-time (BAT), a timing parameter indicating the time shift between the end-tidal (Et) CO2 time course and BOLD signal time course, was quantified. Next, a CVR map was obtained using a linear regression between the (shifted) Et-CO2 time course and BOLD signal. Finally, the residual BOLD signals after removing the CO2 effect were analyzed with a dual-regression procedure to yield functional connectivity networks (FCN). These parametric measures were compared across vendors using t tests, correlation analyses, and coefficients of variation (CoV).
Results
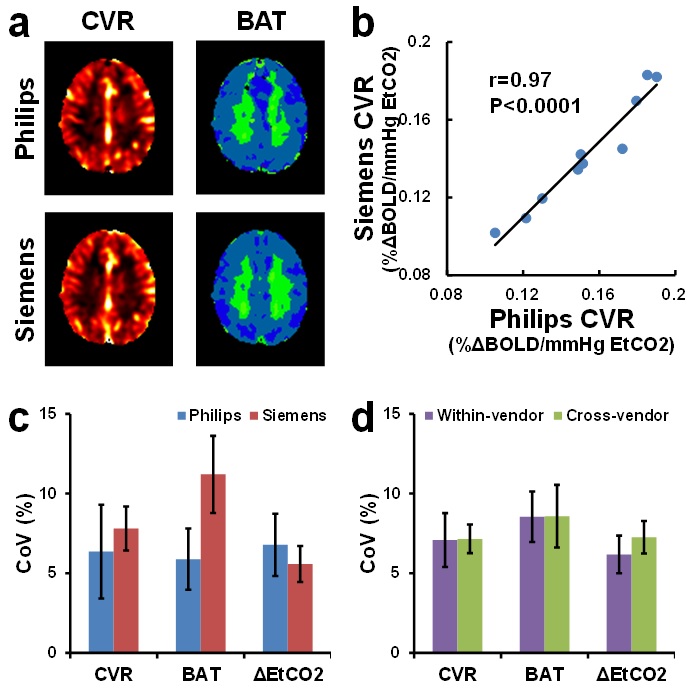
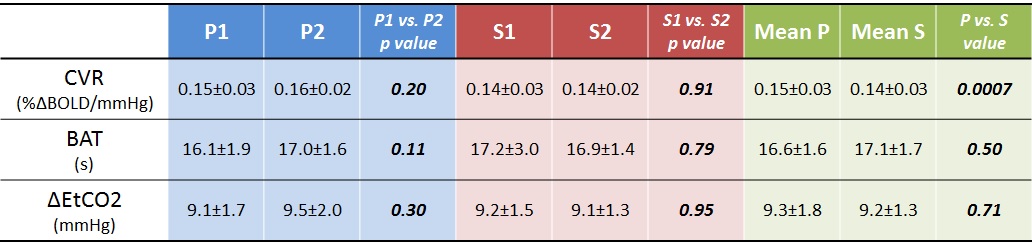
Figure 2a shows CVR and BAT maps from a representative subject. Both maps show similar contrast between the two scanners. Whole-brain averaged CVR, BAT and hypercapnia-induced EtCO2 changes (ΔEtCO2) are summarized in Table 1. Two sessions performed on each scanner are shown separately in Table 1 to provide an assessment of within-vendor reproducibility, in addition to the across-vendor assessment. Student t tests revealed that neither BAT nor ΔEtCO2 showed any significant within-vendor or across-vendor differences. CVR showed no difference between the sessions on the same scanner. The CVR values were strongly correlated between the two scanners (Figure 2b). However, a slightly higher CVR was observed on the Philips scanner (0.15±0.03 %ΔBOLD/mmHg) compared to the Siemens scanner (0.14±0.03 %ΔBOLD/mmHg).
Inter-session CoV of CVR, BAT and ΔEtCO2 showed no statistically significant difference between the two scanners (Figure 2c, uncorrected p=0.67, 0.13, 0.62, respectively). These values are in agreement with previous literature5. Cross-vendor CoV of these three measures were not different from within-vendor CoV (Figure 2d, uncorrected p=0.96, 0.98, 0.10, respectively), suggesting a good reproducibility of this CVR measurement across different vendors.
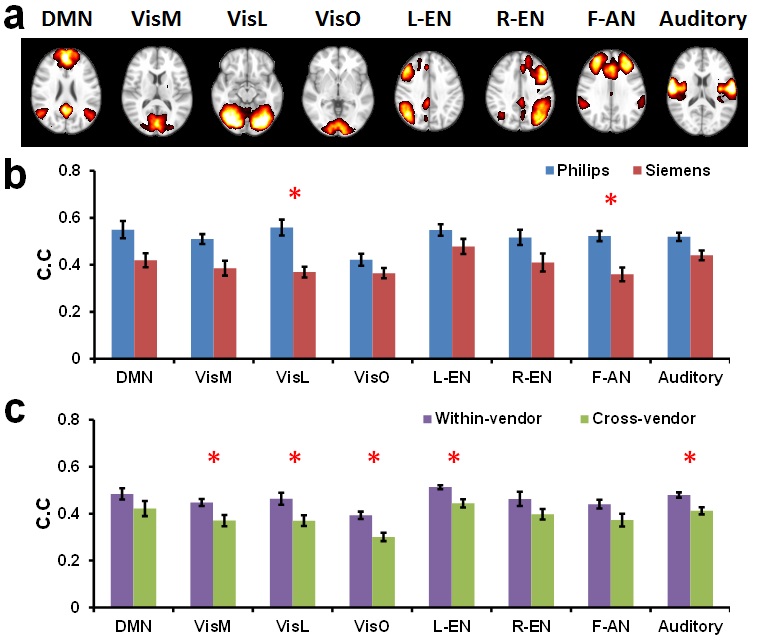
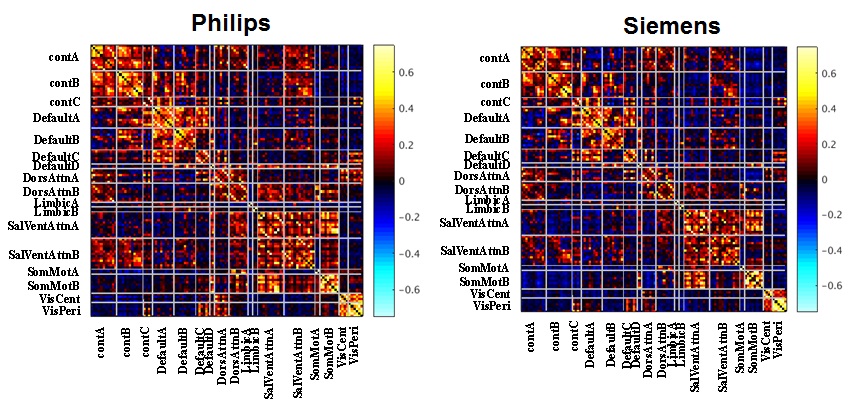
Using ICA, eight major FCNs were generated reliably from the CVR data (Figure 4a). Spatial correlations of individual-subject FCNs obtained from the two sessions were higher for the Philips than the Siemens scanner (0.51±0.02 vs. 0.40±0.02, p=0.003) (Figure 4b). Cross-vendor correlation was found to be significantly lower than within-vendor correlation (0.38±0.02 vs. 0.46±0.02, p=0.0005) (Figure 3c). Correlation matrices obtained with ROI analysis revealed an excellent agreement between the scanners (Figure 4d, correlation between matrics=0.88).
Discussion and conclusion
We conducted a cross-vendor comparison study to evaluate the CVR mapping technique using BOLD MRI with a hypercapnia challenge. CVR, BAT and FCNs can be measured reliably from both scanners using this method. The CVR values from the two scanners are highly correlated, although Siemens data yielded slightly lower CVR values. FCNs also showed good agreement between the two scanners. CoV of the measured parameters was comparable or lower than other physiological imaging techniques such as ASL. Our results suggest that BOLD CVR mapping is a promising candidate for multi-site imaging studies of brain function.Acknowledgements
No acknowledgement found.References
1. Yezhuvath US, Uh J, Cheng Y, Martin-Cook K, Weiner M, Diaz-Arrastia R, van Osch M, Lu H. Forebrain-dominant deficit in cerebrovascular reactivity in Alzheimer's disease. Neurobiol Aging. 2012;33(1):75-82.
2. Donahue MJ, Dethrage LM, Faraco CC, Jordan LC, Clemmons P, Singer R, Mocco J, Shyr Y, Desai A, O'Duffy A, Riebau D, Hermann L, Connors J, Kirshner H, Strother MK. Routine clinical evaluation of cerebrovascular reserve capacity using carbogen in patients with intracranial stenosis. Stroke. 2014;45(8):2335-41.
3. Marshall O, Lu H, Brisset JC, Xu F, Liu P, Herbert J, Grossman RI, Ge Y. Impaired cerebrovascular reactivity in multiple sclerosis. JAMA Neurol. 2014;71(10):1275-81.
4. Liu, P., Welch, B.G., Li, Y., Gu, H., King, D., Yang, Y., Pinho, M., Lu, H., 2017. Multiparametric imaging of brain hemodynamics and function using gas-inhalation MRI. Neuroimage 146, 715-723.
5. Ravi H, Thomas BP, Peng SL, Liu H, Lu H. On the optimization of imaging protocol for the mapping of cerebrovascular reactivity. J Magn Reson Imaging. 2016;43(3):661-8.
Figures