1897
3D multi-shot(ms) Spin-Stimulated Echo(STE) EPI sequence Technique for accurate T1 quantification of contrast uptake within vulnerable large artery plaque1UCAIR, Department of Radiology and Imaging Sciences, University of Utah, Salt Lake City, UT, United States, 2Department of Neurology, University of Utah, Salt Lake City, UT, United States, 3Department of Veterans Affairs, VASLCHCS, Salt Lake City, UT, United States
Synopsis
Large artery atherosclerotic disease is one of the most common causes of ischemic stroke. Post-contrast plaque enhancement (PPE), which may result from endothelial dysfunction or be secondary to intraplaque inflammation, is a vulnerable plaque feature that correlates with increased stroke risk independent of stenosis. Although PPE can be detected with vessel wall MRI better quantitative methods to measure PPE are needed. This work presents a new 3D high resolution T1 mapping technique for accurate T1 quantification of contrast uptake within vulnerable large artery plaque.
Purpose
Large artery atherosclerotic disease is one of the most common causes of ischemic stroke in the world1,2. Post-contrast plaque enhancement (PPE), which may result from endothelial dysfunction (breakdown along the intima) or be secondary to intraplaque inflammation and adventitial neovessel rupture, is a vulnerable plaque feature that correlates with increased stroke risk independent of stenosis3-6. Although PPE can be detected with vessel wall MRI (vwMRI) better quantitative methods to measure PPE are needed. Currently, T1 weighted signal intensity increase has been used to estimate uptake of paramagnetic contrasts such as Gadolinium(Gd)7. However, this relative signal intensity increase not only reflects contrast uptake but depends also on tissue and sequence parameters. It is well known that 1/T1 (R1) is directly related to the uptake of contrast agent on the tissue over time8. This work presents a new 3D high resolution T1 mapping technique for accurate T1 quantification of contrast uptake within vulnerable large artery plaque.Methods
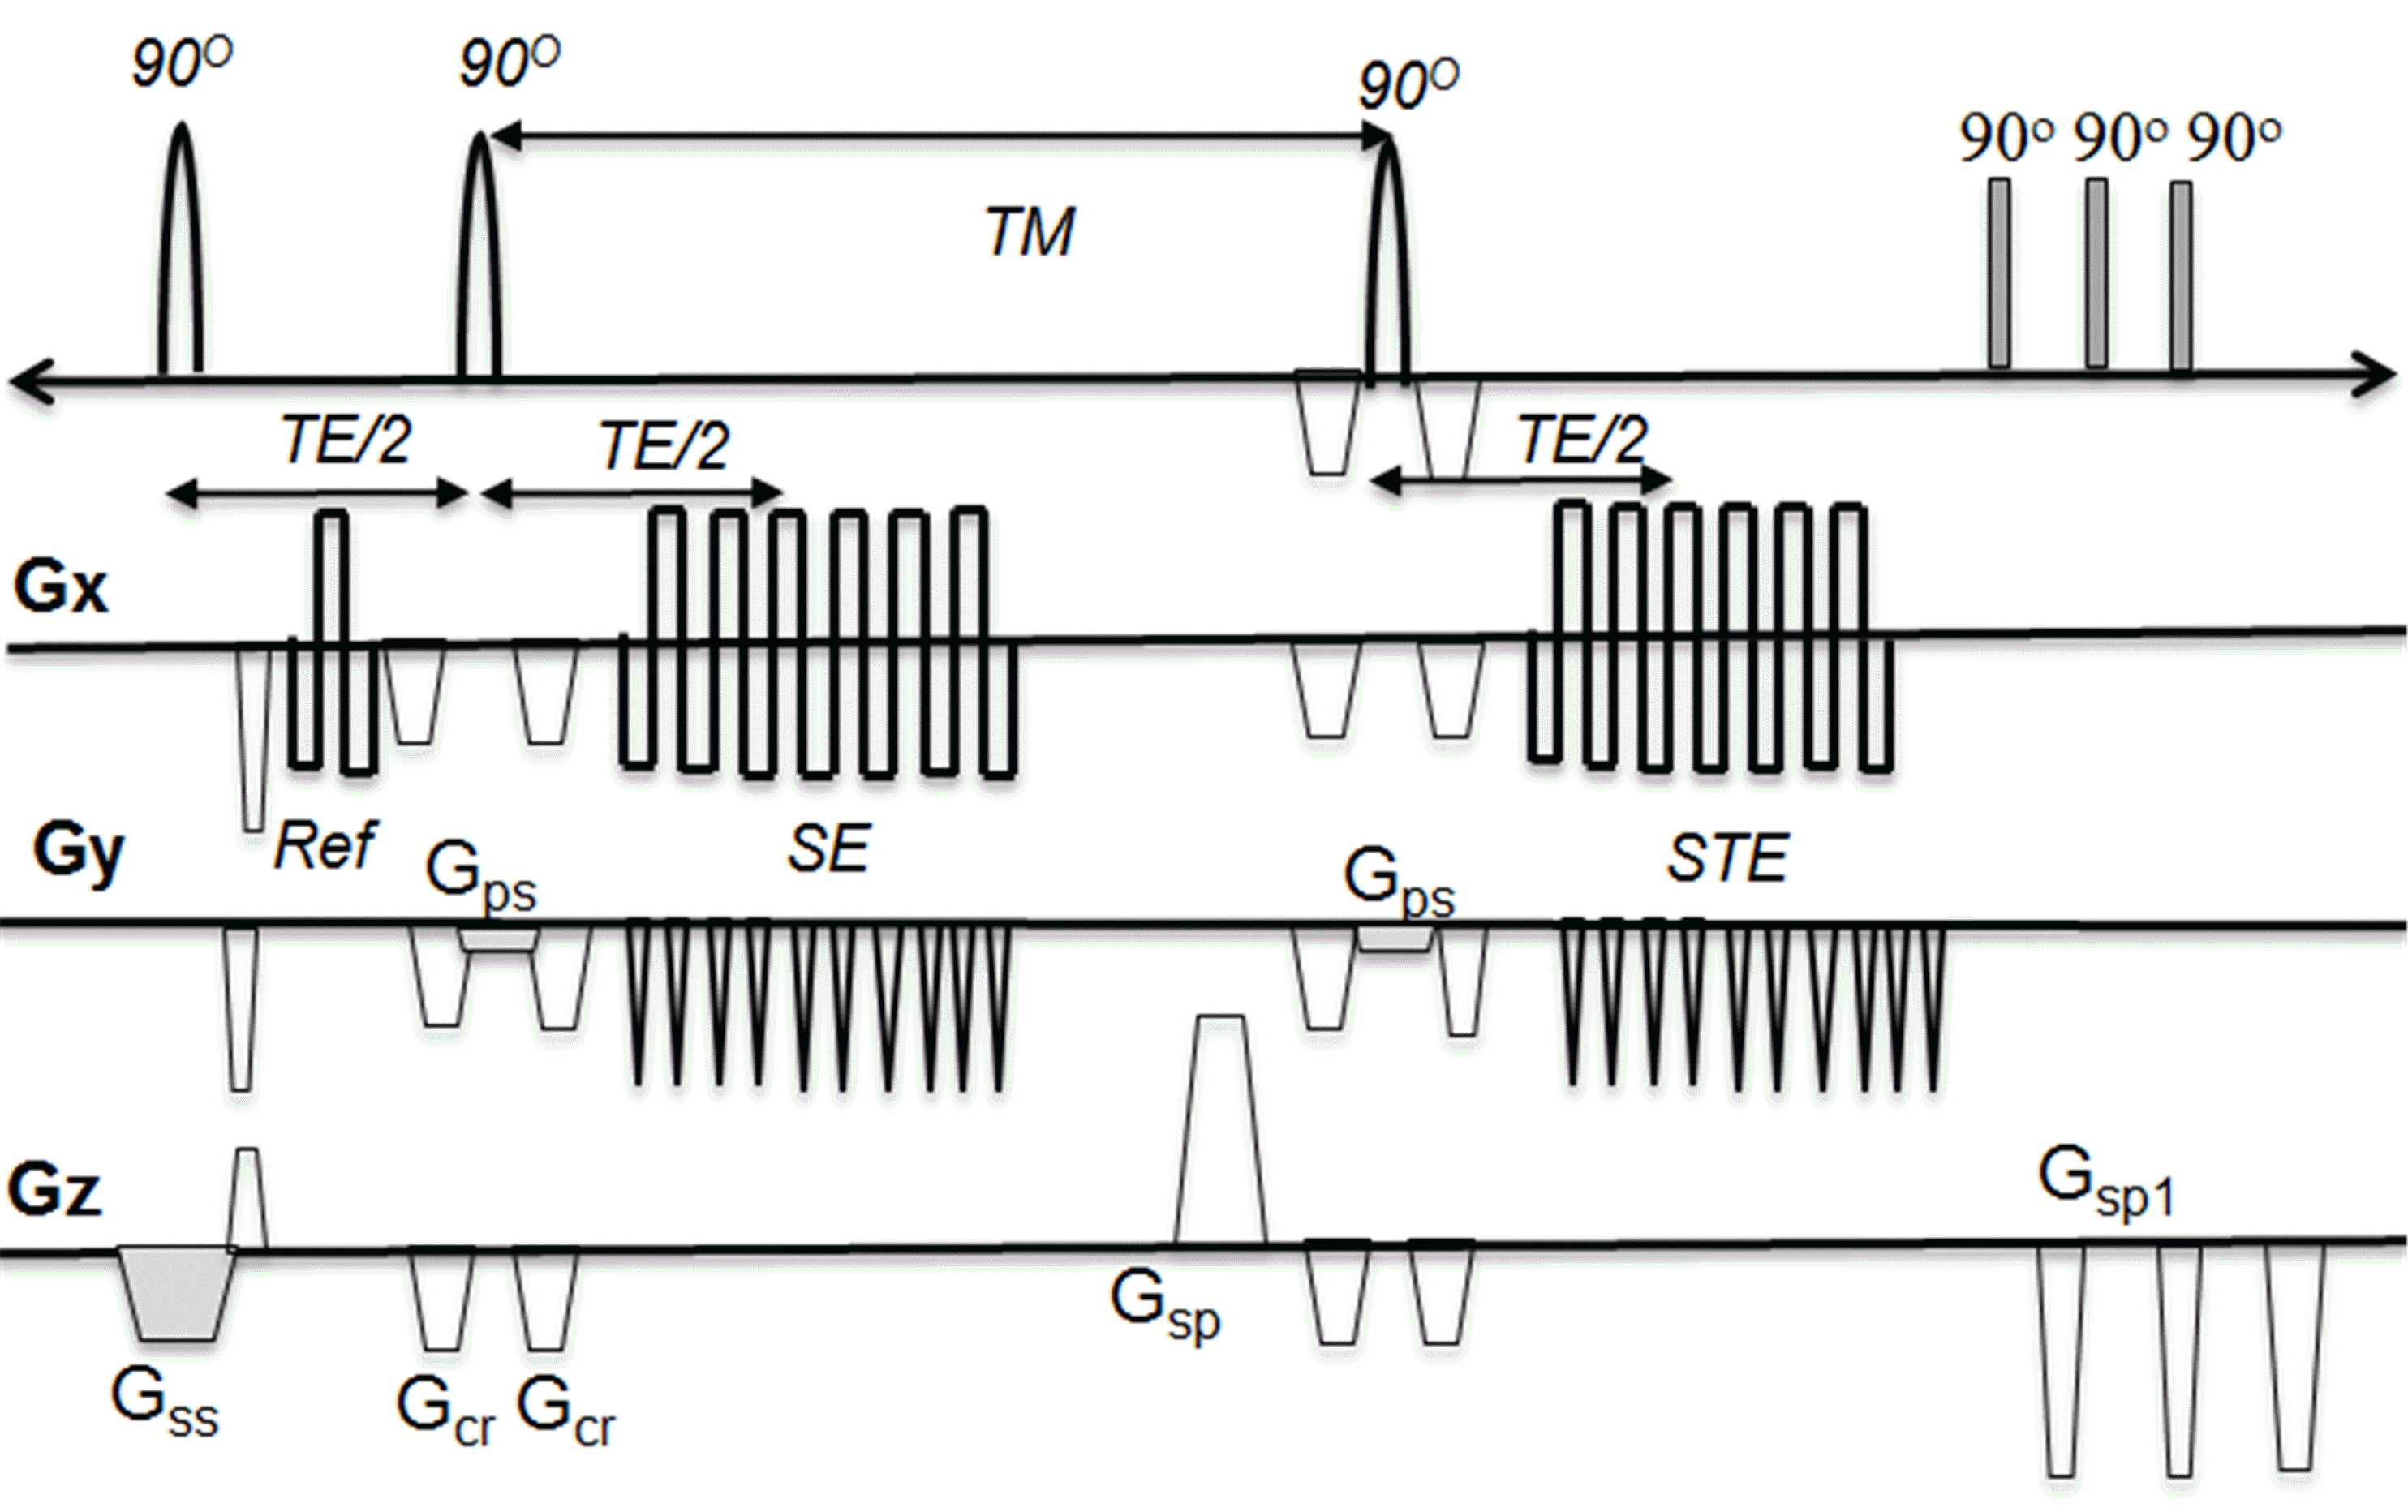
The 3D multi-shot(ms) Spin-Stimulated Echo(STE) EPI sequence was implemented with a segmented 3D ms EPI sequence (see Fig 1). For reduced field of view imaging, the slice selection gradients of the last two 90O pulses (Gps) was applied in the phase encoding direction. For perfect 90o RF pulses, the measured T1 is: $$$\frac{1}{T_{1}(\overrightarrow{r})}=\frac{lnS_{SE}(\overrightarrow{r})-lnS_{STE} (\overrightarrow{r}) }{TM}$$$ where SSE, SSTE are signal intensity of SE and STE, respectively. For non perfect 90o RF pulses (B1 inhomogeneity), the STE signal becomes: $$$S_{STE}(\overrightarrow{r})=S_{SE}(\overrightarrow{r})*g(\overrightarrow{r})*e^{-\frac{TM}{T_{1}}}$$$ where $$$g(\overrightarrow{r})$$$ is B1 mapping. For small TM / T1, $$$g(\overrightarrow{r})\cong \frac{S_{STE}}{S_{SE}}$$$. To validate the T1 measurement, 3D ms-STE EPI was performed on a cylindrical phantom filled with a solution of MnCl2 (T1 ~1200ms) with imaging parameters: TE/TM/TR= 20.2/ 250/ 500ms, in plane resolution =0.5x0.5 mm2, slice thickness =1.0mm, 48 slices/slab, etl=17. Scan time was 3:20 min. With IRB approved informed consent, the 3D ms-STE EPI acquisition was performed on two human subjects with known large artery atherosclerosis before and after Gd administration with same imaging parameters used on the phantom. We also performed the 3D DANTE T1w SPACE imaging. All scans were performed on a 3T MRI system with composite head and neck coils. R1 (1/ T1) and T1 maps were calculated and displayed using software written in Python.Results
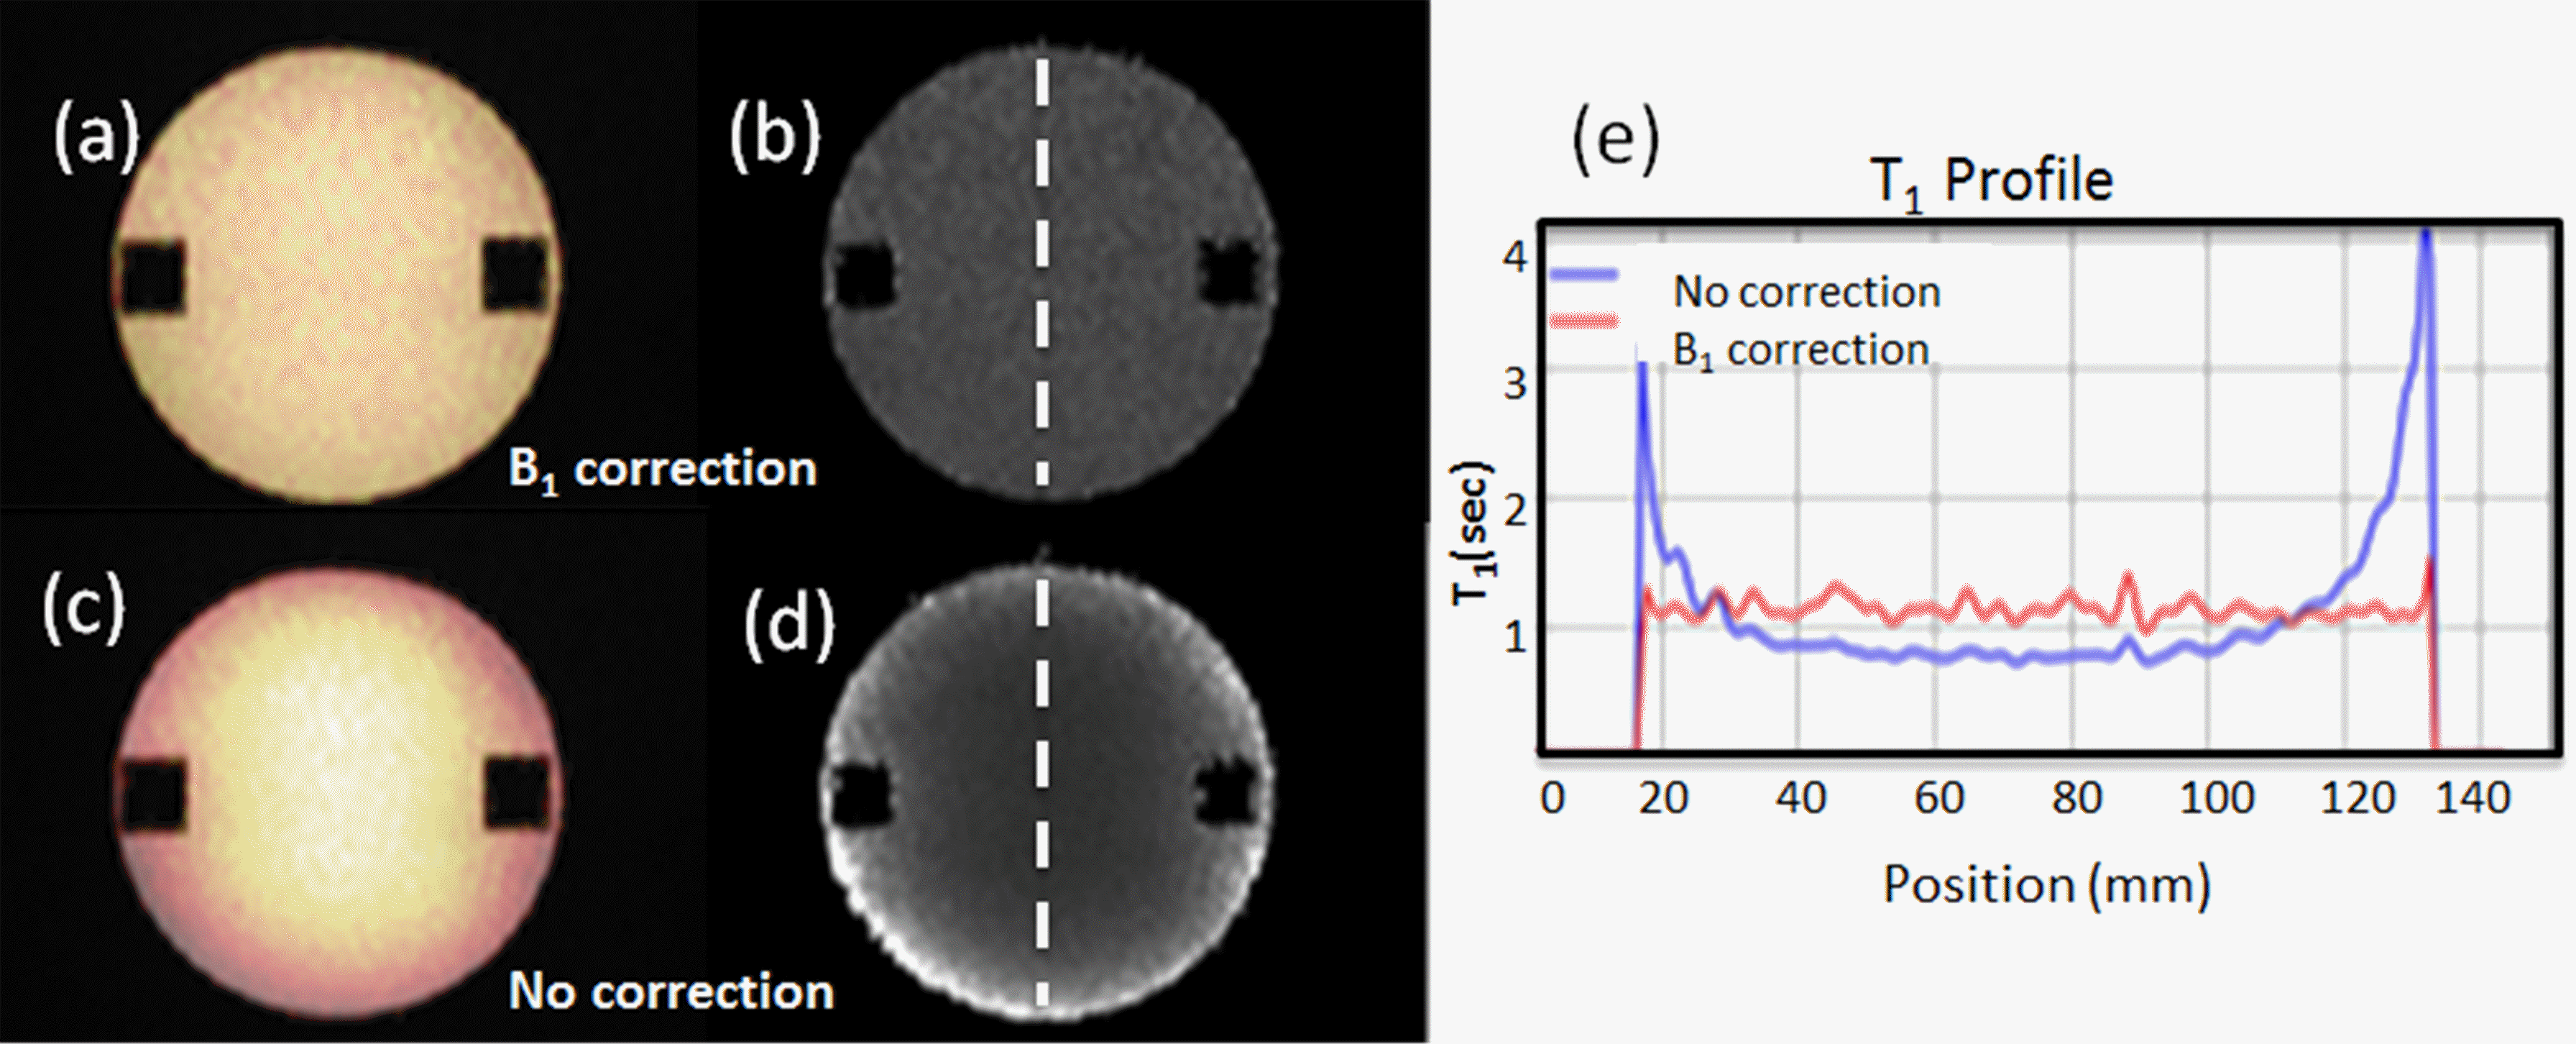
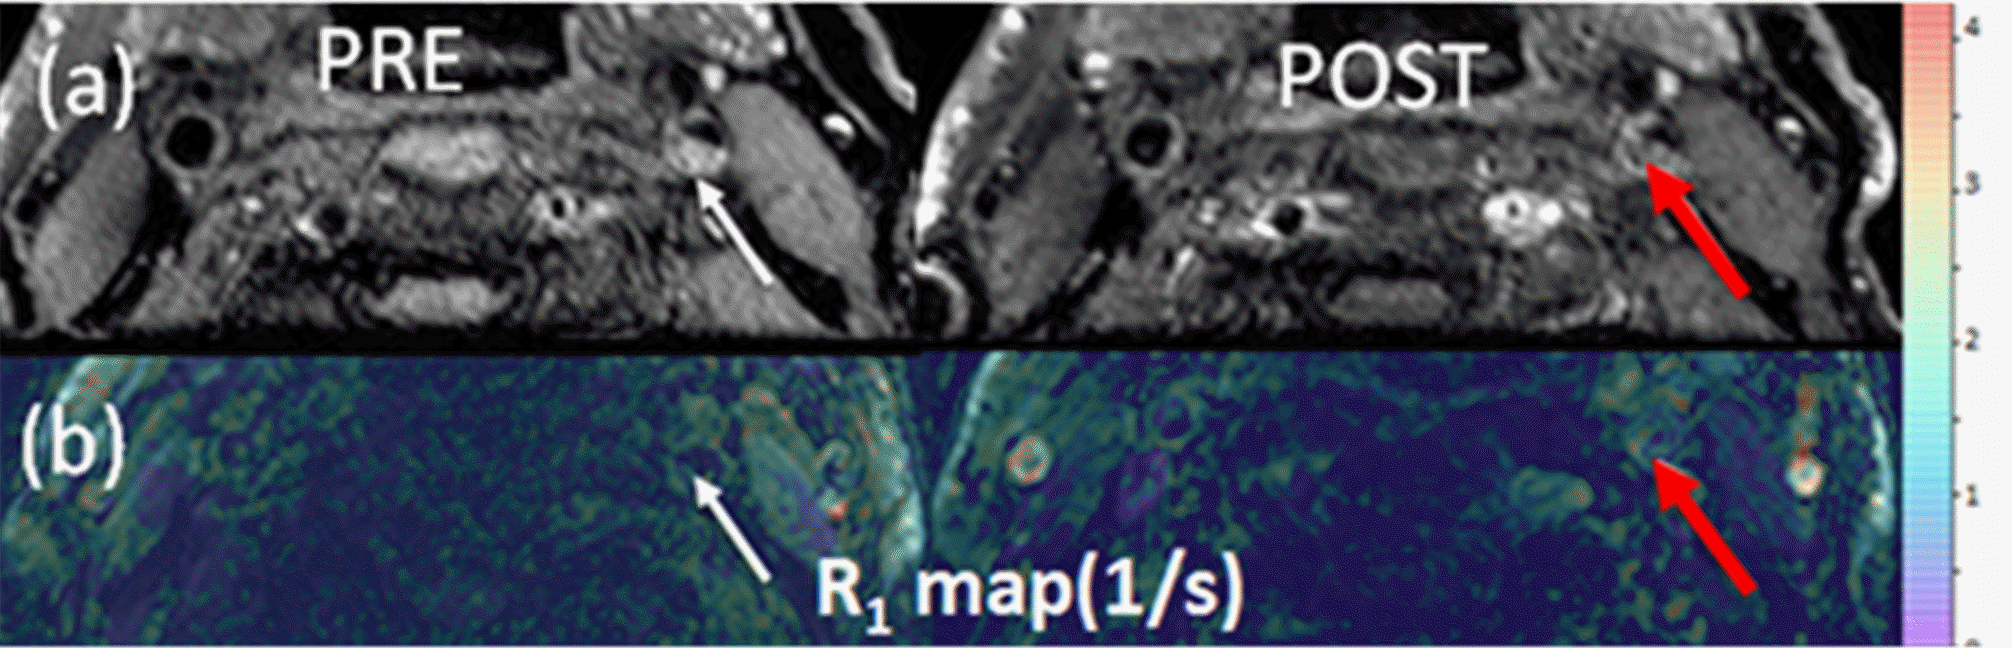
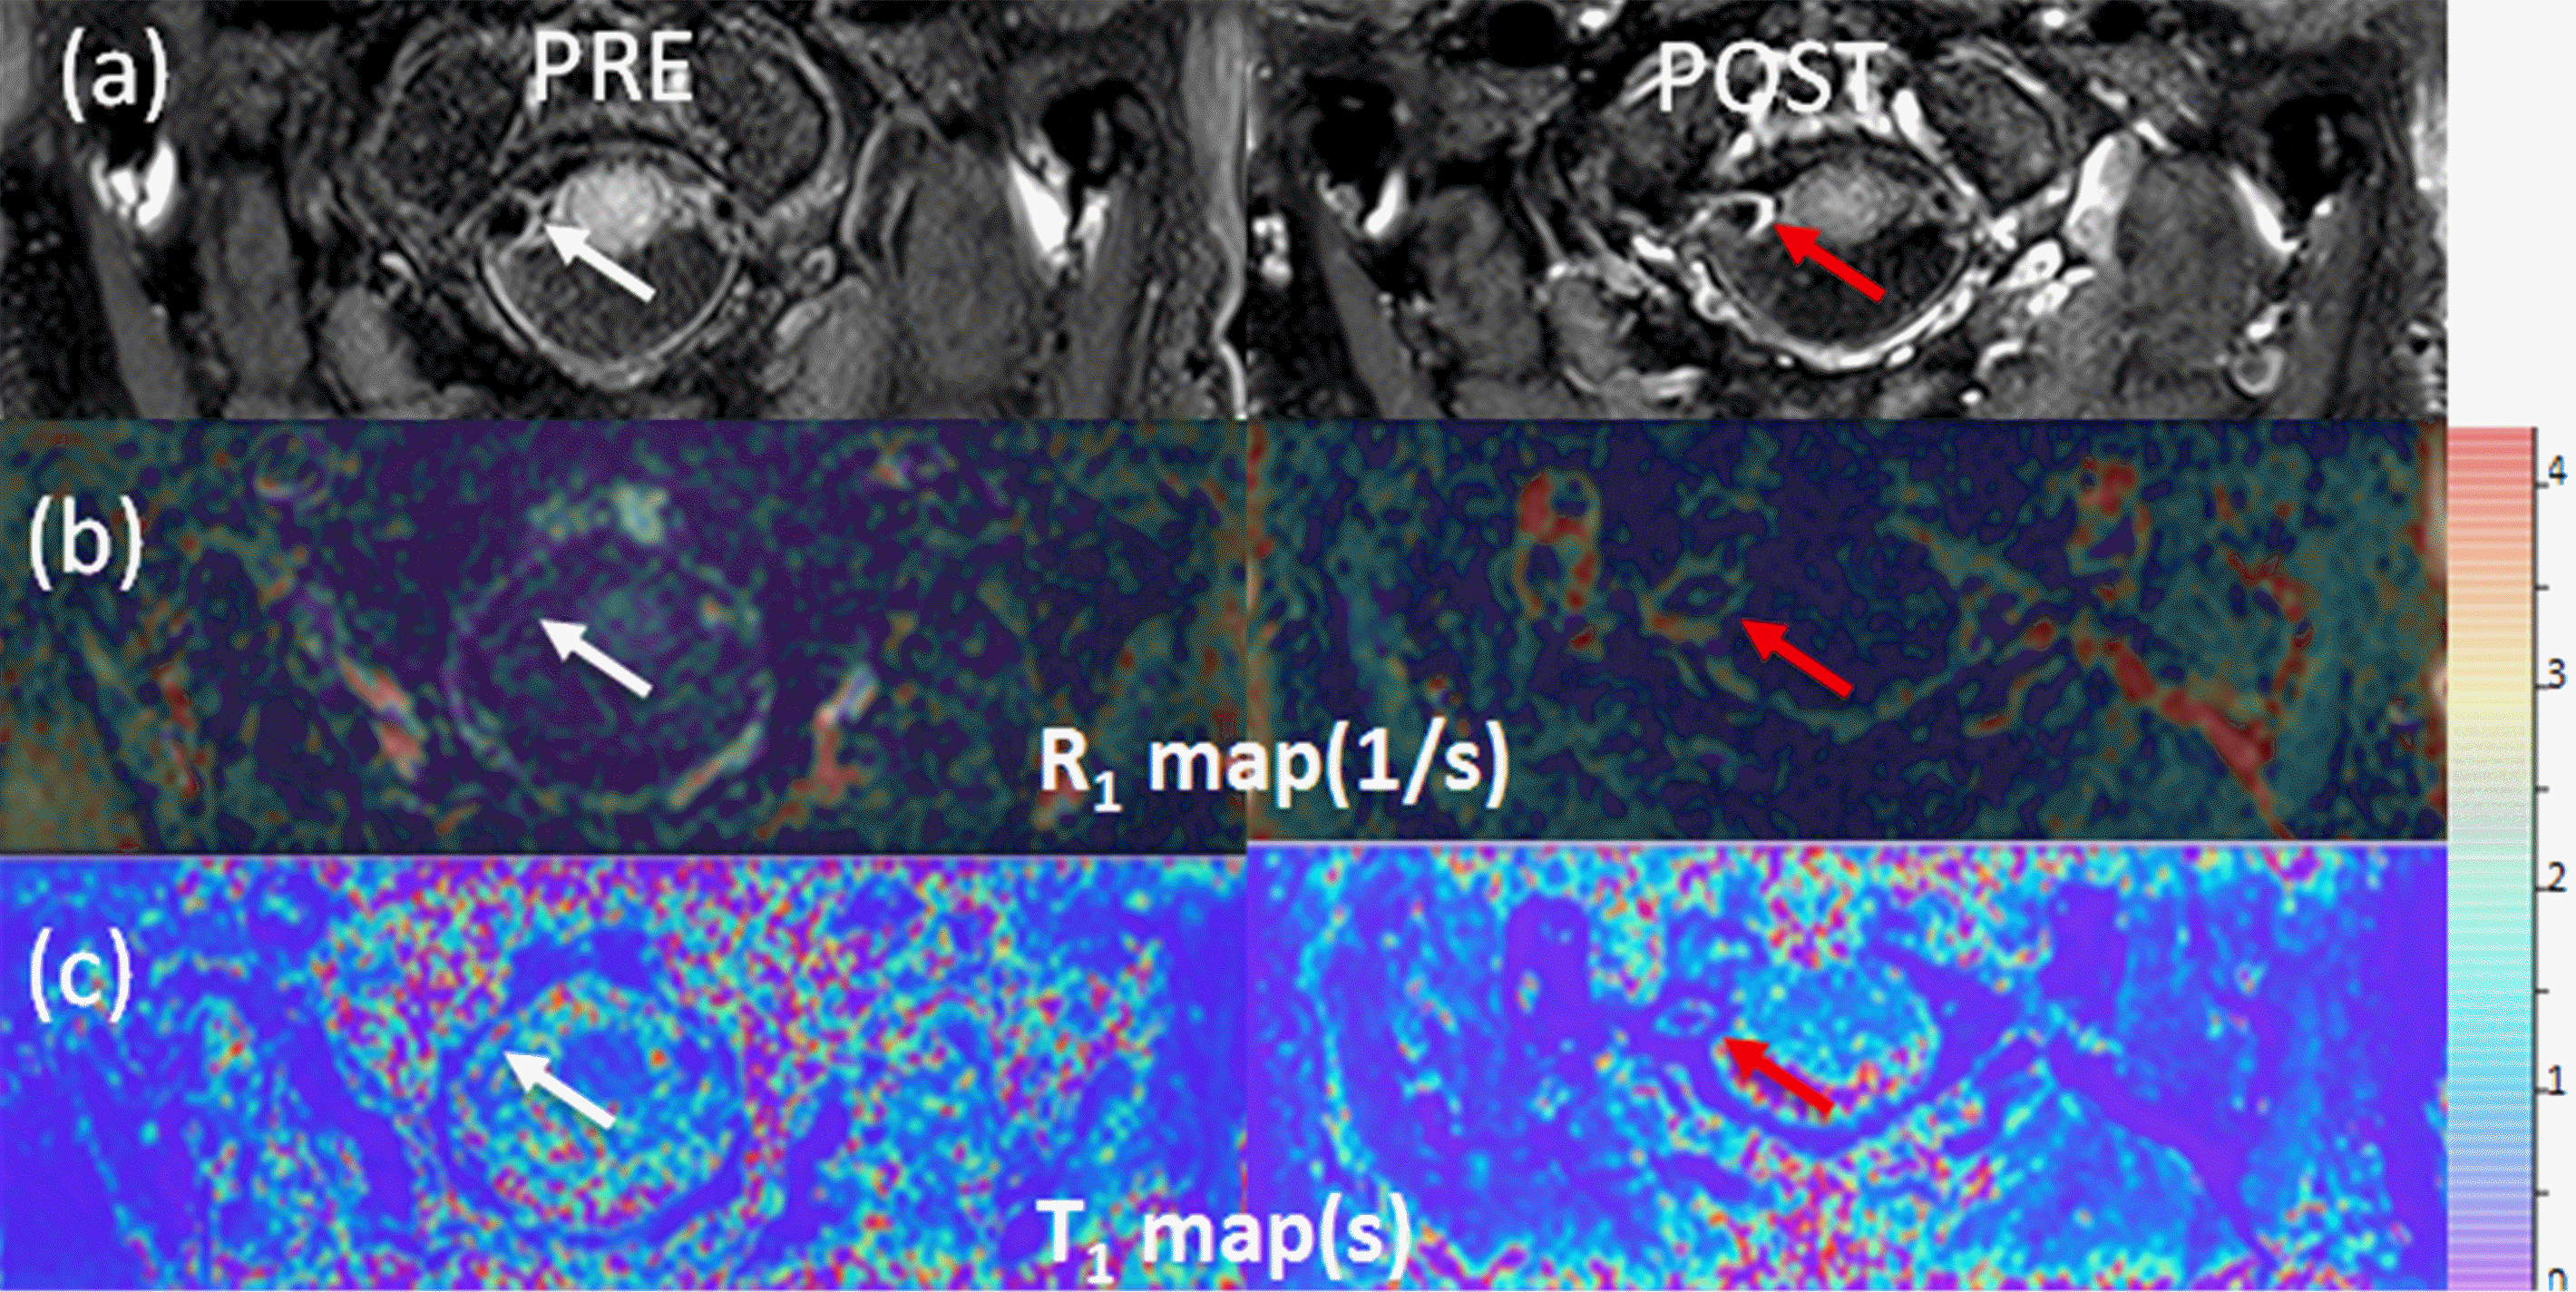
The phantom study results are shown in the Fig 2. R1 (a) and T1 (b) maps with B1 correction were more uniform across the phantom compared to R1(c) and T1 (d) maps without correction. The almost complete elimination of B1 inhomogeneity using the proposed B1 correction is also demonstrated by the plots in Fig 2d. Fig 3 shows 3D DANTE T1w SPACE images (a) and R1 maps (b) in a left internal carotid artery atherosclerotic plaque before and after contrast. The R1 value of the plaque was elevated from 1.75±0.84/s (white arrow, pre contrast) to 3.02±0.98/s (red arrow, post contrast), indicating active contrast uptake within the plaque. Fig 4 shows the 3D DANTE T1w SPACE (a), R1 (b) and T1 maps (c) of intracranial atherosclerotic plaque in the right vertebral artery pre and post contrast. The post T1w image shows PPE within the vertebral artery plaque (red arrow). The mean R1 (white arrow on b) and T1 (white arrow on c) before contrast were 1.11±0.78/s and 895.45±22.25ms, respectively. The post R1 in the plaque (red arrow on b) was increased to 3.07±1.02/s and the post T1 (red arrow on c) was decreased to 325±99.24ms.Discussion
The resultant T1 measurement obtained using 3D ms-STE EPI agreed well with true T1 values of the phantom. B1 correction using the determined ($$$g(\overrightarrow{r})$$$) is robust and experimentally measurable using our sequence. By limiting acquisition to the desired region of interest, the reduced FOV technique can acquire the desired region in less scan time. The difference between pre and post R1 maps can provide quantification of contrast uptake, which may be more predictive of plaque vulnerability and a better metric to monitor treatment effects compared to visual inspection. T1 measured using 3D ms-STE EPI may decrease with a lower TM/T1 ratio because there would be not enough changes in the T1 decay with short TM. However, because the T1 of muscle or vessel wall are estimated to be less than 1 sec at 3T and the T1 of plaque components such as intraplaque hemorrhage may be much lower, a TM of 250 ms may be suitable for T1 mapping for atherosclerotic plaque.Conclusion
3D me-STE EPI allows quantification of contrast uptake of atherosclerotic plaque. This may provide important information for clinicians and investigators interested in quantifying plaque vulnerability and monitoring treatment effects.Acknowledgements
Supported by R01 HL127582, Siemens Medical Solutions, The Ben B. and Iris M. Margolis Foundation, and the Clinical Merit Review Grant from the Veterans Administration health Care SystemReferences
1. Suri MFK, Johnston SC. Epidemiology of intracranial stenosis. J Neuroimaging Off J Am Soc Neuroimaging 2009;19 Suppl 1:11S–6S.
2. Bang OY. Intracranial Atherosclerosis: Current Understanding and Perspectives. J Stroke 2014;16:27–35. Moody AR, Murphy RE, Morgan PS, et al. Characterization of complicated carotid plaque with magnetic resonance direct thrombus imaging in patients with cerebral ischemia. Circulation 2003;107(24):3047-3052.
3. de Havenon A, Chung L, Park M, et al. Intracranial vessel wall MRI: a review of current indications and future applications. Neurovascular Imaging 2016;2(10).
4. Celletti FL, Waugh JM, Amabile PG, et al. Vascular endothelial growth factor enhances atherosclerotic plaque progression. Nature medicine 2001;7(4):425-429.
5. Libby P, Ridker PM, Maseri A. Inflammation and atherosclerosis. Circulation 2002;105(9):1135-1143.
6. Galis ZS, Sukhova GK, Lark MW, et al.Increased expression of matrix metalloproteinases and matrix degrading activity in vulnerable regions of human atherosclerotic plaques. The Journal of clinical investigation 1994;94(6):2493-2503; PMCID: 330083.
7. Swartz RH, Bhuta SS, Farb RI, et al Intracranial arterial wall imaging using high-resolution 3-tesla. Neurology 2009;72;627
8. Nicolle GM, Toth E. Schimitt-Willich H, et al. The impact of rigidity and water exchange on the relaxivity of dendritic MRI contrast agent. Chem Eur J 2002:8-9.
Figures