1896
Mean Transit Time as a Marker of Vascular Change in Asymptomatic White Matter Disease1Department of Electrical and Computer Engineering, Johns Hopkins University, Baltimore, MD, United States, 2Kirby Center for Functional Brain Imaging, Kennedy Krieger Institute, Baltimore, MD, United States, 3Department of Radiology and Radiological Sciences, Johns Hopkins University, Baltimore, MD, United States, 4Department of Medical Radiation Physics, Lund University, Lund, Sweden, 5Athinoula A. Martinos Center for Biomedical Imaging, Harvard Medical School, Boston, MA, United States, 6Department of Neurology, Johns Hopkins University, Baltimore, MD, United States
Synopsis
White matter hyperintensity (WMH) has been associated with cognitive and motor decline. The condition is of presumed vascular origin and may involve decreased blood brain barrier (BBB) integrity. A double contrast injection scheme was used to access both dynamic contrast enhanced (DCE) and dynamic susceptibility contrast (DSC) perfusion-related parameters in an asymptomatic population with high prevalence of WMH. The mean transit time (MTT) was found to be significantly prolonged (5.87, p=0.002) in WMH when compared to normal appearing white matter and that there was no significant change in Ktrans (0.018, p=0.351) between the lesions and the white/gray matter.
Purpose
White matter hyperintensity (WMH) of presumed vascular origin associated with aging has been associated with later cognitive and motor decline. The underlying pathophysiology is hypothesized to be intermittent hypoperfusion secondary to changes of the small vessels due to the effects of hypertension or other atherosclerotic risk factors. This decrease in perfusion results in intermittent decreased oxygen delivery to the tissue. The condition may also involve decreased blood-brain barrier (BBB) integrity. In this study, we used a double MRI contrast injection scheme[1] to access both dynamic contrast enhanced (DCE) and dynamic susceptibility contrast (DSC) perfusion-related parameters such as mean transit time (MTT), and the volume transfer coefficient (Ktrans) to study an asymptomatic population with high prevalence of WMH.Methods
This pilot study was approved by the local Institutional Review Board. 21 participants (54.1 ± 3.5 years, 45% hypertensive) provided informed consent and underwent 3T MRI (Philips Achieva) with a 32-channel head coil. Images were acquired involving two separate bolus injections of gadolinium (ProHance, Bracco Imaging, Milan, Italy)[1]. Two structural images were acquired before gadolinium injection: a 3D T1-weighted MPRAGE (1mm3 isotropic resolution,) and a 2D T2-weighted FLAIR (0.98x0.93x3mm3 resolution). T1-mapping was also performed before gadolinium using an inversion recovery Look-Locker sequence (2x2.2x4mm3). Two doses of contrast agent were used in the study with dosage of 0.1mmol/kg and 5cc/s injection rate. During the first contrast injection, DCE data were acquired with a T1-weighted gradient echo sequence (FA =26°, TE = 2.5ms, TR = 5.1ms, 2x2.2x4mm3, 150 dynamics, 14 pre-contrast baseline images). A post contrast MPRAGE image was then acquired using the parameters mentioned above. After ~10 minutes from the first contrast injection, a second dose of contrast agent was administrated and DSC imaging was performed. (Single-shot gradient echo EPI, TE = 29ms, TR = 1500ms, 2x2x4mm3, 100 dynamics, 10 pre-contrast baseline images). After acquisition, structural images were processed using a fully automated pipeline, BRAINMAP[2], which performed image registration using the ANTs software package[3], skull removal using Multi-cONtrast brain STRipping (MONSTR)[4], whole-brain grey/white matter segmentation using Multi-Atlas Cortical Reconstruction Using Implicit Surface Evolution (MACRUISE)[5] and lesion segmentation using Subject-Specific Sparse Dictionary Learning (S3DL)[6]. Automatically segmented lesion masks were manually edited to remove false positives common to this process. T1-map, DCE and DSC data were processed using Nordic-Ice (NordicNeuroLab, Norway) including motion correction and semi-automatic selection of the arterial input function (AIF). The baseline DSC and DCE images were averaged together and rigidly registered to the MPRAGE image using ANTs. The perfusion parameter maps were transformed using the registration transform and values extracted using segmentation masks for each of the white matter (WM), grey matter (GM) and lesions (WML). All region masks were eroded twice prior to extraction to avoid partial volume contamination with normal tissue. The mean of each region was calculated and a Wilcoxon rank-sum test was performed to determine statistical significance of region differences.Results/Discussion
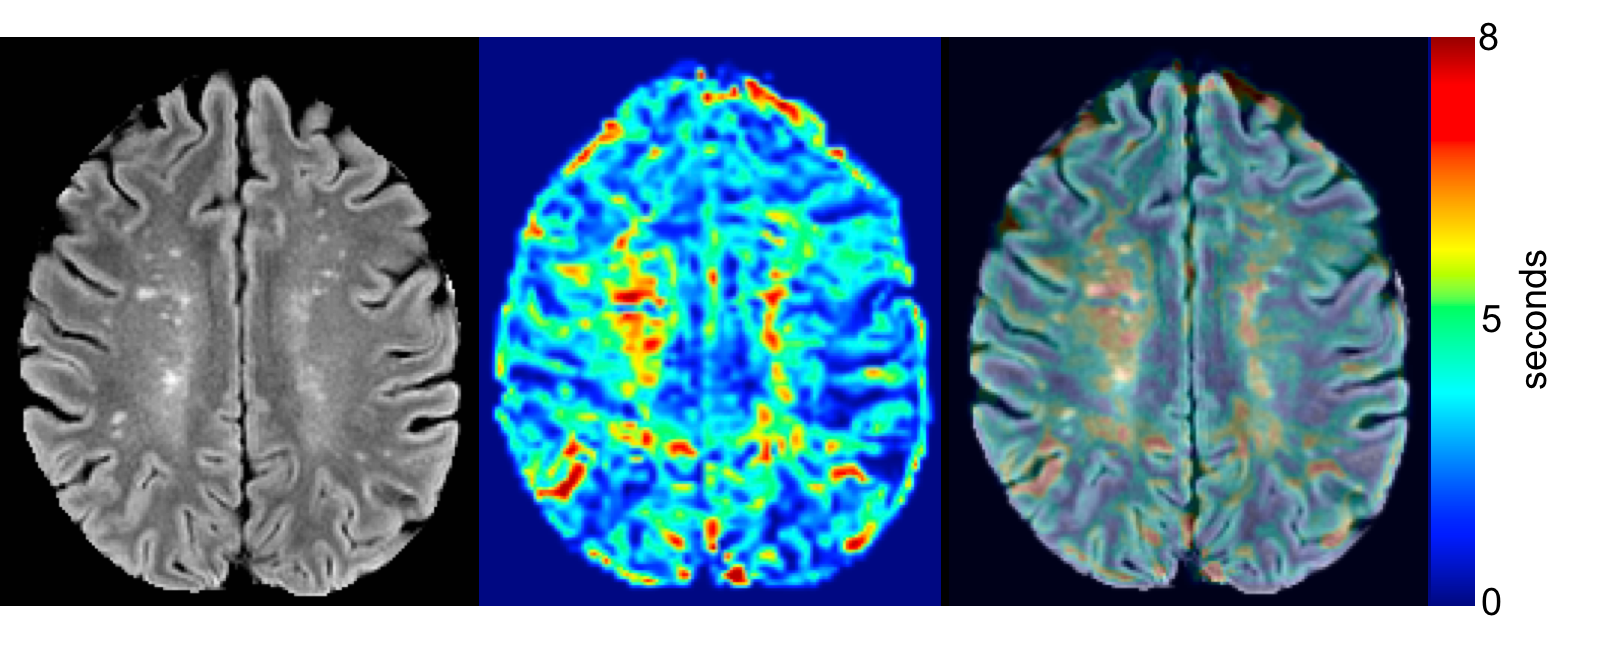
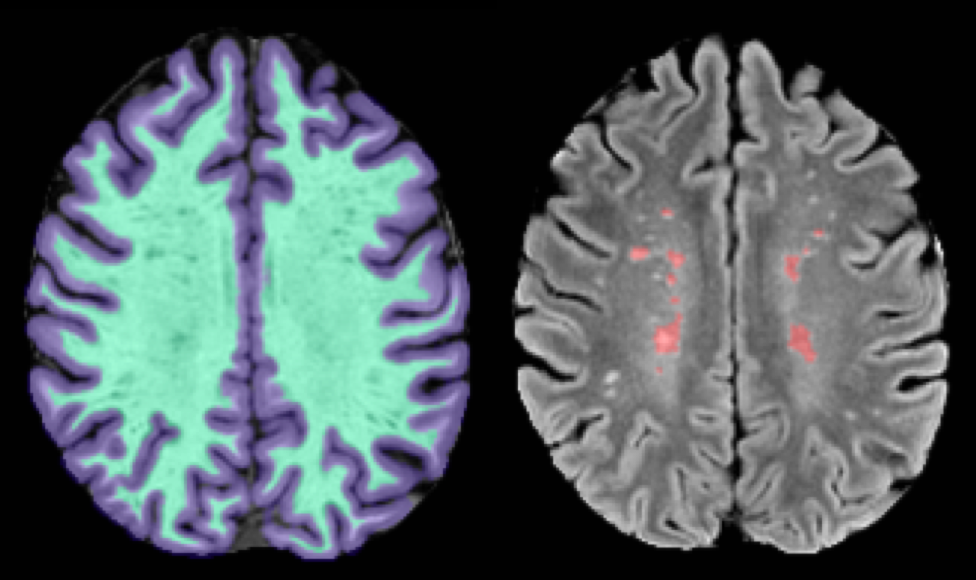
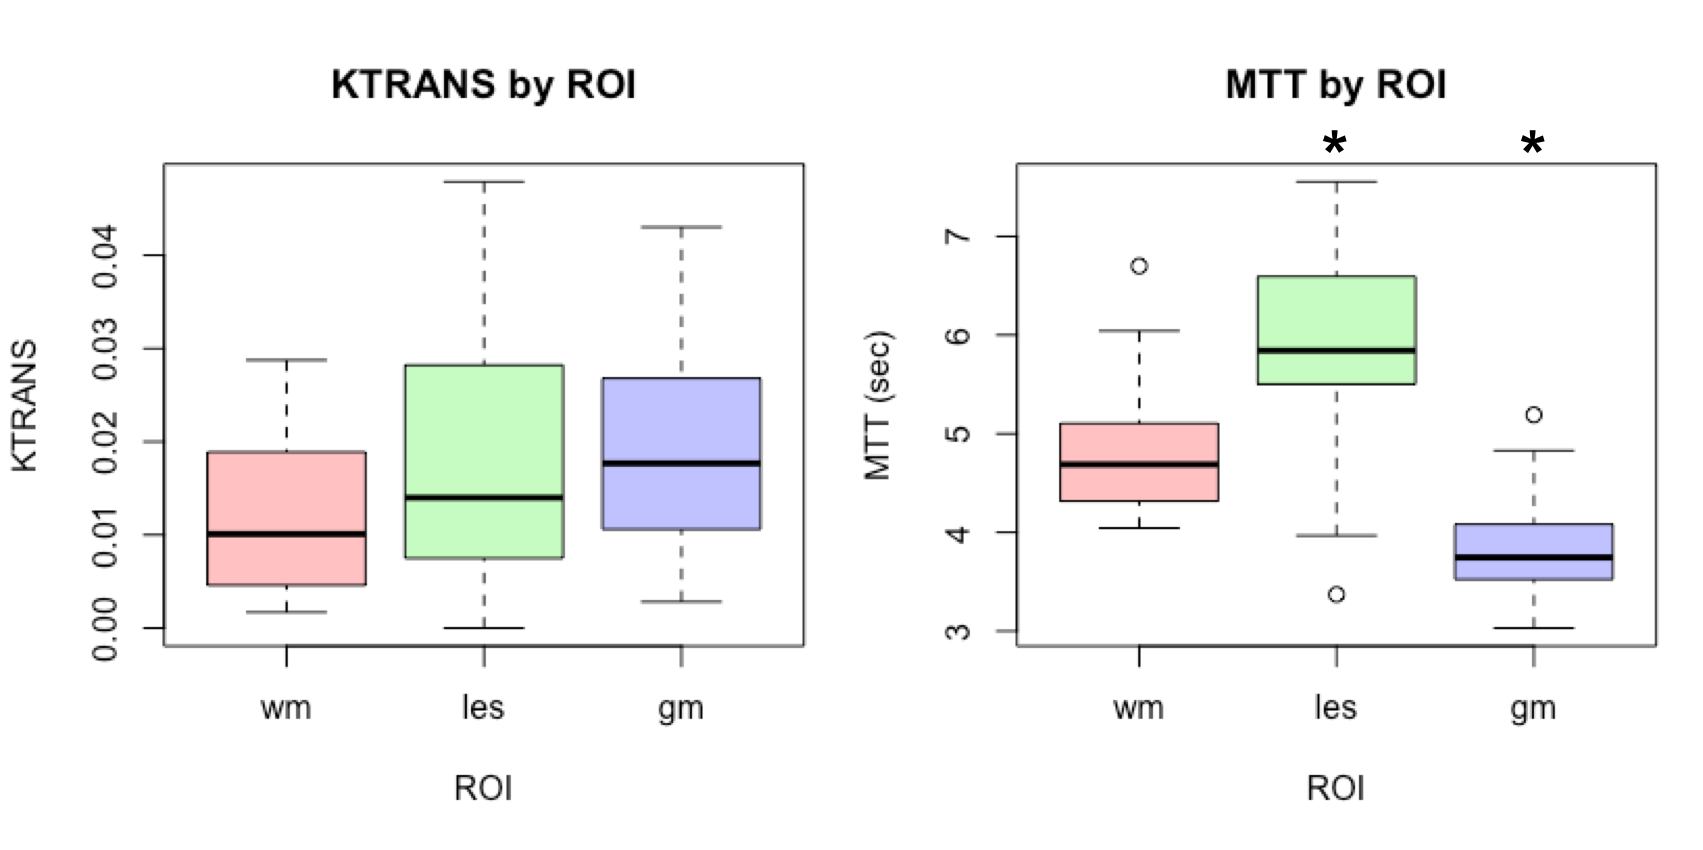
None of the subjects showed any contrast enhancement on the post-contrast MPRAGE. After processing, two subjects were excluded due to excess motion. Representative images for the perfusion maps of one patient are presented in Figure 1. Figure 2 shows the results of segmentation and alignment from the same subject and the same slice as presented in Figure 1. Notice that the MTT slices are interpolated to match the FLAIR resolution, but the underlying resolution remains 2x2x4mm. Overall, this cohort of subjects was heterogeneous according to total lesion volume (mean: 2820mm3 ± 2609mm3). Figure 3 shows boxplots of the mean values for each ROI for Ktrans (left) and MTT (right). MTT was significantly prolonged in WML compared to normal appearing WM (p=0.002), suggesting that these lesioned areas of the brain have associated vascular pathology. We also see that there is a small but significant difference in MTT for the WM and GM ROIs (p<0.0001), with values that are consistent with current literature[7]. This demonstrates confidence in the analysis methods. For Ktrans, we found no significant difference between the WM and GM (p=0.07) or between WM and WML (p=0.351). The uniformity suggests BBB integrity is not compromised in the current cohort, but could also be due to the limited SNR of DCE measurements or composite nature of Ktrans.Conclusion
In this cohort of an asymptomatic population with high prevalence of WMH, we found that identified WML showed significant differences in MTT with no significant difference in Ktrans. Further research will consider the statistical modeling of patient data with respect to clinical data and the addition of other disease courses to measure the contribution of vascular pathology to overall disease course.Acknowledgements
The first two authors (B.E. Dewey and X. Xu) contributed equally to this work. This work was supported by Johns Hopkins Department of Anesthesia STaRR award.References
[1] Essig, M., Shiroishi, M. S., Nguyen, T. B., Saake, M., Provenzale, J. M., Enterline, D., et al. (2013). Perfusion MRI: the five most frequently asked technical questions. AJR. American Journal of Roentgenology, 200(1), 24–34. http://doi.org/10.2214/AJR.12.9543
[2] Dewey et al. ECTRIMS Online Library. October 26, 2017
[3] Avants, B. B., Tustison, N. J., Song, G., Cook, P. A., Klein, A., & Gee, J. C. (2011). A reproducible evaluation of ANTs similarity metric performance in brain image registration. Neuroimage, 54(3), 2033–2044. http://doi.org/10.1016/j.neuroimage.2010.09.025
[4] Roy, S., Butman, J. A., Pham, D. L., Alzheimers Disease Neuroimaging Initiative. (2017). Robust skull stripping using multiple MR image contrasts insensitive to pathology. Neuroimage, 146, 132–147. http://doi.org/10.1016/j.neuroimage.2016.11.017
[5] Huo, Y., Plassard, A. J., Carass, A., Resnick, S. M., Pham, D. L., Prince, J. L., & Landman, B. A. (2016). Consistent cortical reconstruction and multi-atlas brain segmentation. Neuroimage, 138, 197–210. http://doi.org/10.1016/j.neuroimage.2016.05.030
[6] Roy, S., He, Q., Sweeney, E., Carass, A., Reich, D. S., Prince, J. L., & Pham, D. L. (2015). Subject-Specific Sparse Dictionary Learning for Atlas-Based Brain MRI Segmentation. IEEE Journal of Biomedical and Health Informatics, 19(5), 1598–1609. http://doi.org/10.1109/JBHI.2015.2439242
[7] Perkiö, J., Aronen, H. J., Kangasmäki, A., Liu, Y., Karonen, J., Savolainen, S., & Østergaard, L. (2002). Evaluation of four postprocessing methods for determination of cerebral blood volume and mean transit time by dynamic susceptibility contrast imaging. Magnetic Resonance in Medicine, 47(5), 973–981. http://doi.org/10.1002/mrm.10126
Figures